R E S E A R C H
Open Access
Relations between mental workload and
decision-making in an organizational
setting
María Soria-Oliver
1, Jorge S. López
2*and Fermín Torrano
1Asbtract
Background:The complexity of current organizations implies a potential overload for workers. For this reason, it is of interest to study the effects that mental workload has on the performance of complex tasks in professional settings.
Objective:The objective of this study is to empirically analyze the relation between the quality of decision-making, on the one hand, and the expected and real mental workload, on the other.
Methods:The study uses an ex post facto prospective design with a sample of 176 professionals from a higher education organization. Expected mental workload (Pre-Task WL) and real mental workload (Post-Task WL) were measured with the unweighted NASA-Task Load Index (NASA-TLX) questionnaire; difference between real WL and expected WL (Differential WL) was also calculated; quality of decision-making was measured by means of the Decision-Making Questionnaire.
Results:General quality of decision-making and Pre-Task WL relation is compatible with an inverted U pattern, with slight variations depending on the specific dimension of decision-making that is considered. There were no verifiable relations between Post-Task WL and decision-making. The subjects whose expected WL matched the real WL showed worse quality in decision-making than subjects with high or low Differential WL.
Conclusions:The relations between mental workload and decision-making reveal a complex pattern, with evidence of nonlinear relations.
Background
Current organizational settings frequently imply high complexity and high demands from their workers. Occu-pational activity can therefore involve levels of demands
that go beyond the person’s cognitive capacity of analysis
and decision-making (Ferrer & Dalmau, 2004; Rolo, Díaz, & Hernández, 2009). The existing empirical studies present indicators along these lines. Thus, recent official surveys in the European setting indicate a growing inci-dence of labor problems reflected in indicators related to mental demands: level of attention required, rhythm of work imposed, deadlines to be met, and the monotony of the task (INSHT, 2011, 2014).
The level of overload is important for workers’efficacy
and well-being. For this reason, from different areas of knowledge, researchers have attempted to define con-structs and instruments that allow its adequate
assess-ment. Among them, the Mental Workload is one of the
most widely invoked concepts in ergonomic research and practice (Hancock & Meshkati, 1998; Salvendy, 1997; Wickens, 2008; Young, Brookhuis, Wickens, & Hancock, 2015). Mental workload (MWL) attempts to measure the extent to which occupational activity matches or exceeds
the worker’s resources. In this sense, it has been studied
from two essential perspectives. The first one considers that MWL is a factor that depends exclusively on task de-mands to which the subject adapts. The second one, cur-rently receiving more support, conceptualizes MWL as a consequence of the relation between task demands and
the subject’s skills in terms of a demand/resource balance
* Correspondence:[email protected]
2Facultad de Ciencias Humanas y Sociales, Departamento de Psicología y
Pedagogía, Universidad Pública de Navarra, Campus de Arrosadía s/n. Edificio Magnolios, 31006 Pamplona, Spain
Full list of author information is available at the end of the article
(Díaz, Rubio, Martín, & Luceño, 2010; Ferrer & Dalmau, 2004; Young et al., 2015). The multidimensionality of the concept of MWL and the subjective perception involved implies different fundamental aspects like characteristics of the task, characteristics of the operator, environmental context in which the performance occurs, time pressure, and subjective aspects related to it, such as stress or the perception fatigue (Hart & Staveland, 1988; Eggemeier, 1988; ISO, 2000). In an attempt to bring these dimensions together and provide a global definition of MWL, Young and Stanton (2005) have suggested that MWL reflects the level of attentional resources required to meet both objective and subjective performance criteria, which may be mediated by task demands, external support, and past experience.
The empirical works carried out have evidenced that MWL presents dynamic and complex relationships with
performance, which may also vary according to subjects’
characteristics. In this sense, it has been shown that an increase or decrease of MWL can be compensated to some degree by the investment of additional resources, thus maintaining performance at the cost of individual strain (Hancock & Warm, 2003; Matthews & Davies, 2001). If the intensity and the duration of the effort re-quired to perform the task are balanced, activation will take place in an optimum area, which makes the subject efficient. However, if the effort must be sustained over a prolonged period of time, fatigue appears and the
sub-ject’s functional efficiency is temporary altered (ISO,
1991; Pretorius & Cilliers, 2007; Young et al., 2015). On another hand, too little stimulation can lead to under-load. In this case, as resources are either allocated else-where or otherwise decrease through underuse, the
subject’s performance may also be negatively affected
(Young & Stanton, 2002; Wilson & Rajan, 1995; Young et al., 2015). Considering the former, as Young et al. (2015) state, there is a strong consensus that mental underload can be just as detrimental to performance as mental overload, with both leading to performance deg-radation, attentional lapses, and errors. The relationship between MWL and performance may thus follow a
simi-lar pattern to the classical “inverted U” of
Yerkes-Dodson’s curve (Yerkes & Dodson, 1908), where optimal
performance is located between low and high MWL (Brookhuis & Waard, 2002; Young et al., 2015).
However, MWL literature has mainly been centered on measuring performance by means of operative tasks, like those related to traffic or transport research, real flight, flight simulation, air traffic control, peripheral de-tection, or formal memory/follow-up tasks (see Bowling & Kirkendall, 2012; Brookhuis & Waard, 2002; Hart, 2006; and Young et al., 2015). In this sense, only a few and very recent works have focused on relating MWL and one of the key concepts in skilled work settings:
decision-making (Byrne, 2013; Baethge, Müller, & Rigotti, 2016; Jackson, Kleitman, & Aidman, 2014).
The concept of decision-making (DM) differs in rele-vant characteristics from classical performance indica-tors used in MWL literature. It entails a sequence of actions that allow understanding how subjects face and solve complex problems in professional contexts (Hodgkinson & Starbuck, 2008). Decisions within pro-fessional settings have an interactive social dimension and are based on prior knowledge that, in itself, does not guarantee success when applying the decisions adopted (Argandoña, 2011; Offrage, 2009; Weick & Sutcliffe, 2008). They are, in turn, developed in contexts far from the classical paradigms of rational choice. Thus, decisions are conditioned by elements such as open problems; uncertain and dynamic settings; changing, multiple, and competitive goals; multiple feedbacks; time pressure and contrasts; consequences involving some risk; multiple decision-makers; and external standards (Orasanu & Connolly, 1993; Csaszar & Eggers, 2013). DM has critical effects on professional achievement and acquires special relevance when performance and
actions involve direct consequences on people’s
integ-rity or well-being (Secchi, 2014).
As mentioned, evidence about relationships between MWL and DM is scarce. In relation to clinical
decision-making, Byrne (2013) has suggested—on the basis of the
existing research—that MWL and complexity of the
mention the existing evidence about the relationship between stress and DM in natural settings. In this sense, stress is thought to relate to dysfunctional strat-egy use, altered feedback processing, heightened reward sensitivity, and lowered punishment sensitivity (Starcke & Brand, 2012)
According to the former considerations, our research question refers to the way in which MWL is related to DM in organizational settings. There are several rea-sons that support the relevance of this question, which the present work will address, specifically, the scarcity of works that explore the relation between MWL and DM, the relevance implied in the organizational setting, and the evidence of complex relations between MWL and DM. Our general objective is, therefore, to study in depth the effects of MWL on task performance in the work setting, empirically analyzing the relations be-tween MWL and DM in workers who carry out their activity in real contexts. In this sense, our specific ob-jectives are (1) to analyze the relation between the
worker’s expectation of MWL prior to task
perform-ance (Pre-Task WL) and the quality of DM after task performance; (2) to analyze the relation between per-ceived MWL after the task (Post-Task WL) and the quality of the DM performed after the task; and (3) to analyze the relation of differences between the expected MWL and the MWL perceived after the task (differen-tial mental workload), on the one hand, and the quality of the DM carried out, on the other.
To address the concept of MWL, we have drawn from the conceptualization model of the NASA-Task Load Index (NASA-TLX) (Hart & Staveland, 1988). The suitability of this method has been supported by numerous studies because it provides more accurate results than other techniques, such as the SWAT or the modified Cooper-Harper scale (Hill et al., 1992; Rubio, Diaz, Martin, & Puente, 2004). This evidence, along with the simplicity of its use, makes the NASA-TLX currently the most widely used instrument to as-sess MWL (Noyes & Bruneau, 2007; Rutledge et al., 2009). This method allows rating the task from a multidimensional perspective, so it has been proved useful due to its diagnostic capacity with regard to possible sources of workload (Díaz et al., 2010). Its core strengths include its applicability in a naturalist work setting, as the workers can quickly rate the task carried out both a few moments after its performance and retrospectively (Recarte, Pérez, Conchillo, & Nunes, 2008). In studies carried out on retrospective assessments, high correlations have been found be-tween the data extracted in this way and the immedi-ate scores (Wierwille & Eggemeier, 1993). NASA-TLX measurement procedure is detailed more extensively
in the“Methods”section.
In the case of DM, we used the conceptualization and measurement model elaborated by Soria-Oliver and her team (Sanz de Acedo Lizarraga, Sanz de Acedo Baque-dano, Soria-Oliver, Closas, 2009; Soria-Oliver, 2010). In this model, DM is conceived as a complex sequence of actions that require attending to different parameters con-ditioned by the temporal and organizational needs. They are specified in the following steps: planning the process, defining the goals, generating options, evaluating them, and selecting the best by considering both the influence of personal variables and variables of the setting. According to the guidelines of Byrnes (1998), Cannon-Bowers, Salas, and Pruitt (1996) and Cannon-Bowers and Salas (2002), this model assumes three sources of variables that characterize naturalistic decision-making: task, subject, and context variable. Task variables are associated with the nature of the decision itself, for instance, the uncer-tainty involved in each alternative, pressure of time and available money, quantity and quality of the information, proposed goals, and possible consequences of the deci-sion. Subject or decision-maker characteristics include the
performers’ internal factors: motivation, thorough
self-regulation of the decision stages, crucial information pro-cessing, expertise in a certain domain, and the emotions that almost always accompany a decision. Finally, the en-vironmental characteristics define the context in which the decision takes place, specifically, factors that are not directly a part of the decision task itself: social and work influences and distracting events. This model, in turn, has led to the empirical elaboration of a questionnaire (Deci-sion-Making Questionnaire, DMQ (Soria-Oliver, 2010)) that measures the quality of DM in organizational con-texts, considering the different theoretical dimensions of the model. Detailed characteristics of DMQ are presented
in the“Methods”section.
Our study draws some tentative hypotheses that are conditioned, in any case, by its exploratory and correl-ational nature. Thus, we will explore the degree to which the relationship between DM, on the one hand, and Pre-Task WL and Post-Pre-Task WL, on the other, follow the general pattern that has been evidenced for other per-formance indicators (Brookhuis & Waard, 2002; Wilson & Rajan, 1995; Young & Stanton, 2002; Young et al., 2015). This pattern may be defined as follows: first, by a low expected or real perceived MWL range in which low stimulation may decrease the quality of DM strategies; second, by an optimum performance range of expected or real perceived MWL in which balanced stimulation
adequately fits subjects’ resources and DM quality is
higher; third, a high expected or real MWL range that
overwhelms subjects’resources and may yield worse DM
subjects’expected MWL (Pre-Task WL) is low, real MWL (Post-Task WL) that fits this expectation (Adjusted Differential WL) or remains below it (Low Differential WL) may generate lower DM quality due to absence of stimulation. If subjects with low Pre-Task WL have to cope with higher real MWL than expected (High
Differen-tial WL), DM may be better if subjects’resources are not
overwhelmed. When subjects’ expected MWL (Pre-Task
WL) is high, lower real MWL (Low Differential WL) would lead to worse DM quality due to stimulation decrease. If real MWL fits expected MWL (Adjusted Differential WL), DM quality will be high, as subjects have adequate stimulation. In this case, if real MWL is higher than expected (High Differential WL), DM may be better only if subjects can manage their resources to cope with the requested context demand. However, our empirical design, which measures professional decisions in a real setting without manipulation, does not allow us to predict a priori which expected or real MWL levels may be found and, consequently, whether they would cover all the differ-ent ranges proposed in our hypotheses.
Methods
Design: ex post facto prospective design, with measure-ment of the independent variable (MWL) before and after task performance and measurement of the dependent variable (DM) after task performance.
Sample: a total of 175 participants, representative of the professionals belonging to an institution of online higher education. The sample was stratified proportion-ally to the number of people in the different professional categories in the entire institution (managers, middle managers, professors, and tutors). Participants were se-lected randomly within each stratus. Inclusion criteria were as follows: having joined the institution more than 3 months ago to ensure adequate familiarity with the tasks, and adequate mastery of the Spanish language. The criteria of a 3-month period was established in ac-cordance with prior consultation with the human re-sources department about the estimated time to achieve
workers’ adequate task performance autonomy, as was
also reflected in Work Position Description documents.
The sample had a mean age of 34.5 years (SD = 7.4) and
included 57.8% (n= 100) of women. It included
man-agers (2.3%; n= 4), middle managers (11.6%; n= 20),
professors (39.9%; n= 69), and tutors (46.2%; n= 80).
The minimum sample size required to perform the study was estimated at 105 people. Sample size was calculated assuming a 95% confidence level, 80% power, a standard deviation of 60 in both comparison groups, and 10% of losses, to detect a minimum difference of 35 points in the score of the DMQ between the groups with high and low differential workload (see below for a definition).
Measurements: The following variables were measured: Socio-demographic variables: sex, age, and occupational post within the organization
Decision-making: It was measured by means of the DMQ (Soria-Oliver, 2010). The DMQ has been previ-ously validated in professional settings (Sanz de Acedo Lizarraga et al., 2009). It records the extent to which certain qualified strategies of DM are implemented. Its use yields a global score (DMQ score), scores on 3 scales/ factors (Task scale, Subject scale, and Context scale scores) and scores on 10 subscales/sub-factors linked to each one of the factors: (1) Task factor: Uncertainty, Time/Money Pressure, Information and Goals, and Consequences of Decision subscale scores; (2) Subject fac-tor: Motivation, Self-Regulation, Cognition, and Emotion subscale scores; and (3) Context factor: Social Pressure and Work Pressure subscale scores. This questionnaire has consistent internal validity and, in previous studies, has yielded high rates of reliability in the different scales and subscales. Table 1 presents a summary of the meaning of its scales and subscales (Sanz de Acedo Lizarraga et al., 2009).
Mental workload: It was measured by means of the dimensions considered in the NASA-TLX scale (Hart &
Staveland, 1988), which measures workers’ subjective
experience of the workload. NASA-TLX uses six
di-mensions: (1) Mental demand: how much mental and
perceptual activity was required (e.g., thinking,
decid-ing, calculatdecid-ing, remembering); (2) Physical demand:
how much physical activity was required (e.g., pushing,
pulling, turning, controlling); (3) Temporal demand:
how much time pressure workers felt was due to the rate or pace at which the task or task elements
oc-curred; (4)Performance: how successful was the worker
in accomplishing the goals of the tasks; (5)Effort: how
hard did the worker feel she/he had to work (mentally and physically) to accomplish the level of performance; (6) Frustration: how insecure, discouraged, irritated, stressed, and annoyed did the worker feel during the task. Twenty-step bipolar scales are used to obtain ratings for these dimensions. In the classical procedure, a previous weighting phase is performed. This weighting phase re-quires a paired-comparison task to be performed prior to the workload assessments to combine the six individual scale ratings into a global score. However, recent research has shown the scarce utility of the weighting phase (López, Rubio, & Luceño, 2010). Therefore, we decided to
use the subjects’ rating directly on the six dimensions
of subtracting the Pre-Task WL score from the Post-Task WL score. In this indicator, negative values imply that the task was less burdensome than expected. Positive values, in contrast, reflect that the subject faced a greater burden than expected. Values approaching zero reflect a match between the expected MWL and the real MWL encountered.
Procedure: Our research team presented the objective and procedure of the study to the Rectorate of the aca-demic organization in which the field work would take place. The Rectorate decided that the proposed research was potentially useful for the organization and also that study procedures followed ethical criteria. Consequently,
the workers’ institutional e-mail was provided by the
organization. The survey was thus disseminated by means of a link to which access was gained by an e-mail invitation. In the e-mail, we mentioned the nature of the
research, the subjects’ voluntary participation, and we
guaranteed anonymity of the responses. As an e-mail at-tachment, subjects received the NASA-TLX questionnaire,
which had to be printed to become adequately familiar with the instrument. The way in which participation was designed required the subjects to firstly fill in the adapted paper-and-pencil version of the NASA-TLX questionnaire before beginning a typical task of their job and to complete it again after completing the task. After completing both questionnaires, by means of the web link, access was gained to the pre-task and post-task NASA-TLX questionnaire to enter the data col-lected on paper. The DMQ was also accessed to allow completing it online directly on screen. A reminder was sent 2 weeks after the original invitation in order to promote participation. Out of a total 250 applications, we obtained 175 completed questionnaires (response rate of 70%).
Analysis: We conducted descriptive and initial explora-tory analyses, and we examined the reliability of the scales and subscales. Subsequently, we performed multivariate analysis of variance (MANOVA) test and linear regression to explore the relation between decision-making and the different indicators of mental workload. We used the statistical package IBM® SPSS® Statistics V. 22.0.
Results
Psychometric properties and initial exploratory analysis
Table 2 presents, firstly, the descriptive statistics and psy-chometric results of the different scales and subscales, showing indices of central tendency (means), deviation
(standard deviation), and the Cronbach’s alpha index for
each scale or subscale. Reliability indicators of the mea-sures of MWL are not included because they represent a cumulative measure of different dimensions that cannot be conceptualized from the approach of a psychological construct measured through indicators. Pearson correl-ation indices between the different measures of MWL and the different scales and subscales of DM are included.
Regarding the psychometric properties of scales and subscales, we note the excellent properties of the DMQ as a whole and of the Task and Subject scales, with the Context scale providing a more modest indicator. The different subscales yielded disparate results, as some did
not reach the level of .6 in the Cronbach’s alpha index;
therefore, following the current recommendations (Hogan, 2013), we will not use them separately for the exploratory analysis.
We note, firstly, the existence a high correlation between Pre-Task WL and Post-Task WL. Secondly, we highlight the existence of positive, albeit moderate, correlations between various DMQ scales and subscales and Pre-Task WL, especially in the DMQ dimensions referring to Subject. Also notable, but in the opposite direction, are the absence of linear correlations between Differential WL and the different indicators of DMQ and the low correlations between DMQ and Post-Task
Table 1DMQ (Decision-Making Questionnaire) scales and subscales
Task factor/scale:
Tendency to assess all the aspects related to the scope of the decision task, mainly levels of certainty, information, goals, and consequences of the decision.
•Uncertainty subscale: measures the degree to which individuals
consider their concerns about doubt, risk, and the changes caused by the decision
•Time/Money Pressure subscale: determines how individuals organize
their activities and their predisposition to compare the results of the decision with the time and money spent
•Information and Goals subscale: shows the degree to which
individuals attach importance to having adequate data available and defining specific goals to appraise task difficulty
•Consequences of Decision subscale: assesses the degree to which
subjects assign personal responsibility for the effects of the decision Subject factor/scale:
Tendency to engage in the process of decision in a motivated, thoughtful, and sincere way, self-regulating the process.
•Motivation subscale: measures the degree to which individuals
launch the decision-making process and maintain interest during the development of its successive phases
•Self-Regulation subscale: shows the degree to which subjects tend
to plan, monitor, and evaluate results
•Cognition subscale: measures the degree to which individuals tend
to process information, reason about the steps to be taken, and resolve the difficulties that may emerge during the decision-making process.
•Emotion subscale: shows the degree to which individuals create an
appropriate mood in order to make the decision Context factor/scale:
Tendency to discover the influence of the social, community, and occupational environment in the decision process.
•Social Pressure subscale: shows consideration of the impact on the
environment or on other persons when making a decision
•Work Pressure subscale: measures the degree to which an individual
WL. We shall now present in detail the results of each one of our analysis objectives.
Relation between Pre-Task WL and decision-making
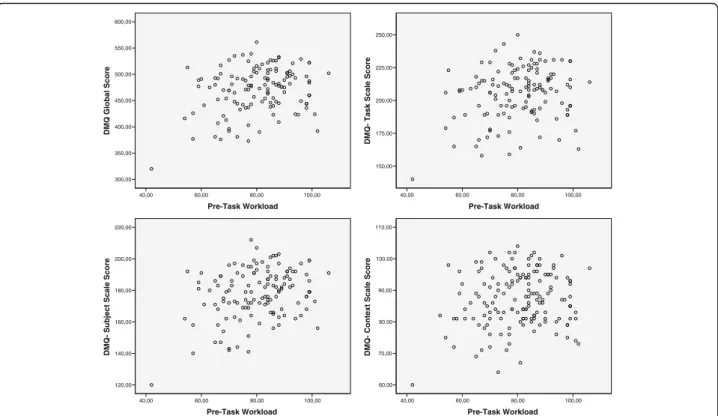
As seen in Table 2, our data show evidence of a positive and moderate linear-relation-expected mental workload (Pre-Task WL) and the different scales and subscales of the DMQ. However, as the existing research shows poten-tially nonlinear relationships between MWL measures and performance, we explored the general pattern of relation-ships between the DMQ measures and Pre-Task WL scores by means of scatter plots. The examination of these plots, which are presented in Fig. 1, revealed that medium values of Pre-Task WL are potentially associated with higher DMQ scores when compared with high and low Pre-Task WL values.
In order to tentatively explore this pattern, we divided Pre-Task WL scores into three groups, taking as criteria
the values of the mean (M= 80.3) and standard deviation
(SD = 12.3). Consequently, three groups were defined: (1)
group with Low Pre-Task WL (lowest value to M−SD);
(2) group with Medium Pre-Task WL (Mean−SD to
Mean + SD); (3) group with High Pre-Task WL (Mean + SD to highest value). We used MANOVA to contrast the differences in the quality of decision-making among the three groups. DMQ-Total, DMQ-Task, DMQ-Subject, and DMQ-Context scores were included as dependent
variables and Grouped Pre-Task WL was included as factor.
When testing the parametric assumptions, it was ob-served that the variables referring to decision-making did not follow a normal distribution. The four chosen indicators (DMQ-Total, DMQ-Task, DMQ-Subject, and DMQ-Context) obtained values in the Kolmogorov-Smirnov test that lead to rejecting the null hypothesis of adaptation to the normal distribution. However, we con-sidered the application of MANOVA to be adequate, given its robustness versus the deviations from normality in symmetrical distributions (Kariya & Sinha, 2014), as is the case of our study. On another hand, the contrast in-dicators of variance equality of the error term between the groups are satisfactory for all variables. Fit tests were also satisfactory in all cases.
Multivariate tests, which contrast the null hypothesis of the global relation between the different dependent vari-ables and the term of the model, revealed the existence of verifiable relations between the series of the indicators of
the DMQ and Pre-Task WL (Wilks’ lambda .853; F=
3.382; df 6.246; p= .003). Table 3 presents a summary of
the inter-subject tests, showing the different indicators that contrast the null hypothesis of a relation between Pre-Task WL and the different indicators of DM.
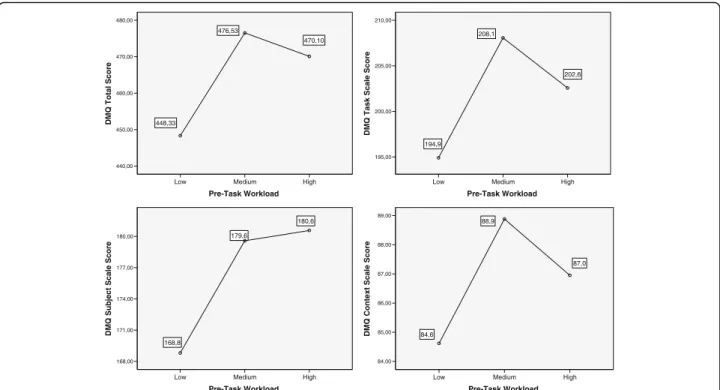
Relationships are also summarized in Fig. 2, in which estimated means of DM indicators are represented for Low, Medium, and High Pre-Task WL groups. The results
Table 2Descriptive statistics, reliability, and linear correlation indexes between the variables of the study and the indicators of MWL
Mean Standard
deviation
Reliability (Cronbach’sα)
Pearson correlations
Pre-Task Workload Post-Task Workload Differential Workload
(post-pre)
Pre-Task Workload 80.3 12.3 – 1
Post-Task Workload 80.8 15.1 – .63** 1
Differential Workload 0.17 11.9 – −.19* .64** 1
DMQ-Total score 470.9 42.9 .94 .26** .14 −.01
DMQ-Task 205.3 19.9 .87 .21* .12 .01
DMQ-Uncertainty 45.8 4.7 .63 .16 .18* .13
DMQ-Time/Money Pressure 61.9 5.8 .71 .14 .10 .05
DMQ-Information and Goals 56.5 7.5 .73 .14 .08 −.01
DMQ-Consequences 41.3 6.5 .60 .13 .03 −.06
DMQ-Subject 177.9 15.8 .83 .31** .16 −.04
DMQ-Motivation 36.9 3.7 .39 .13 .06 .02
DMQ-Self-Regulation 56.7 6.3 .48 .35** .18*
−.10
DMQ-Cognition 45.2 5.1 .66 .26** .14 −.01
DMQ-Emotion 37.9 3.9 .45 .20* .15 .03
DMQ-Context 87.1 8.6 .73 .15 .10 .04
DMQ-Social Pressure 52.0 5.4 .60 .13 .18* .15
DMQ-Work Pressure 35.0 4.4 .57 .16* .03 −.09
revealed the existence of specific and verifiable relations between Pre-Task WL and the Total, DMQ-Subject, and DMQ-Task scales. The DMQ-Context scales did not achieve the required significance level. DMQ-Total and DMQ-Task relations with Pre-Task WL showed a similar pattern, in which DM quality seems to be better in the Medium Pre-Task group, slightly lower in the High Pre-Task WL group, and lower in the Low Pre-Task WL group. Scheffé post hoc
contrasts (p< .05) only yielded significant differences
between subjects with Low Pre-Task WL, on the one hand, and Medium and High Pre-Task WL, on the other, for Total and Task scores. DMQ-Subject, however, showed a different pattern in which subjects included in High Pre-Task WL obtained the
highest scores. However, post hoc contrast (p< .05) also
yielded relevant differences only between Low Pre-Task
WL, on the one hand, and Medium and High Pre-Task WL, on the other.
Relation between Post-Task WL and decision-making
Examination of the correlation matrix reveals low linear correlations between Post-Task WL and the different in-dicators of decision-making, which only reach signifi-cance in a few scales (Uncertainty and DMQ-Social Pressure of those scales with adequate reliability). These indicators offer little basis for the exploration of conjoint linear relations. As done for Pre-Task WL, in order to explore potential nonlinear relationships, scatter plots were generated between DMQ indicators and Post-Task WL. However, none of these plots revealed relevant relationship patterns. Thus, low correlations are not jus-tified by the existence of nonlinear relationships, which may concentrate higher values of DMQ scores around medium values of Post-Task WL. On the contrary, they seem to be a consequence of a wide dispersion of DMQ scores over the different values of Post-Task WL.
In order to explore whether the relationships between Post-Task WL and DMQ scores could be concealed by the influence of Pre-Task WL levels, we explored the potential moderation effect of Pre-Task WL in the rela-tionship between Post-Task WL and DMQ. We followed
Baron and Kenny’s (1986) indications and performed
separate linear regression analysis for Low, Medium, and High Pre-Task WL groups (as defined in the previous
Table 3MANOVA including DMQ-Total, DMQ-Subject, DMQ-Task, DMQ-Context, and Pre-Task Workload. Inter-subject tests
Dependent variable F η2 Degrees of freedom Significance
DMQ-Global scale 3.80 .057 2 .025
DMQ-Task subscale 4.07 .061 2 .019
DMQ-Subject subscale 4.44 .066 2 .014
DMQ-Context subscale 2.02 .031 2 .137
DMQDecision-Making Questionnaire
Pre-Task Workload
100,00 80,00
60,00 40,00
DMQ Global Score
600,00
550,00
500,00
450,00
400,00
350,00
300,00
Pre-Task Workload
100,00 80,00
60,00 40,00
DMQ- Task Scale Score
250,00
225,00
200,00
175,00
150,00
Pre-Task Workload
100,00 80,00
60,00 40,00
DMQ- Subject Scale Score
220,00
200,00
180,00
160,00
140,00
120,00
Pre-Task Workload
100,00 80,00
60,00 40,00
DMQ- Context Scale Score
110,00
100,00
90,00
80,00
70,00
60,00
section), including Total DMQ scales, Task, DMQ-Subject, and DMQ-Context in each case as dependent variables and Post-Task WL as the independent variable. None of the obtained unstandardized regression coeffi-cients was significant. Thus, the moderation effect of Pre-Task WL does not reveal any relevant relation between Post-Task WL and DM.
Relation between Differential WL and decision-making
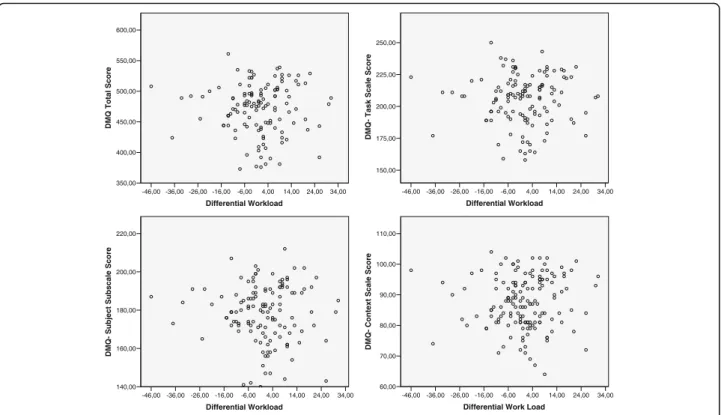
Table 2 shows the practical absence of linear relation between Differential WL and the DMQ, with linear cor-relation indices very close to zero in all cases. However, as previously mentioned, we decided to explore poten-tial nonlinear relationships between the two variables. Figure 3 presents scatter plots referring to the Total DMQ scale and the DMQ-Task, DMQ-Subject, and DMQ-Context scales. The scatter plots are compatible with a nonlinear pattern of relation: the levels of Differen-tial WL located around the value zero seem to be clearly associated with lower values on the different indicators of DM. This pattern, which is revealed empirically, has po-tential theoretical significance because the value zero in Differential WL reflects situations in which there are no differences between expectations of MWL and real MWL, which represents a qualitatively different situation from other situations, from a conceptual viewpoint. To test the consistency of this pattern of relations, we decided to carry out a grouping process of the variable Differential
WL, differentiating the group of subjects situated around value zero from subjects with higher and lower values than zero. Among the possible criteria, we decided to de-limit the value of percentile 33.33 of the distribution of
Differential WL—which was the value−3—and use it as a
cutting interval to distinguish three groups: (1) group with
Low Differential WL (<−3), (2) group with Adjusted
Differential WL (−3 to +3), and (3) group with High
Differential WL (>3).
We used MANOVA to contrast the differences in the quality of decision-making among the three groups. On the one hand, we included as dependent variables both the global DMQ score and the score of the DMQ-Task, DMQ-Subject, and DMQ-Context scales. At the same time, given the relations found between Pre-Task WL and decision-making, we decided to include as factors both the grouped Differential WL and Pre-Task WL in order to determine whether the relations between Differ-ential WL and DM may be moderated by the levels of expected mental workload before the task. As the cut point criterion of the two groups of Pre-Task WL, we used the value of the mean (80.26), creating two groups:
Low Pre-Task WL (≤80.26) and High Pre-Task (>80.26).
As it was mentioned previously, variables referring to decision-making did not follow a normal distribution, but we considered the application of MANOVA to be adequate, given its robustness versus the deviations from normality in symmetrical distributions, as is the case of
Pre-Task Workload High Medium
Low
DMQ Total Score
480,00
470,00
460,00
450,00
440,00
470,10 476,53
448,33
Pre-Task Workload High Medium
Low
DMQ Task Scale Score
210,00
205,00
200,00
195,00
202,6 208,1
194,9
Pre-Task Workload High Medium
Low
DMQ Subject Scale Score
180,00
177,00
174,00
171,00
168,00
180,6
179,6
168,8
Pre-Task Workload High Medium
Low
DMQ Context Scale Score
89,00
88,00
87,00
86,00
85,00
84,00
87,0 88,9
84,6
Fig. 2Estimated marginal means. DMQ-Global scale, DMQ-Task subscale, DMQ-Subject subscale, and DMQ-Context subscale vs. Pre-Task Workload.
our study. On another hand, the contrast indicators of variance equality of the error term between the groups are satisfactory, except for the variable of the DMQ-Subject scale, which presents a Levene test with a
signifi-cance of p< .05. Therefore, the results referring to this
variable must be interpreted with caution. Fit tests were, however, satisfactory in all cases.
In Table 4, we show a summary of the main results of the multivariate tests, which contrast the null hypothesis of the global relation between the different dependent variables and the different terms of the model. The results reveal the existence of verifiable relations between the series of the indicators of the DMQ and both Differential WL and Pre-Task WL. However, there is no evidence of a global interaction between the two factors.
Table 5 presents a summary of the inter-subject tests, showing the different indicators that contrast the null hy-pothesis of a relation between the different factors of the model (Differential WL, Pre-Task WL, and their Inter-action) and the different indicators of DM. The results re-veal the existence of global relations between the three terms of the model (Differential WL, Pre-Task WL, and their interaction) and all the selected indicators of decision-making, except for DMQ-Context. This global relation is revealed in specific and verifiable relations be-tween Differential WL and the Total, DMQ-Subject, and DMQ-Task scales. This relation between the Pre-Task WL and these scales is also verifiable. However,
when configuring their relation with the indicators of the DMQ, the two factors did not interact with each other.
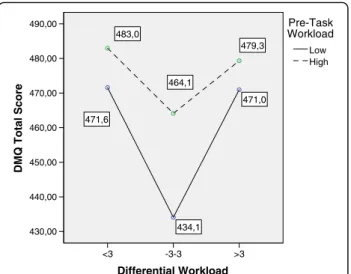
The following graphics, shown in Figs. 4, 5, 6, and 7, specifically summarize the way in which these relations are manifested. The mean values of the different scales of DM are shown as a function of the Differential WL and Pre-Task WL factors. The graphics show that the group with high Pre-Task WL had a greater quality of decision-making (higher scores) in all the indicators than the group with low Pre-Task WL. Only in the case of the DMQ-Context scale did this pattern not reach signifi-cance. However, the pattern was substantially different in the case of Differential WL. As shown in the different graphics in a highly consistent way, subjects with ad-justed Differential WL showed poorer quality levels of decision-making than subjects with low and high Differ-ential WL. The pairwise post hoc comparisons (adjusted Differential WL, on the one hand, and low and high Dif-ferential WL, on the other) showed that subjects with adjusted Differential WL maintained significantly lower
scores (p< .05) of Total DMQ, Task, and
DMQ-Subject. The pairwise comparisons also revealed that these subjects obtained lower scores in DMQ-Context than subjects with high Differential WL, although there was no global significance between the two variables. Lastly, there were no testable differences in the indica-tors of decision-making between subjects with high and low Differential WL in the post hoc tests.
Differential Workload
34,00 24,00 14,00 4,00 -6,00 -16,00 -26,00 -36,00 -46,00
DMQ Total Score
600,00
550,00
500,00
450,00
400,00
350,00
Differential Work Load
34,00 24,00 14,00 4,00 -6,00 -16,00 -26,00 -36,00 -46,00
DMQ- Context Scale Score
110,00
100,00
90,00
80,00
70,00
60,00
Differential Workload
34,00 24,00 14,00 4,00 -6,00 -16,00 -26,00 -36,00 -46,00
DMQ- Task Scale Score
250,00
225,00
200,00
175,00
150,00
Differential Workload
34,00 24,00 14,00 4,00 -6,00 -16,00 -26,00 -36,00 -46,00
DMQ- Subject Subscale Score
220,00
200,00
180,00
160,00
140,00
Discussion
In the present work, we have attempted to deepen our knowledge of the relations between a process of great rele-vance in complex organizational settings, decision-making (DM), and an indicator of occupational quality with a long trajectory, mental workload (MWL). For this purpose, we used theoretical models and instruments that have been contrasted in prior literature. We analyzed real tasks at the workplace in subjects who carry out their activity in an organization, and we focused on DM from a model that takes into account the particularities of professional settings. The results obtained reveal some consistent and expected evidence, but they also present innovative rela-tions that are necessary to interpret.
The initial analyses of our study reveal the psycho-metric robustness of the DMQ when used as a global score. It also shows good psychometric indicators for the DMQ-Task and DMQ-Subject subscales and some-what worse indicators for the DMQ-Context subscale. Different subscales also show adequate reliability indi-cators (Uncertainty, Time/Money Pressure, Information and Goals, Consequences of Decision, Cognition, and Social Pressure), although there are others, especially
those referring to Motivation and Self-Regulation, which show significantly lower psychometric indicators than those obtained in the initial studies that led to the construction of this instrument (Soria-Oliver, 2010). These results reinforce the suitability of the instrument as a whole and also its main dimensions. On another hand, the results point to the need to continue contrasting the appli-cation of the subscales and to determine the extent to
which—and with different populations—the separate use
of the subscales can be maintained.
From the viewpoint of the descriptive statistics, some reflections are warranted. A notable aspect of our study is the obtention of indicators in a profes-sional sample that, in turn, is representative of a spe-cific organization. This type of samples is scarce in the literature (Díaz et al., 2010), which has preferentially focused on laboratory tasks and student samples. On another hand, there are few studies that report data from the chosen approach, which suppresses the weighting phase of the NASA-TLX scale. From this perspective, it is not possible to establish comparisons with the absolute score when assessing the significance of the scores of our sample. Nevertheless, if we take into account that the
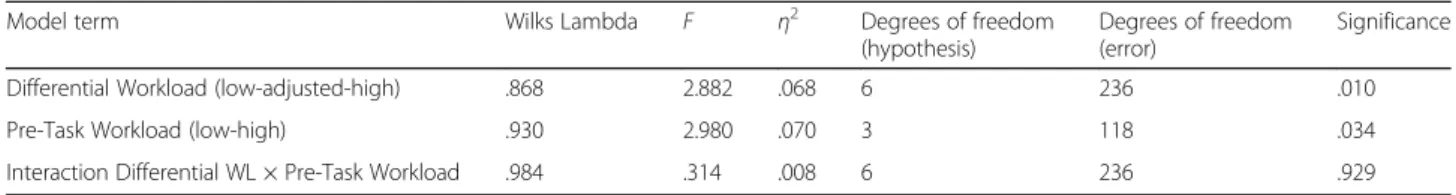
Table 4MANOVA including DMQ scores, Differential Workload and Pre-Task Workload. Multivariate tests
Model term Wilks Lambda F η2 Degrees of freedom
(hypothesis)
Degrees of freedom (error)
Significance
Differential Workload (low-adjusted-high) .868 2.882 .068 6 236 .010
Pre-Task Workload (low-high) .930 2.980 .070 3 118 .034
Interaction Differential WL × Pre-Task Workload .984 .314 .008 6 236 .929
Table 5MANOVA including DMQ scores, Differential Workload (Grouped), and Pre-Task Workload (Grouped). Inter-subject tests
Origin Dependent variable Degrees of freedom F η2 Significance
Corrected global model (Differential WL. Pre-Task WL. Interaction Differential WL × Pre-Task WL)
DMQ-Total score 5 2.567 .097 .030
DMQ-Task 5 2.355 .089 .045
DMQ-Subject 5 3.300 .121 .008
DMQ-Context 5 1.186 .047 .320
Differential WL (low-adjusted-high) DMQ-Total score 2 4.515 .07 .013
DMQ-Task 2 4.424 .069 .014
DMQ-Subject 2 5.238 .08 .007
DMQ-Context 2 2.202 .035 .115
Pre-Task WL (low-high) DMQ-Total score 1 4.743 .038 .031
DMQ-Task 1 3.568 .029 .061
DMQ-Subject 1 7.002 .055 .009
DMQ-Context 1 2.237 .018 .137
Differential WL × Pre-Task WL DMQ-Total score 2 .641 .011 .529
DMQ-Task 2 .678 .011 .510
DMQ-Subject 2 .587 .010 .557
DMQ-Context 2 .414 .007 .662
mean levels of the measurement scale as a whole reach 60 points and that the maximum is 120 points, our sample is located around the medium-high level in absolute terms. Regarding decision-making, we can use previous works carried out with different professional groups as a refer-ence (Sanz de Acedo Lizarraga et al., 2009). Based on them, it should be noted that our sample presents higher values of quality of DM than the samples used in the same geographic context.
From the viewpoint of exploring the relations among the different variables, we found different patterns as a function of the moment and the way of implementing the MWL measure.
In this sense, with regard to the first goal of this study, which was to explore the relation between the expected MWL, which we have called Pre-Task WL, and the quality of DM, results provide support for our hypothesis. Thus, from a global point of view, the rela-tionship between Pre-Task WL and DM is compatible with the expected pattern proposed on the basis of the existing literature (Brookhuis & Waard, 2002; Wilson & Rajan, 1995; Young & Stanton, 2002; Young et al., 2015). Specifically, global DM as measured by the Total DMQ score and DM aspects related to the way in which the task is handled yielded better quality when intermediate levels of MWL were anticipated. Our results
Differential Workload >3 -3-3
<3
DMQ Total Score
490,00
480,00
470,00
460,00
450,00
440,00
430,00
479,3
464,1 483,0
471,6
471,0
434,1
High Low Pre-Task Workload
Fig. 4MANOVA. Estimated marginal means. Differential Workload vs. Decision-Making Questionnaire Global score.DMQDecision-Making Questionnaire
Differential Workload >3 -3-3
<3
Task Scale Score
215,00
210,00
205,00
200,00
195,00
190,00
185,00
207,9
201,7 210,5
205,0
188,4 206,4
High Low Pre-Task Workload
Fig. 5MANOVA. Estimated marginal means. Differential Workload vs. Decision-Making Questionnaire Task scale.DMQDecision-Making Questionnaire
Differential Workload >3 -3-3
<3
DMQ Subject Scale Score
185,00
180,00
175,00
170,00
165,00
160,00
183,5
177,5
181,6
175,3
177,5
163,5
High Low Pre-Task Workload
Fig. 6MANOVA. Estimated marginal means. Differential Workload vs. Decision-Making Questionnaire Subjects scale.DMQDecision-Making Questionnaire
Differential Workload >3 -3-3
<3
DMQ Context Scale Score
90,00
88,00
86,00
84,00
82,00
88,9
87,7
89,9
87,1
88,5
82,2
High Low Pre-Task Workload
are concordant with those presented by Wilson and Rajan (1995) and Young and Stanton (2002) in the case of operative tasks and by Jackson et al. (2014) specific-ally for DM, pointing out that both under- and overload could lead to poorer performance. In this sense, on the one hand, underload may lead to inadequate activation
and scarce use of workers’available resources. Our
re-sults are also perfectly compatible with evidence indi-cating that an adequate process of activation is useful for better performance in cognitive tasks both in aca-demic contexts (Pekrun, Goetz, Daniels, Stupnisky, & Perry, 2010) and organizational settings (Fisher, 1993; Loukidou, Loan-Clarke, & Daniels, 2009). However, a slightly different pattern was found for the relationship between expected MWL and the performance of DM strategies related to the subject dimension. In this sense, although DM performance referring to the sub-ject dimension increases when expected MWL remains at a medium level, the quality of these strategies de-creases when expected MWL is higher. This fact, taken
with caution, indicates that subjects’ability to engage in
the decision process in a motivated, thoughtful way and by self-regulating the process may not be affected, but maintained or improved when higher MWL is ex-pected. This result may be explained by the fact that DM strategies referred to the subject dimension are more accessible to self-regulation than DM strategies that affect task or environment handling (Cannon-Bowers & Salas, 2002).
Taking into account the above and, in any case,
consid-ering the study’s limitations, our study provides evidence
for the application of results to DM in organizational con-texts. In this sense, our results indicate that anticipating
levels of MWL that guarantee workers’ adequate
activa-tion may yield better results in DM performance. The
ex-pectation of low task requirements may lead to workers’
poorer quality of decisions. High levels of expected MWL could lead to a decrease in DM performance, but this de-crease seems to be moderated by the kind of task that has been explored, related mainly to intellectual work, and
there is no evidence for the dimensions related to subjects’
motivation and self-regulation.
With regard to the second goal: to explore the relation between Post-Task WL and DM, the results do not yield evidence of a relation between the two constructs. Differ-ent kinds of potDiffer-ential relationships were explored (linear and nonlinear), as was the potential moderation effect of Pre-Task WL, but none of our analyses showed relevant patterns. This indicates that, from our data, we cannot make direct inferences about the quality of DM that the worker performs as a function of the MWL experienced. This finding is not consistent with our hypothesis, which
assumed that an“inverted U”pattern would be found
be-tween DM and real experienced MWL. Our hypothesis, as
previously mentioned, was based on the existing know-ledge about the general relation between performance and MWL (Brookhuis & Waard, 2002; Wilson & Rajan, 1995; Young & Stanton, 2002; Young et al., 2015) and some specific results referring to relationships between MWL and DM (Jackson et al., 2014). Some possible mechanisms could explain this lack of relation: (1) Our results could be conditioned by the levels of MWL present in the studied sample, which may not reflect the values of low or high MWL achieved by experimen-tal manipulation in common simulation studies (Young et al., 2015). Thus, our results could be revealing a comfort zone, in which the variations in MWL scores do not reflect an important change in conditions affect-ing DM performance. However, this condition may not operate in the same way for expected MWL. In this
sense, as shown previously, expected MWL—although
yielding a similar distribution—showed relevant effects
on DM. (2) Combined with this, experienced MWL in real organizational settings may be handled dynamically (Weick & Sutcliffe, 2008) by means of different strat-egies (e.g., rebalancing demands and capabilities) that may reduce activation level and, consequently, MWL impact on DM. In this sense, DM in natural settings may offer subjects more flexibility to buffer the effect of MWL than do closed experimental or operative tasks. (3)
Additional variables, like subjects’ expertise or stress
reaction and appraisal, could be operating as mediators between MWL and DM (Weick & Sutcliffe, 2008; Starcke & Brand, 2012).
Jackson et al., 2014). The higher quality in DM in the group with more MWL than expected is also concord-ant with our hypothesis and may be revealing a higher cognitive demand that places subjects on a better per-formance range and, on another hand, does not exceed the limits to generate a deficient performance. This pat-tern has been previously shown in MWL for general performance (Young & Stanton, 2002; Young et al., 2015) and DM (Jackson et al., 2014). The presence of higher levels of DM quality in the group with lower MWL than expected is more difficult to explain be-cause it is not consistent with the existing evidence from other studies (Jackson et al., 2014; Loukidou et al., 2009). This could be revealing the possibility of devel-oping more qualified DM in the absence of task de-mands, but we have no basis to contrast this hypothesis with our data. In any event, it seems to reveal the need to consider dynamic and more complex processes, such as the reciprocal influence between the two constructs. The exploration and determination of these patterns of relation would be of great interest to adequately de-sign the levels of MWL that allow more qualified organizational decisions.
One strength of our study is that we measured MWL before and after the task, as well as the fact that it was carried out in a real professional setting. However, it has the limitation of not ensuring more extreme values of MWL, which would allow a better contrast of their ef-fect on DM. Such values could be obtained by including some quasi-experimental manipulation or by accessing settings regularly submitted to higher mental loads. This would allow comparing the extent to which the patterns found are repeated, especially for the complex relations found between DM and differential WL. It may also be of interest to complement the quantitative indicators with a qualitative follow-up of the process undergone by the subjects, in order to further our understanding of the unexpected results we found. Our study design may also be improved if potential moderators of the relation-ship between MWL and DM are considered. In this
sense, subjects’ expertise could be one of the most
rele-vant factors to be included in further studies.
Conclusions
Our work reveals the existence of complex relations be-tween the MWL experienced by workers in a setting with intellectual tasks and the quality of the DM they develop in their work. Quality of DM appears to be better when medium levels of WL are expected. Underload or overload may affect general quality of DM and, specifically, the strategies related to task management. However, decision
strategies related to the subject’s own motivation and
self-regulation appear to be less affected by overload. This relationship pattern shows the potential positive effects of
adequate activation prior to the task on DM performance. However, this effect does not seem to be linked to the real MWL experienced because we found no consistent pat-tern of relation between the quality of DM and the MWL experienced after having carried out the task. The relation between the differential WL, on the one hand, and the quality of DM, on the other, showed also a nonlinear pat-tern. Thus, the workers whose expected MWL matches the one they must face have a worse quality of DM than those who have a mismatch between the two, either in a positive or negative sense. This finding makes us consider a more elaborate pattern of relations, in which the possi-bility of the existence of a reciprocal dynamic influence between the two constructs should be contemplated. Our results lead to various questions, which can be taken up by future research to better understand the influence of the levels of overload in complex tasks that are dealt with in current organizational settings.
Abbreviations
DM:Decision-making; DMQ: Decision-Making Questionnaire; MWL: Mental Workload; NASA-TLX: National Aeronautics and Space Administration-Task Load Index; WL: Workload
Authors’contributions
MSO was in charge of the study’s theoretical background and study design. JSL was in charge of data analysis and interpretation. FT was responsible for fieldwork implementation and supervision. All authors contributed jointly to elaborate the discussion and conclusions. All authors read and approved the final manuscript.
Competing interests
The authors declare that they have no competing interests.
Ethics approval and consent to participate
The study procedures obtained ethics approval by the Committee of the involved academic institution. Subjects gave explicit consent to participate.
Publisher’s Note
Springer Nature remains neutral with regard to jurisdictional claims in published maps and institutional affiliations.
Author details
1Facultad de Ciencias Jurídicas, Sociales y Humanidades, UNIR-Universidad
Internacional de la Rioja, Av. de la Paz, 137, 26006 Logroño, La Rioja, Spain.
2Facultad de Ciencias Humanas y Sociales, Departamento de Psicología y
Pedagogía, Universidad Pública de Navarra, Campus de Arrosadía s/n. Edificio Magnolios, 31006 Pamplona, Spain.
Received: 2 December 2016 Accepted: 14 March 2017
References
Argandoña, A. (2011). La ética y la toma de decisiones en la empresa [Ethic and decisión making in business].Universia Business Review, 2011(30), 22–30. Baethge, A, Müller, A, & Rigotti, T. (2016). Nursing performance under high
workload: A diary study on the moderating role of selection, optimization and compensation strategies.Journal of Advanced Nursing, 72(3), 545–557. Baron, R. M., & Kenny, D. A. (1986). The moderator-mediator variable distinction in
social psychological research: Conceptual, strategic, and statistical considerations. Journal of Personality and Social Psychology, 51(6), 1173–1182.
Bowling, NA, & Kirkendall, C. (2012). Workload: A review of causes, consequences, and potential interventions. In J Houdmont, S Leka, & RR Sinclair (Eds.),
and Practice, Volume 2(pp. 221–238). Chichester, UK: Wiley. doi:10.1002/ 9781119942849.ch13.
Brookhuis, KA, & Waard, DD. (2002). On the assessment of (mental) workload and other subjective qualifications.Ergonomics, 45(14), 1026–1030.
Byrne, A. (2013). Mental workload as a key factor in clinical decision making.
Advances in Health Sciences Education, 18(3), 537–545. doi:10.1007/s10459-012-9360-5.
Byrnes, JP. (1998).The nature and development of decision making. Mahwah, NJ: Erlbaum.
Cannon-Bowers, JA, & Salas, E. (2002). Individual and team decision making under stress: Theoretical underpinnings. In JA Cannon-Bowers & E Salas (Eds.),
Making Decisions Under Stress(pp. 17–38). Washington, DC: American Psychological Association.
Cannon-Bowers, JA, Salas, E, & Pruitt, JS. (1996). Establishing the boundaries of a paradigm for decision-making research.Human Factors, 38(2), 193–205. Csaszar, F, & Eggers, J. (2013). Organizational decision making: An information
aggregation view.Management Science, 59(10), 2257–2277. doi:10.1287/mnsc. 1120.1698.
Díaz, E, Rubio, S, Martín, J, & Luceño, L. (2010). Estudio Psicométrico del Índice de Carga Mental NASA-TLX con una Muestra de Trabajadores Españoles [Psychometric study of NASA-TLX Workload Index in a sample of Spanish workers].
Revista de Psicología del Trabajo y de las Organizaciones, 2010, 26(3), 191–199. Dickerson, SS, & Kemeny, ME. (2004). Acute stressors and cortisol responses: A theoretical integration and synthesis of laboratory research.Psychological Bulletin, 130(3), 355–391.
Eggemeier, FT. (1988). Properties of workload assessment techniques.Advances in Psychology, 52(C), 41–62. doi:10.1016/S0166-4115(08)62382-1.
Ferrer, R, & Dalmau, I. (2004). Revisión del concepto de carga mental: Evaluación, consecuencias y proceso de normalización [Review of the concept of mental workload: Assessment, consequences and standarization].Anuario De Psicologia, 35(4), 521–545.
Fisher, CD. (1993). Boredom at work: A neglected concept.Human Relations, 46(3), 395–417.
Hancok, PA, & Meshkati, N. (1998).Human mental workload. Oxford: North Holland. Hancock, PA, & Warm, JS. (2003). A dynamic model of stress and sustained
attention.Journal of Human Performance in Extreme Environments, 7(1), 4. Hart, S.G. (2006). NASA-Task Load Index (NASA-TLX); 20 years later.Proceedings of
the Human Factors and Ergonomics Society annual meeting, 50(9), 904–908. Hart, SG, & Staveland, LE. (1988). Development of NASA-TLX (Task Load Index): Results of empirical and theoretical research. In PA Hancock & N Meshkati (Eds.),Human Mental Workload(pp. 139–183). Amsterdam: North-Holland. Hill, SG, Iavecchia, HP, Byers, JC, Bittner, AC, Zaklad, AL, & Christ, RE. (1992). Comparison
of four subjective workload rating scales.Human Factors, 34, 429–439. Hodgkinson, G. P., & Starbuck, W. H. (2008). Organizational decision making:
Mapping terrains on different planets. In G.P. Hodgkinson & W.H. Starbuck,
The Oxford Handbook of Organizational Decision Making(pp 1–29). New York: Oxford University Press. doi:10.1093/oxfordhb/9780199290468.003.0001. Hogan, TP. (2013).Psychological testing: A practical introduction. New York: Wiley
Global Education.
INSHT (Instituto Nacional de Seguridad e Higiene). (2011).Encuesta Nacional Condiciones de Trabajo 2011 [National Survey on Work Conditions 2011]. Madrid: INSHT.
INSHT (Instituto Nacional de Seguridad e Higiene). (2014).Segunda Encuesta Europea de Empresas sobre Riesgos Nuevos y Emergentes (ESENER 2) [2nd European Survey of Enterprises on New and Emerging Risks]. Madrid: INSHT. ISO. (1991).ISO 10075. Ergonomic principles related to mental work-load—general
terms and definitions. Geneva: ISO.
ISO. (2000).ISO 10075. Ergonomic principles related to mental work-load. Brussels: CEN. Jackson, S. A., Kleitman, S., & Aidman, E. (2014). Low cognitive load and reduced
arousal impede practice effects on executive functioning, metacognitive confidence and decision making: E115689.PLoS One, 9(12) doi:10.1371/ journal.pone.0115689
Kariya, T, & Sinha, BK. (2014).Robustness of statistical tests. New York: Academic. Koolhaas, JM, Bartolomucci, A, Buwalda, BD, De Boer, SF, Flügge, G, Korte, SM, &
Richter-Levin, G. (2011). Stress revisited: A critical evaluation of the stress concept.Neuroscience & Biobehavioral Reviews, 35(5), 1291–1301. Lazarus, R. (1999).Stress and emotion: A new synthesis. New York: Springer. López, MI, Rubio, S, & Luceño, L. (2010). Fase de ponderación del NASA-TLX: ¿un
paso innecesario en la aplicación del instrumento? [Phase weighting of NASA-TLX: An unnecessary step in the implementation of the instrument?].
EduPsykhé: Revista De Psicología y Psicopedagogía, 9(2), 159–175.
Loukidou, L, Loan-Clarke, J, & Daniels, K. (2009). Boredom in the workplace: More than monotonous tasks.International Journal of Management Reviews, 11(4), 381–405.
Matthews, G, & Davies, DR. (2001). Individual differences in energetic arousal and sustained attention: A dual-task study.Personality and Individual Differences, 31(4), 575–589.
Noyes, JM, & Bruneau, DPJ. (2007). A self-analysis of the NASA-TLX workload measure.Ergonomics, 50(4), 514–519. doi:10.1080/00140130701235232. Offrage, R. (2009). Influencia de las creencias causales en los procesos de toma
de decisiones [The influence of causal beliefs on decision making processes].
Revista Mexicana de Psicología, 26(1), 103–111.
Orasanu, J, & Connolly, T. (1993). The reinvention of decision making. In GA Klein, J Orasanu, R Calderwood, & CE Zsambok (Eds.),Decision Making in Action: Models and Methods(pp. 3–20). Norwood, NJ: Ablex.
Pekrun, R, Goetz, T, Daniels, LM, Stupnisky, RH, & Perry, RP. (2010). Boredom in achievement settings: Exploring control-value antecedents and performance outcomes of a neglected emotion.Journal of Educational Psychology, 102(3), 531–549.
Pretorius, A, & Cilliers, PJ. (2007). Development of a mental workload index: A systems approach.Ergonomics, 50(9), 1503–1515.
Recarte, MA, Pérez, E, Conchillo, A, & Nunes, LM. (2008). Mental workload and visual impairment: Differences between pupil, blink, and subjective rating.
The Spanish Journal of Psychology, 11(2), 374–385.
Rolo, G, Díaz, D, & Hernández, E. (2009). Desarrollo de una escala subjetiva de carga mental de trabajo (ESCAM) [Development of a subjective mental workload scale (SCAM)]. Revista de Psicología del Trabajo y de las Organizaciones, 25(1), 29–37.
Rubio, S, Diaz, E, Martin, J, & Puente, JM. (2004). Evaluation of subjective mental workload: A comparison of SWAT, NASA-TLX, and workload profile methods.
Applied Psychology: An International Review, 53(1), 61–86. doi:10.1111/j.1464-0597.2004.00161.x.
Rutledge, T, Stucky, E, Dollarhide, A, Shively, M, Jain, S, & Wolfson, T. (2009). A real-time assessment of work stress in physicians and nurses.Health Psychology, 28(2), 194–200.
Salvendy, G. (1997).Handbook of human factors and ergonomics. New York: John Wiley and Sons.
Sanz de Acedo Lizarraga, ML, Sanz de Acedo Baquedano, MT, Soria-Oliver, M, & Closas, A. (2009). Development and validation of a decision-making questionnaire.British Journal of Guidance & Counselling, 37(3), 357–373. doi:10.1080/03069880902956959.
Secchi, D. (2014).Extendable rationality: Understanding decision making in organizations. New York: Springer.
Soria-Oliver, M. (2010).Factores que influyen en la toma de decisiones: elaboración y validación de un cuestionario [Factors influencing decision making: Development and validation of a decision-making questionnaire]. Granada, SP: Zumaya-UNESCO.
Starcke, K, & Brand, M. (2012). Decision making under stress: A selective review.
Neuroscience & Biobehavioral Reviews, 36(4), 1228–1248. Weick, KE, & Sutcliffe, KM. (2008). Information overload revisited. In GP
Hodgkinson & WH Starbuck (Eds.),The Oxford Handbook of Organizational Decision Making(pp. 56–75). Oxford, UK: Oxford University Press. Wickens, CD. (2008). Multiple resources and mental workload.Human Factors,
50(3), 449–455.
Wierwille, WW, & Eggemeier, FT. (1993). Recommendations for mental workload measurement test and evaluation environment.Human Factors, 35(2), 263–281. Wilson, JR, & Rajan, JA. (1995). Human-machine interfaces for systems control. In
JR Wilson & EN Corlett (Eds.),Evaluation of Human Work: A Practical Ergonomics Methodology(pp. 357–405). London: Taylor & Francis. Yerkes, RM, & Dodson, JD. (1908). The relation of strength of stimulus to rapidity of
habit‐formation.Journal of Comparative Neurology and Psychology, 18(5), 459–482. Young, MS, & Stanton, NA. (2002). Malleable attentional resources theory: A new
explanation for the effects of mental underload on performance.Human Factors: The Journal of the Human Factors and Ergonomics Society, 44(3), 365–375. Young, MS, & Stanton, NA. (2005). Mental workload. In NA Stanton, A Hedge, K
Brookhuis, E Salas, & HW Hendrick (Eds.),Handbook of Human Factors and Ergonomics Methods(pp. 39–1). London: Taylor & Francis.