In-Vehicle Information Systems-related multiple task
performance and driver behaviour:
Comparison between different age groups
Dissertação apresentada a defesa pública com vista à obtenção do grau de Doutor
no Ramo de Motricidade Humana, Especialidade em Ergonomia
Orientador: Professora Doutora Anabela dos Santos Aleixo Simões
Júri:
Presidente: Reitor da Universidade Técnica de Lisboa Vogais: Doutor Josef Ferdinand Krems
Doutor Carlos Manuel Rodrigues Doutor José Domingos Carvalhais
Doutora Marie-Pierre Bruyas
Doutora Anabela dos Santos Aleixo Simões
Universidade Técnica de Lisboa
ACKNOWLEDGEMENTS
During the period that lasted this work, several were the persons that helped me and to which I am very grateful. First, I would like to thank my supervisor Anabela Simões, the person who gave me the opportunity to do this work and to be part of this important research project. I’m very gratified for her scientific and personal support. Also a special mention to José Domingos Carvalhais that gave me support and provided me with very useful strategic and scientific advises.
I want also to thank all the professionals that helped me while I was abroad for developing the practical part of this research. Thus, a very special mention to Marie Pierre Bruyas, Houda Hammama, Vincent Blanchet, Corinne Brusque, Arnaud Bonnard, Céline Goupil, Alexandra Fort, Nicolas Dapzol, Philippe Deleurenc, Daniel Letisserand, Céline Grange-Faivre, and Virginie Etienne. I would also like to mention Julie Manzano and Caroline Alméras that also gave me a very important emotional support while away from home. Thanks to all for making me feel at home. I would also like to thank Carlos Rodrigues, Miguel Leitão and Carlos Campos for the crucial technical help given to this project.
Also a very special mention to James McIntosh that gave me a precious help with the English.
Finally, I would like to thank the most important people: to Miguel, Lena, Beatriz, Francisco, José Luis, Madalena, João and also my dear friends. Without them this work would have been impossible to accomplish.
ABSTRACT
The presence of new technologies inside vehicles is becoming more common. Due to this fact, the potential changes produced on the driving task and also on the road safety must be examined. With the intention of contributing to amplify this knowledge, the present research aimed to study the impact of multiple visual and auditory inputs from in-vehicle information systems on the driver behaviour. It was investigated the interaction with more than one in-vehicle system (a guidance system and a mobile phone device) and verified its consequences on the drivers’ activity. To accomplish this goal two experimental moments were planned: one conducted in a real context and another in a simulated environment. Results revealed that the interaction with two in-vehicle systems produced considerable changes on drivers’ behaviour once subjects assumed more frequently unsafe actions like: inadequate indication of their actions; abrupt and unexpected adoption of determined behaviours; and also negligence of some road information from the environment. It was also verified that this situation produced more severe consequences to the driving task performance of elderly drivers. The management of all sources of information induced them to compromise their safety and be more frequently involved in dangerous situations.
TABLE OF CONTENTS
ACKNOWLEDGEMENTS ...iii
ABSTRACT... v
LIST OF FIGURES ... xi
LIST OF TABLES ... xv
NOMENCLATURE... xvii
INTRODUCTION ... 1
1. Relevance of the Research ... 3
2. Aim and Objectives ... 6
PART ONE: THEORETICAL FRAMEWORK ... 7
CHAPTER 1. DRIVING AND THE DRIVER ... 9
1. Introduction... 9
2. The Driving Task and Driving Activity... 13
3. Information Processing ... 19
3.1 Attention ... 23
3.1.1 Selective Attention... 25
3.1.2 Divided Attention ... 28
4. Multiple Task Performance ... 34
4.1 Distraction... 37
4.2 Workload ... 41
4.2.1 Assessing Mental Workload ... 48
5. Human Variability in Driving... 51
5.1 Age and Driving... 52
5.2 Elderly Drivers... 53
5.2.1 Safety of Elderly Drivers ... 54
5.2.2 Compensation Strategies... 63
CHAPTER 2. INTELLIGENT TRANSPORTATION SYSTEMS ... 67
1. Introduction of New Technologies ... 67
2. In-Vehicle Information Systems ... 69
2.1 Interaction With Mobile Phones While Driving... 72
2.1.2 Hand-Held and Hands-Free Mobile Phone Devices ...76
2.1.3 Influence on Driver Performance ...79
2.2 Interaction With Navigation/Guidance Systems While Driving...86
2.2.1 Introduction ...86
2.2.2 Traditional and New Navigation Methods ...90
2.2.3 Route Guidance Systems...93
2.2.4 Voice Instructions ...96
2.2.5 Position of the Display ...99
3. Ageing and ITS ...100
3.1 Elderly Drivers and Mobile Phones ...106
3.2 Elderly Drivers and Navigation/Guidance Systems...110
CHAPTER 3. Research Questions...115
PART TWO: METHODOLOGY...117
Introduction to the Experimental Framework ...119
CHAPTER 1. ON-ROAD EXPERIMENT ...123
1. Method ...124
1.1 Test Participants ...124
1.2 Test Vehicle and Instrumentation ...128
1.3 Experimental Course and Tasks...132
1.3.1 Development of the Course...132
1.3.2 The Main Task ...134
1.3.3 The Mobile Phone Task ...135
1.4 Variables Definition ...136
1.4.1 Independent Variables...136
1.4.2 Dependent Variables ...137
2. Data Collection...149
3. Experiment Procedure ...151
3.1 Presentation of the Experiment ...152
3.2 Training Period...153
3.3 On-Road Test ...154
CHAPTER 2: SIMULATOR EXPERIMENT ...157
1.1 Test Participants... 159
1.2 Test Vehicle and Instrumentation ... 163
1.3 Experiment Scenarios and Tasks ... 165
1.3.1 Development of the Road Scenarios... 165
1.3.2 The Mobile Phone Task... 171
1.4 Variables Definition... 172
1.4.1 Independent Variables ... 172
1.4.2 Dependent Variables... 173
2. Experiment Procedure... 183
2.1 Presentation of the Experiment... 183
2.2 Training Period ... 184
2.3 Simulator Test... 185
PART THREE: RESULTS AND DISCUSSION... 187
CHAPTER 1. RESULTS... 189
1. On-Road Experiment Results ... 190
1.1 Turning Indicators... 190
1.1.1 Omission Errors ... 190
1.1.2 Timing Errors... 191
1.2 Braking Behaviour ... 192
1.3 Moment to Turn ... 193
1.3.1 Hesitations ... 193
1.3.2 Abrupt Turn ... 194
1.3.3 Turn with Vehicle Near ... 195
1.4 Dangerous Situations ... 195
1.5 Navigation Errors... 196
1.6 Navigation Behaviour ... 197
1.7 Secondary-Task Performance ... 198
1.8 Visual Behaviour ... 199
1.8.1 Visual Behaviour Errors ... 199
1.8.2 Visual Behaviour Towards the Guidance System ... 201
1.9 Self-Reports ... 203
2.1 Lane Exceedences ...208
2.2 Mean Speed ...209
2.3 Violation of the Speed Limit ...210
2.4 Turning Indicators ...211
2.4.1 Omission Errors...211
2.4.2 Moment of Activation ...212
2.5 Navigation Errors ...213
2.6 Mobile Phone Task Performance ...213
2.6.1 Hesitations...213
2.6.2 Incorrect Answers ...214
2.6.3 Absence of Answer ...214
2.7 Visual Behaviour...215
2.7.1 Gazes Towards the Control Panel ...215
2.7.2 Gazes Towards the Guidance System ...217
2.8 Self-Report ...218
CHAPTER 2. DISCUSSION...225
FINAL CONSIDERATIONS ...245
1. Conclusions ...245
2. Methodological Considerations...251
3. Future Perspectives ...253
REFERENCES ...255
APPENDICES ...275
Appendix I...277
Appendix II ...279
Appendix III...281
Appendix IV...283
Appendix V ...287
Appendix VI...299
Appendix VII ...303
Appendix VIII...305
Appendix IX...307
Appendix X ...313
LIST OF FIGURES
Figure 1. Number of road traffic accidents per thousand road motor vehicles in 2004
(UNECE, 2007) ... 11
Figure 2. Number of persons killed in road traffic accidents per million population in 2004 (UNECE, 2007) ... 12
Figure 3. Filter model from Broadbent (1958) ... 26
Figure 4. Attenuation theory from Treisman, adapted from Treisman and Geffen (1967) as cited in Solso, 1998. ... 27
Figure 5. Structure of the Multiple-Resource Model of attention (Wickens, 1984)... 32
Figure 6. Scheme of reading aloud process, explained throughout the multiple-resource model (Wickens, 1984)... 33
Figure 7. Hockey’s compensatory control model of performance, 1997 ... 36
Figure 8. Simplified model of mental workload (Schlegel, 1993) ... 43
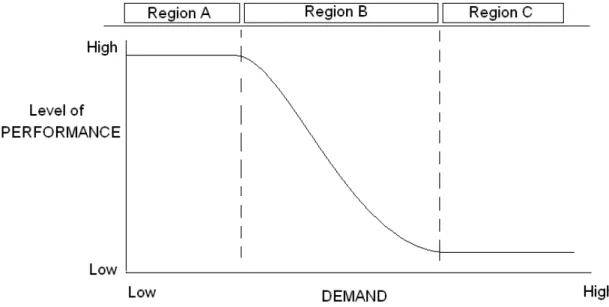
Figure 9. Relationship between demand and performance based on Meister, in de Waard, 1996... 45
Figure 10. Upgrade of region model with inclusion of a fourth region (D), in de Waard, 1996 ... 46
Figure 11. Representation of workload and performance in six regions (de Waard, 1996) ... 47
Figure 12. Traffic fatalities per billion kilometres travelled by age (SWOV, 2005)... 53
Figure 13. Number of kilometres driven in the past 12 months, per driver group ... 126
Figure 14. Frequency of car utilization, per driver group... 126
Figure 15. Frequency of mobile phone use while driving ... 127
Figure 16. Combination of all the images from the cameras and also from the program that gathered the dynamic data of the vehicle... 129
Figure 17. Vehicle used in the on-road experiment... 130
Figure 18. Guidance system display and bellow the two interface buttons for the mobile phone... 131
Figure 19. Guidance system image 20 meters to a turn left manoeuvre... 132
Figure 21. Sketch of the moment selected for analyse the glances towards the guidance
system...148
Figure 22. Frequency of mobile phone use while driving for each driver group...160
Figure 23. Percentage of subjects that use the mobile phone and the hands-free kit while driving ...161
Figure 24. Image of the simulator room with the car and the screen for the projection of the road scenario...164
Figure 25. Image of the simulated road environment ...166
Figure 26. Sketch of the base scenario ...167
Figure 27. Example of a direction sign placed in the first course (baseline course)...168
Figure 28. Location of the simulated route guidance system inside the vehicle...169
Figure 29. Image of a guidance instruction and the mobile phone interface ...170
Figure 30. Graphical representation of an intersection in the Baseline condition ...178
Figure 31. Graphical representation of an intersection in the one-system and two-system conditions ...179
Figure 32. Sketch from the “two-System” condition course representing the two zones for analysing the mobile phone task performance. ...181
Figure 33. Sections used to analyse the visual behaviour towards the control panel and guidance system ...182
Figure 34. Omission errors in both system conditions and for each driver group ...191
Figure 35. Timing errors in both system conditions and for each driver group...192
Figure 36. Percentage of sudden braking in both system conditions and each driver group...193
Figure 37. Percentage of hesitations in both system conditions and each driver group194 Figure 38. Percentage of abrupt turns in both system conditions and for each driver group...194
Figure 39. Percentage of turns with vehicle near in both system conditions and for each driver group ...195
Figure 40. Navigation errors in both system conditions and for each driver group...196
Figure 42. Percentage of observed behaviour in both drivers group and for each driver
group ... 198
Figure 43. Mean number of “no repetitions”, “no answers” and “incorrect answers” in the mobile phone task per intersection performed... 199
Figure 44. Visual checking errors towards the intersection area in both system conditions and for each of the driver group ... 200
Figure 45. Visual checking errors towards the rear mirrors in both system conditions and for each driver group... 201
Figure 46. Average number of glances per intersection in both system condition and for each driver group ... 202
Figure 47. Mean glance duration (seconds) in both system condition and for each driver group ... 202
Figure 48. Level of difficulty to understand the visual messages from the guidance system ... 203
Figure 49. Level of difficulty to understand the voice messages from the guidance system ... 204
Figure 50. Level of help given by the guidance system ... 204
Figure 51. Level of disturbance induced by the guidance system ... 205
Figure 52. Modification of the driving behaviour in the two-system condition... 206
Figure 53. Adequate management of the road environment information... 206
Figure 54. Neglect a source of information ... 207
Figure 55. Average number of lane exceedences per kilometre travelled in each test condition ... 208
Figure 56. Average time (seconds) in each lane exceedence for all systems condition209 Figure 57. Mean speed for both drivers group in different system conditions ... 210
Figure 58. Total frequency of speed limit violation for both drivers group in each system condition ... 211
Figure 59. Percentage of “omission” errors in all system conditions for each drivers groups... 212
Figure 60. Distance for activation of the turning indicator... 212
Figure 62. Percentage of “absence of answer” in both areas of the course for each driver group...215 Figure 63. Glances per section towards the control panel at the “out of intersection” area
...216 Figure 64. Glances per section towards the control panel in the “intersection” area....216 Figure 65. Glances per section towards the guidance display while “out of intersection” area ...217 Figure 66. Glances per section towards the guidance display while at the “intersection” area ...217 Figure 67. Level of difficulty to understand direction signs (baseline condition) and
guidance instructions (one-system condition)...218 Figure 68. Level of disturbance felt to the driving task in each course condition ...219 Figure 69. Level of disturbance induced by the mobile phone task on the driving and on the guidance task performance ...220 Figure 70. Modification of the driving behaviour while interacting with one or two
in-vehicle systems...221 Figure 71. Level of difficulty for the baseline, one-system and two-system conditions
LIST OF TABLES
Table 1. Adaptation of the levels of performance and correspondent complexity and activity levels (from Alexander and Lunenfeld in 1986, as cited in Groeger,
1999) ... 16
Table 2. Three performance levels of Rasmussen (1982) defined with the activity space (as cited in Michon, 1993; and also cited in Reason & Hobbs, 2003)... 19
Table 3. Stages in which resources are presented, multiple-resources theory... 31
Table 4. Modalities in which information can be presented, multiple-resource theory . 31 Table 5. Codification modes inside the information processing stages, multiple-resources theory ... 31
Table 6. Age-related declines and difficulties in driving (excerpts from Eby, Trombley, Molnar, & Shope 1998) ... 65
Table 7. Major ITS technology categories in the US, Europe and Japan. Based in data collected from ERTICO, 2004; ITS Japan; and ITS America (Wu, & Lee, 2007). ... 68
Table 8. Characterization of the sample’s age ... 124
Table 9. Occupation at the moment of the experiment per driver group... 125
Table 10. The longest job by the International Standard Classification of Occupations ... 125
Table 11. Independent variables considered for the on-road experiment... 137
Table 12. Dependent variables used for the on-road experiment ... 140
Table 13. Behaviour categories and its description for the interaction with the guidance system ... 145
Table 14. Measures included in the visual behaviour analysis... 148
Table 15 . Subjects’ balancing throughout the orders for the completion of the experiment ... 156
Table 16. Characterization of the sample’s age ... 159
Table 17. Frequency of use of a hands-free system... 161
Table 18. Sequence of manoeuvres for the first course (baseline course)... 168
Table 20. Sequence of intersections for the two-system course ...171
Table 21. Independent variables considered for the simulator experiment...173
Table 22. Dependent variables used for the simulator experiment ...175
Table 23. Balancing of the orders for completing all conditions of the experiment...185
NOMENCLATURE
ADAS_Advanced Driver Assistance Systems
AIDE_ Adaptive Integrated Driver-vehicle InterfacE
CONSENSUS_Project related with driving assessment ability of People with Special Needs through common methodologies and normative tools
COST_European Cooperation in the field of Scientific and Technical Research
ElectroOculoGram_Method to record the electrical activity associated with movements of the eye throughout the placement of electrodes a on the skin near the eyes
ERSO_European road safety observatory
ERTICO_Europe's intelligent transportation system organization that funds research and defines ITS industry standards
ESoP_European Statement of Principles on the Design of Human Machine Interfaces
FHA_Federal Highway Administration
HASTE_Human Machine Interface And the Safety of Traffic in Europe
HUMANIST_HUMAN centred design for Information Society Technologies
INRETS_Institut National de Recherche sur les Transports et leur Sécurité
ITS_Intelligent Transportation Systems
IVIS_In-vehicle Information Systems
MCH_Modified Cooper-Harper
NASA-TLX_National Aeronautics and Space Administration- Task Load Index
RSME_Rating Scale Mental Effort
SWAT_Subjective Workload Assessment Technique
The Wiener Fahrprobe_ method that registers the subjects’ behaviour while driving
INTRODUCTION
Industrialized countries have been watching to the development of new technologies and their introduction into the road transportation context. The advantages brought by such technology justify its presence, being this evidence each day more obvious, specially in what concerns in-vehicle technology. As these new systems are introduced on-board, it is essential to identify the exact consequences of the interaction between the driver and these novel equipments, discovering also the real costs for the road safety. For this reason, the present work aimed to study the impact of multiple visual and auditory inputs from in-vehicle information and communication systems on the driver behaviour.
This document is organized in three distinct parts. The first one is devoted to the theoretical framework where important aspects related with the driving task and the driving activity are mentioned. The most relevant theories to explain the driving behaviour are addressed in the first chapter, being focused topics like the information processing, the multiple task performance as well as aspects regarding the human variability. In the second chapter, the new technologies related to the road transportation context are mentioned, specially in what concerns the specific on-board equipments studied during this research. The first part ends with the research questions, elaborated from the theoretical review done previously and used to frame the practical work of the present research.
In the third part, the results of both experiments are presented separately in chapter one. Previously, a discussion considering the most relevant and significant aspects of the results is offered, being some of these outputs analysed and justified with the help of the information obtained in the theoretical review.
1. Relevance of the Research
Researches have devoted considerable amounts of time and effort to Road Safety issues. Statistics reveal that road traffic injuries and fatalities are very high, resulting in vehicle safety being conceived as a public health concern by developed countries. Two reasons that have given cause for concern over road safety matters for some decades are the complex and dynamic nature of the road transportation context. The multiplicity and diversity of its elements, as well as their constant changing, contributes not only to the development of the system but also to the creation of challenging problems. These evolutionary characteristics are present in three vertexes composing the vehicle-driver-environment paradigm of the road transportation context. Several reasons justify this variability over time; however there is one recent product that has introduced considerable changes to the driving environment within vehicles, influencing the way drivers behave: the Intelligent Transportation Systems. The development of new technologies and their introduction into the transportation sector has been a regular occurrence in industrialized countries. The advantage brought by such technology justifies its existence; as such positive aspects of the technology becomes more visible and important daily. The presence of related systems on the road environment and inside vehicles compel drivers to interact directly with several products using similar technology and, as a result, probably changing the driving task.
as a result of newer, integrated functions and capabilities of such novel equipments. Moreover, with the growing diversity of on-board systems, the likelihood of having more than one product of new technology inside the car becomes greater. These ultimate systems possessing innovative features and also the higher number of equipments induce not only different forms of interaction but can also lead to different consequences which, may not always be positive, creating concern for both driving performance and road safety domains.
The present research intends to contribute to increasing the knowledge and to search for explanations of peoples’ behaviour towards the multiple-task scenario. Knowing that studies have been investigating the consequences of a single in-vehicle system and that very few have analyzed the management of information provided by different and competing sources, this research aims to investigate the impact of multiple visual and auditory inputs from in-vehicle information systems on driver behaviour.
Aiming to verify the consequences of simultaneous inputs from more than one in-vehicle system, two different products were chosen to be the focus of this study: a guidance system and a mobile phone. The reason why these equipments were selected from others was mainly due to their popularity amongst road users. Mobile phone devices were introduced more than three decades ago and their frequent use is related to the advantages that they can bring to drivers. Some of the mentioned benefits are related with: the prevention of unnecessary trips; diminishment of the tendency to speed specially when a person is running late; contribution to security and peace of mind (particularly when someone is lost); improvement of mental alertness in a long and monotonous drive; augmentation of privacy in communications mainly to people that are never alone because of their job; and also the coordination of social engagements (Lissy, Cohen, Park, & Graham, 2000).
products into very appealing equipments and can be the cause of the increased number of guidance devices inside vehicles.
2. Aim and Objectives
The aim of the present research was to study the impact of multiple visual and auditory inputs from in-vehicle information systems on the driver behaviour. It was intended to investigate the interaction with more than one in-vehicle system and verify the consequences of this simultaneous scenario on the activity of the driver.
More specifically, the objectives of this research were to determine the consequences on the driving task performance produced by the simultaneous interaction with a guidance system and a mobile phone device. The produced changes were identified by means of assessing the driver’s mental workload while receiving information from both in-vehicle systems. Furthermore, this research also intended to verify the effects that this multiple-task scenario had on the interaction with both in-vehicle equipments.
Another objective proposed by this research was to determine the age-related differences on the drivers’ performance produced by the simultaneous interaction with the already mentioned systems. This difference was analysed among average and elderly drivers.
CHAPTER 1. DRIVING AND THE DRIVER
1. Introduction
Private automobiles have changed noticeably over the past century, although the majority of these transformations have been quite gradual. In spite of these changes the global form and function of automobiles have not been radically altered however the implementations made so far may have surreptitiously modified the driving task in several ways. For example, take the number of gears of the vehicle, which has been increasing, or the introduction of the automatic gear transmission. The speed capacity of the motor is different nowadays as well are break efficiency and the strength needed to control and manoeuvre the steering wheel. In addition to these aspects, which contribute to the modification of the way drivers interact and control their cars, are the alterations of the road environment. Roads are larger and organized in distinct ways, full of vehicles and pedestrians and surrounded by landscapes that can change from monotonous and empty to totally dynamic and crowded. However, one must not think that the ultimate stage of “evolution” has been reached; it seems that evolutionary changes will continue to be the rule. The development of new technology and its introduction into the automotive field has historically been rather slow however, as the introduction of more proven modifications continue, some consider that the infusion of information technology into the automotive world could speed up the rate of change (Nickerson, 1999).
United Nations Economic Commission for Europe (UNECE) and is usually used by governmental services for the analysis of accidents, patterns of accidents and for planning future improvements in road traffic safety.
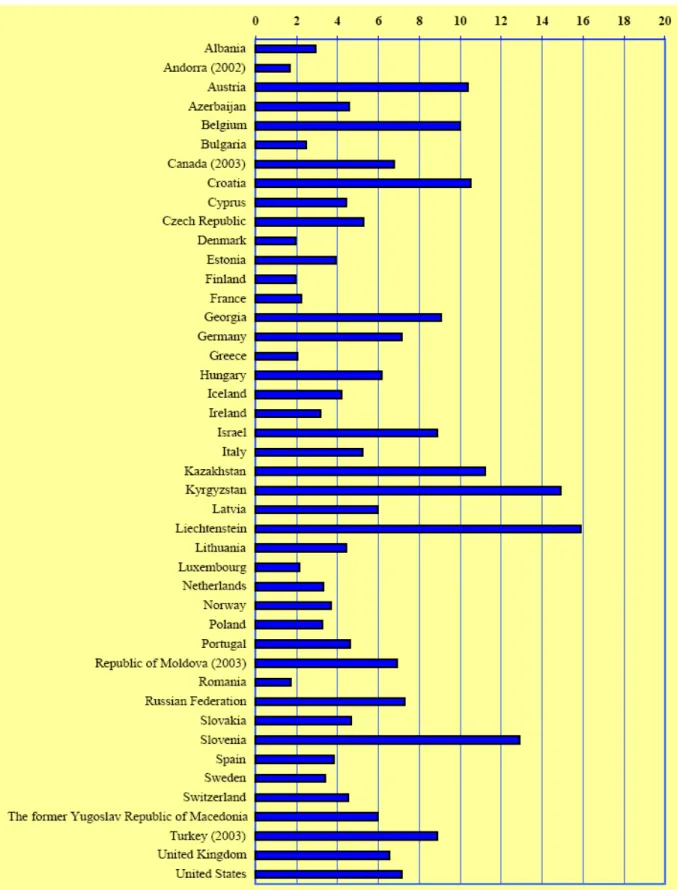
These statistics cover the decade 1994 to 2004 providing basic data of road traffic accidents and casualties in European countries, Canada, Israel and the United States of America.The scope of the statistics comprises road traffic accidents involving personal injury only, excluding accidents with material damage. Considering the decade in question (1994-2004), this document shows that on average over 150 000 persons were killed on the roads and about 6 million persons injured in 4 million road accidents. By probing more thoroughly it can be seen that the statistics per country can be witnessed throughout the number of road traffic accidents per thousand road motor vehicles and also by the number of persons killed in road traffic accidents per million population. These figures are expressed in the following graphics and concern the year 2004 (UNECE, 2007). Due to the fact that numbers of fatality and injury are high, vehicle safety can be conceived as a public health concern by several countries (Peters & Peters, 2002).
Figure 1. Number of road traffic accidents per thousand road motor vehicles in 2004 (UNECE,
Figure 2. Number of persons killed in road traffic accidents per million population in 2004
However, independently of the exact value human factors contribute to an accident, it is important to retain that human responsibility is substantial in what concerns road accidents. For that reason research on human factors must be done and the results must be considered in the design and evaluation of dashboard displays, safety restraint systems, signalling systems, vehicle lighting systems, steering and brake systems, road configuration and all concerning the automotive industry (Nickerson, 1999).
It must also be referred that these studies centred on human factors gain more importance due to the fact that some transport statistics reveal an increasing percentage of driver population. For example, the Transport Statistics of Great Britain (as cited in Groeger, 1999) indicated that from 1975 to 1991 the population of elderly drivers increased considerably; specially female drivers holding the highest percentage (males 5%, and females 29%). Statistics from the United States of America (as cited in Groeger, 1999) also support this development. In 1920 there was one motor vehicle for every ten people, while in 1990 the proportion increased leading to eight vehicles for every ten persons. These numbers take on even more importance when it is realised that the representation of some groups of drivers increase differently as described by the case of elderly females in the British statistics. Knowing that drivers can be categorised into several clusters, each cluster having specific characteristics that may determinate their involvement in a crash incident, it is of major importance to study these nuances and understand the proportion of different drivers developing over the time.
2. The Driving Task and Driving Activity
accidents and also that most of the errors committed behind the wheel do not actually result in an accident.
In 1970, McKnight and Adams (as cited in Shinar, Meir, & Ben-Shoham, 1998; and also cited in Michon, 1993) suggested that the driving task comprises about 40 major tasks and 1500 related subtasks that a driver must learn in order to accomplish the everyday driving activity. Such extended list of tasks and subtasks generally performed in “normal” driving are used to make specific displacements (from one point to another) in a determined environment that is frequently changing. These displacements have specific rules, are orientated by an objective and in order to be performed, the driver must get to know the surrounding environment and the detailed criteria of each situation (Neboit, 1978).
The complexity attributed to the driving task is also seen as connected to a strong time and space constraint, once specific reactions are required within a few seconds and at exact places. Additionally, the need for the driver to divide his or her attention through different areas of the road environment also contributes to road related difficulties (Bellet et al., 2003). The driving task demands constant motor and sensory adjustment and a permanent vigilance from the driver; also demanding a high level of attention in order to be performed safely (Brown, 1994).
Faced with the complexity of the task, one author tried to schematize the multiplicity of driving by breaking it down into different stages. Michon in 1979 (as cited in Joly, & Brouwer, 1995; and also cited by Bellet et al., 2003) classified the driving task as having three distinct levels: a strategic level, a tactical level, and an operational level. The strategic level is linked with the objective of the driving task, i.e. to move from one point to another. It involves planning the trip and the selection of trip goals and routes where the driver is going to pass. This level corresponds generally to a navigation task where the route is chosen depending on some course constraints, like the amount of traffic or an accident situation for example. Time management is also taken into account at this level: the time to start the trip, its duration and the destination should be reached.
The second level (tactical) integrates the group of actions needed to reach the goal and to perform the driving task in a specific moment. It is sometimes referred as the manoeuvring stage and includes actions like capturing the information from the road environment, interpreting the events and making decisions for that particular moment. Some examples are actions like overtaking a car, turning left at an intersection, choosing a determined speed and a headway distance, avoiding other vehicles or even integrating a stream of moving vehicles.
The final operational level corresponds to the effective way drivers perform the actions or more specifically the way they manipulate the vehicle controls in order to act tactically and strategically. For example, the driver can decide tactically to reduce the speed and then carry this action out by acting in distinct ways: by simply removing the foot from the accelerator; removing the foot from the accelerator and pressing the brake; or simultaneously pressing the brake and reducing the gear levels. Thus, to fulfil a tactical goal, the driver can choose to perform either one of the previous operational actions.
respectively with increasingly larger amounts of information. Therefore an action like braking (operational level) is less complex than overtaking (tactical level) which in turn is less complex than choosing the routes of the itinerary (strategic level) (Groeger, 1999). Another important notion concerning the hierarchy was given by Alexander and Lunenfeld in 1986 (as cited in Groeger, 1999) who stressed that the stages ascended due to the fact that while task complexity increases, the activity decreases. While driving, more time is spent controlling the vehicle (performing actions related with the operational level) than carrying out specific manoeuvres (integrated in the tactical level), but it is more difficult to make a manoeuvre correctly than to perform a single operation (like break or turn the wheel).
Table 1. Adaptation of the levels of performance and correspondent complexity and activity
levels (from Alexander and Lunenfeld in 1986, as cited in Groeger, 1999)
Complexity Performance Levels Activity (physical)
+ + + Strategic Trip planning + + + Tactical Manoeuvring the vehicle + +
+ Operational Manipulation of vehicle controls + + +
generally used to explain driver behaviour in a variety of contexts, have been utilized and recognized as very useful in the road transportation field.
The skill-based level is where the automatic control of routine tasks takes place. Actions like the control of the speed and the lateral control of the vehicle can be performed in this stage once they are frequently performed automatically, at least for experienced drivers. This is the level where the motor and sensory automatisms are activated and actions are performed without conscious knowledge, except for occasional checks on the progress of the driving activity. Here the activity is ruled by signals that unchain and control the automatic gestures. For the rule-based level of performance, activity is based on routines and relies on signs, controlled rules and procedures learned from previous experience. These procedures can also be acquired through transference of experience from others; through formal learning or even elaborated by past problem solving techniques acquired by the individual. For Reason & Hobbs (2003) most aspects relating to the social facet of driving occur at a rule-based-level. Situations like how drivers should react to other vehicles are clearly specified in highway codes and road traffic laws and control driver performance in many ways. Knowledge-based behaviours however are activated when no obviously familiar solution appears adequate in solving the problem in hand. When an unusual situation occurs and there is no specific rule to apply, the driver’s knowledge has to be “activated” in order to solve the dilemma. At this level the subject consciously mobilizes his/her resources to face the problem to accomplish that specific objective.
These three levels of controlling and processing information are linked with a level of familiarization of the performed activities. The skill-based level connects with the driver’s most familiar actions where the knowledge-based level is more divorced from familiar activities, i.e., more linked with unfamiliar events.
These three performance levels can also be seen as stages in a learning process where the driver is acquiring abilities and skills to perform the task. With increasing familiarization of a task the subject will gain more and more automatisms as the frequency of knowledge-based actions become reduced as experience increases. This experience is what can make driving, or at least some elements of driving, automatic because it relies on an open-loop control, i.e., sequence of actions unsupported by feedback from previous actions to accomplish subsequent activities (Groeger, 2000).
Early in 1992, Sellen and Norman have made a distinction between automatic and controlled processes that can be adopted to explain the driving task. They suggested that there are two modes of control: unconscious and conscious. The former is automatic and “modelled as a network of distributed processors acting locally and in parallel”; the latter “acts globally to oversee and override automatic control”. These authors also argue that those two modes of control are complementary as the unconscious mode is “fast, parallel and context-dependent, responding to regularities in the environment in a routine way” and the other is “effortful, limited, flexible and stepping in to handle novel situations” (Sellen & Norman, 1992). Automatic processing is believed to be developed when subjects process stimuli in a consistent manner over many trails, developing a consistent practice where the driver receives the same inputs and gives the exact same answer over and over again. This is the opposite of the controlled and conscious processing that is only activated when the stimuli vary among distinct situations (Schneider, Dumais, & Shiffrin, 1984).
Table 2. Three performance levels of Rasmussen (1982) defined with the activity space (as cited
in Michon, 1993; and also cited in Reason & Hobbs, 2003)
Control Modes Situation
Conscious Mixed Automatic
Routine Skill-base (SB)
Trained for problems Rule-based (RB) Novel problems Knowledge-base (KB)
3. Information Processing
In order to understand the driveing activity one has to understand that this activity is based on information collected from the environment. However, support for this is not constructed from objective information of reality but based on a mental representation made of the surroundings. This idea of representation, also called mental model, was generally considered by Tolman in 1948, (as cited in Burnett, & Lee, 2005; and also in Doyle, & Ford, 2000) when he claimed that after a considerable period of environmental learning, animals (including humans) build a mental representation of the space, which analogy can be made to a real map. This representation is a circumstantial creation from the environment in which the subject acts, being this model more or less loyal to the real world (Burnett, & Lee, 2005). Moreover, this mental representation is not only built with inputs received from the road environment but also relies on previous knowledge and experience the driver collected during his/her life. Based on this mental image, the driver travels around the road environment, makes decisions, plans actions and anticipates situations. Actions taken can be readjusted in the event of erroneous representations of reality, but if proper readjustments are not performed in time, incidents or serious accidents can occur (Bellet et al., 2003).
the senses, how is it analysed and then how this information is recognized as meaningful. Some simple models try to describe how this process is organized and what does the driver with all the information coming to his/her senses. Despite the complexity of these structures, the basic notion driving this processing model follows three main stages: stimulus detection, cognitive processing and response.
As mentioned by Solso (1998) Stimuli is transmitted to the brain through the various senses (vision, hearing, touch, smell, and also through the motion receptors). Any stimuli reaching the senses must be attended to before progressing onwards to the next stage, i.e., the subject must notice it and give it some attention. In case of noticing the input, a driver has to correctly interpret it, i.e., perceive it. This mechanism of perception is a complex phenomenon but essential in building the subject’s reality by interpreting what he/she captures from the environment. Once the stimuli have been detected (aspect related with the attentional mechanisms) and perceived (mechanisms of perception) the driver can process them; depending on the inputs received the individual will subsequently make a decision. This decision also relies on memory and previous experience, which accounts for different reactions from subjects even when the stimuli are the same. The last stage of the information processing is the response that can be either manual or verbal, or both.
Perchonok and Pollack in 1981 (as cited and adapted in Olson, 1993) describe the process, from stimuli to response, as having four stages: detection; identification; decision and response. In spite of having equal importance within the information processing system, the defined stages will be addressed differently according to the objectives of the present work.
This first stage is very important as its absence obviously compromises and blocks the subsequent phases. Failure of detection excludes the identification stage, however the detection of an event does not always guarantee identification in an effective way.
Identification – This second stage initiates after attention to the stimulus is achieved. This process, also referred to as perception, is the active process by which the human being transforms the sensory stimulation into meaningful information of the situation, i.e., is the interpretation process of the information detected by the senses. It is dependent on previous experience of the real world and when an individual interprets, he/she is making comparisons with previous events to create a mental model of the present situation. This mental model is based on ones recreation and construction, and therefore not a faithful “image” of the real world. For example, when any particular stimulus arouses the driver’s senses and provokes attention to that object, the driver will compare it with a previous experience with similar patterns, subsequently developing a construct that fits the ones already stored in memory (Solso, 1998).
When the interaction between a driver and their environment is studied it is important to bear in mind that visual perception is a major factor as driving is thought as being primarily a visual task. Visual information and its perception are essential in controlling the car and to interact properly with other road users. Olson (1993) suggests that one characteristic of vision is the level of conscious awareness that an individual has of its use; being comparatively higher than the information provided by other senses like for example the kinaesthetic (which is also important to operate an automobile).
process images from the surroundings at any specific moment (usually in short periods of time, readily primed, in case some response is needed at short notice). Broadly speaking, Olson refers to the eye’s structure as being like a simple camera:
“…has lens to focus the light, an aperture to control the amount of light entering, and a
light-sensitive surface to record the image. In a camera the lens can be moved relative to the film
plane to compensate for objects at different distances; the size of the aperture can be changed to
adjust to different lighting conditions; and films of different sensitivity can be used to expand
the range of lighting conditions in which photographs can be taken. The eye has all of these
characteristics.” (Olson, 1993, p. 164)
Due to its structure, the eye is not able to analyse the entire ‘picture’ in the same accurate way. The analysis of image detail is confined to a very small part of the scene, an area centrally focused on within the visual field. When a driver looks at an object in their surroundings, his/her eye movements ensure that the image of this object falls upon the region with better detailed vision. Outside of this area images are represented in a very inaccurate level of detail, being the acuity in these regions poorer. In these areas the peripheral vision can only perceive shades, gross forms and vague sensations of movement. Accurate vision is only achieved in a limited central area of the individuals’ field of view; detailed knowledge of the visual world is only acquired by moving the eyes around the scene, performing brief fixations and eye movements (Sanders, 1993).
minimal while, for situations that do not match with the driver’s expectancy, the intensity required can be considerably higher.
Perception also has some limitations. In relation to visual perception it is important to highlight that the perceptual system is not equally effective in dealing with all stimuli in all types of situations. One example is the problems associated with perceiving the stimuli at night and optical illusions of various descriptions that can affect the ability of drivers to detect specific situations. Certain driver situations present a higher probability of error due to the limited capacity of the perceptual system to adequately interpret situations like the ones involving the assessment of relative speeds (Olson, 1993).
Decision – After obtaining the necessary information from the stimulus, the driver must decide what to do with it, and prepare an action if required.
Response – In this final stage the muscles receive the necessary instructions to carry out the adequate and planed action. This process ends when the action is effectively initiated.
The following paragraphs will give further information regarding the detection of the stimuli (attention). Only the significant aspects of the attentional mechanisms will be discussed in more detail as they are considered to explain and support theoretically the processes addressed in this research.
3.1 Attention
information. The amount of information that can be passed on to the perceptual process is known as the channel capacity.
For Egeth and Yantis (1997), there are two main determinants of where attention is directed to: exogenous and endogenous factors. Attention can be driven to exogenous factors, i.e. to a stimulus that is presented in the surroundings and captures the driver’s attention. These exogenous factors attract the driver’s attention automatically and involuntarily (e.g. a sudden movement of a pedestrian or a rapid appearance of a car). On the other hand, attention can be controlled by endogenous factors, being goal-driven. In these cases it is directed to something in a voluntary and conscious manner in order to obtain specific information to fulfil an objective. It is important to understand that these two processes are not exclusive and, in an everyday driving situation, attentional allocation is a complex correlation between exogenous and endogenous factors.
James Reason and Alan Hobbs (2003) describe a number of characteristics of attention:
• Has limited capacity; a subject can only attend to a small portion of the sense data available.
• Has limited commodity when focused on one particular thing due to attention being withdrawn from other competing material.
• Can be captured by unrelated matters; concerns, thoughts and worries can all be sources of distraction and deviate attention from the primary task.
• Is hard to sustain for a long period of time.
• Sustaining it depends highly on the subject’s interests of the current object of attention.
• Its demand decreases for highly skilled or habitual actions.
• A correct balance is needed to perform adequately in specific situations, too much attention to routine actions can disrupt them and a low level of attention in demanding and unusual situations can lead to incorrect behaviours.
A number of competing factors can control the direction to which the driver’s attentional resources can be focused. The individual’s intention [the endogenous aspect that Egeth and Yantis (1997) mentioned earlier] and an enormous number of other different stimuli (exogenous) can claim driver’s attention, being grabbed and switched from one to another. Directing attention to important exterior inputs depends on their physical characteristics but also on the understanding of surroundings. For that reason experience is an essential aspect that influence the way drivers direct their attentional resources and capture information (Durso, & Gronlund, 1999).
Attention is capable of guiding the subject’s perception along the environment; however this concept is relevant to broader scopes of human performance. Attention is not only crucial for unchaining the perceptual process but also for distributing the resources between varied tasks (Wickens, 1992). Authors have studied these attentional mechanisms and tried to explain how individuals directed, maintained and managed their resources while performing one or several tasks. Along decades a range of models were developed, expressing structures that explained the processes in which subjects selected and allocated their attentional resources through more than one task. A central idea for most models suggested that subjects have limited resources to allocate to a specific task or set of tasks. When the task demands exceed the individual’s limited capacity, performance may visibly deteriorate. Thus, knowing that resources can be envisaged in terms of neural processing capacity, this deterioration means that resources needed to perform such task are greater than the ones made available by the subject (Hole, 2007).
3.1.1 Selective Attention
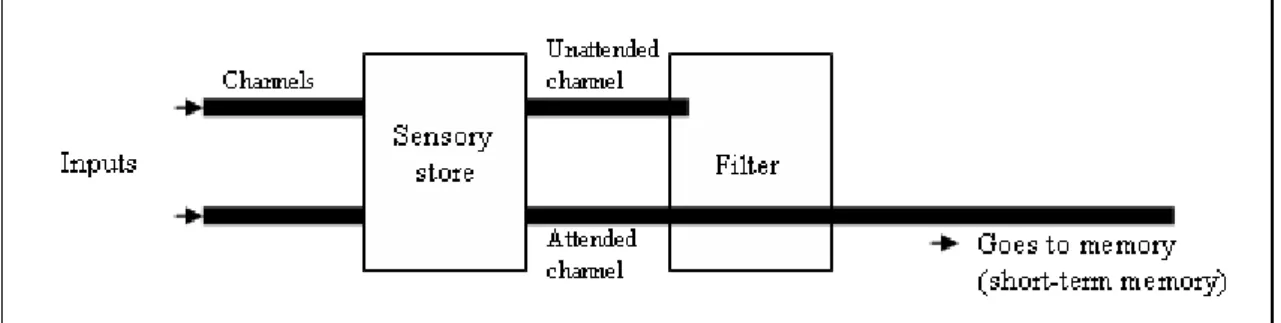
One of the most notorious experiments regarding the selective attention mechanisms was the one performed by Broadbent (as cited in Fortin, & Rousseau, 1992). Results from this experiment (where participants were asked to listen simultaneously to two distinct lists of numbers) induced to a set of conclusions that were used to support his model. Broadbent’s filter model of selective attention defended that the sensory information (speech) was received in channels. Afterwards, this information was kept for a short period of time into a buffer (temporary store) before reaching into a filter. The filter selected which information passed on to perception, being this choice based on its physical characteristics. This selected data was defined as the focus of attention. Another aspect that this model suggested was that unattended information could be recalled from the temporary storage however, this recall couldn’t take long because unattended information decayed rapidly. In sum, this model showed that subjects could only attend to one channel at a time and that switching attention between channels required considerable effort (Fortin, & Rousseau, 1992).
Figure 3. Filter model from Broadbent (1958)
To explain this fact Moray suggested that some kind of analysis must occur before the filter. Soon afterwards, another investigator tried to find an explanation for that event suggesting that in the subject’s stored words some have different threshold of activation. For that reason Treisman (as cited in Solso, 1998; and cited in Lucas,1992) drew up a new model. Instead of the unattended channel of information being turned “off” like Broadbent defended, the channel was turned “down”. Thus, information in unattended channels was partially processed, just enough to allow a breakthrough if the subjects’ attentional mechanism considered it to be sufficiently important or interesting. This model, called attenuation theory, considered that the “turned down” unattended channel was attenuated by a filter, allowing that non-attended meaning information could pass on but in a weaker form. Due to this weaker signal subjects could ignore it however biological or emotionally important stimuli may get through.
Figure 4. Attenuation theory from Treisman, adapted from Treisman and Geffen (1967) as cited
in Solso, 1998.
by Norman (as cited in Fortin, & Rousseau, 1992). He elaborated on Deutsch and Deutsch's model by suggesting that selection was determined not only by the pertinence of the sensory inputs but also by the strength to which inputs reached and stimulated the sensory systems.
Nevertheless, with the development of investigation further researches raised also some questions regarding the fidelity of this late selection model. Some considerations were made to this theoretical framework as it could be showed that subjects were much better than expected to detect messages and analyse the meaning of information. In fact, simultaneously to the development of these models of selective attention, other authors tried to unmask the mechanisms of attention. The elaboration of experiments to validate or to oppose previous theories also allowed discovering other aspects related with the studied processes. Some examples are the mechanisms related with the divided attention, i.e. the processes occurred when an individual tries to attend to two or more sources of information at the same time.
3.1.2 Divided Attention
While performing a single task, subjects try to allocate specific amounts of attention to capture the surrounding information and perform the activity. This idea is related with the quantitative properties of attention and was very much considered by Moray in 1967 (as cited in Wickens, 1992). This researcher proposed that attention is a limited capacity that could be allocated in diverse amounts and to several activities. This supplied quantity could depend on the difficulty of the task but also on the demand for that capacity. This means that more attentional resources can be needed for more difficult tasks or if a higher level of performance is required.
The relation between the task difficulty and the attentional resources needed was also mentioned by Kahneman (as cited in Fortin, & Rousseau, 1992; and cited in Wickens, 1992) however this author also defended that, apart from difficulty, task demands also increases when additional tasks are imposed. He suggested that when performance of two tasks happens at the same time an increase in the attentional resources supply occurs. If this increase is not enough to compensate the demands that both tasks require, a performance decrement can be verified. This lower level of performance increase as the discrepancy between the requirements and the supplies augment. In fact, this is the nuclear idea for the single resource theory.
Along the years one set of theories proposed that individuals have a unique resource of attention (single resource). This resource concept was based on the assumption that subjects possessed limited capacities of available cognitive processes for performing a task. If, in principle, two tasks demand more attention than a single one, simultaneous task execution could lead to a situation where one ore both tasks are supplied with fewer resources than required. Then, a management between stimuli/tasks must be done in order to accomplish dual-task performance. If tasks have smaller amounts of resources than needed or, at least few resources than they would have if performed alone, it is expected to see a decrement in the performance of one or both tasks (Wickens, 1991).
tasks. The division of resources was also considered by this single resource idea once it was argued that subjects could allocate their resources in a flexible way. This means that individuals might allocate the desired proportion of resources to accomplish the tasks, not needing inevitably to adopt a 50/50 split to each task. As an example, if a driver conducts a mobile phone conversation while driving, he/she can choose to devote 15% of the attentional resources to complete the additional task or, in case of a highly difficult or more interesting conversation, allocate a higher percentage of attentional resources, penalizing more the main task – driving (Wickens, 1992).
Recent theoretical approaches define and justify the problem of dual-task performance in a different manner. The opposition to the single-task resources theory and the drawing results from a large number of dual-task studies, led to the emergency of a new construct: the multiple-resource theory. This theory was developed based on experiments suggesting that, rather than a single resource subjects possess a number of resources, each one dedicated to a particular type of processing job. Some authors like Allport in 1972 (as cited in Fortin, & Rousseau, 1992; and cited in Wickens, 1992) have supported this idea. He demonstrated that pianists were able to read music while shadowing speech, maintaining an adequate performance in both tasks. Moreover, in 1976 Spelke and colleagues (as cited in Wickens, 1992) trained students to perform two simultaneous tasks: reading a short story while writing down dictating words. Six weeks after students ability to recall the short stories was very good, being this performance equal to the performance without the dictation.
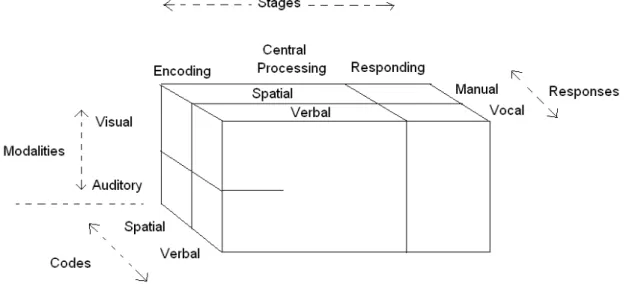
In 1984, based on the results of dual-task studies, Wickens (1984) drew a model expressing that resources could be defined by three dichotomous dimensions: the stage of resources; the modality and also its processing codes. In a more specific manner these dimensions were defined as following:
separation is justified by the results of some experiments: different levels of difficulty to respond to a task were imposed and this manipulation had no interfere with the performance on a concurrent task whose demands were more perceptual.
Table 3. Stages in which resources are presented, multiple-resources theory
Processing stages
Encoding Central processing Responding
- Modalities: two modalities can define the way inputs reach the subject. It can be done in a visual or in an auditory manner. Experience showed that subjects can sometimes divide attention between what is seen and what is heard. This is done in a better way than dividing attention between two auditory messages or between two visual inputs.
Table 4. Modalities in which information can be presented, multiple-resource theory
Visual Modalities
Auditory
- Codes: after the visual or auditory messages enter the processing information mechanism, they are transformed in different codes. Messages are encoded and processed centrally in a spatial or in a verbal way, being afterwards transformed into manual or vocal to produce an effective response. It is believed that the separation of spatial and verbal resources apparently accounts for the high degree of efficiency, while manual and vocal outputs can be time-shared. It is also assumed that vocal responses are based in verbal encoding and processing of information, being the manual outputs concerned to spatial codes.
Table 5. Codification modes inside the information processing stages, multiple-resources theory
Processing stages
Encoding Central processing Responding
Spatial Manual Codes
Verbal Vocal
visual manner. If a response is needed, that codification change into manual or vocal modes and a response is given.
Figure 5. Structure of the Multiple-Resource Model of attention (Wickens, 1984)
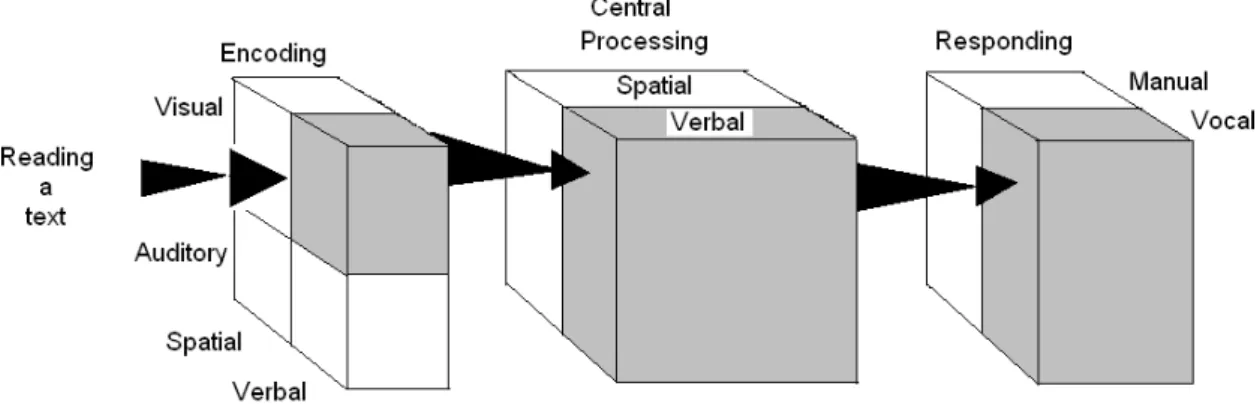
Figure 6. Scheme of reading aloud process, explained throughout the multiple-resource model
(Wickens, 1984)
4. Multiple Task Performance
The act of performing simultaneously two or more tasks gains relevance in some specific contexts due to the type and severity of the consequences that this situation can produce. Specifically in the road context, multiple-task scenarios are of much concern once the outcome of this synchronized performance can be highly severe. For this particular context, performing several tasks at the same time means that, while driving the subject performs other tasks and gives attention to other situations. These other tasks can be related to driving as their execution can assistance the fulfilment of the driving goals (like when looking to a paper map to find the best route to reach a destination or gaze to a device that sends graphical information to help parking). However, some other tasks can be unrelated to the driving itself, not being their accomplishment a benefit or an assistance to driving (like eating, brushing the hair or having a trivial mobile phone conversation with a friend).
As it was previously explained, the major concern related with the multiple task performance in road context is associated with the allocation of attentional resources. This preoccupation is based on the assumption that, while driving and performing an additional task, the attentional resources that should be entirely directed to driving are divided with the supplementary task. Thus, less attention is devoted to the vehicle and to the road environment, leading to an accident risk augmentation. For this reason investigators have been studying the causes and consequences linked to this challenging issue, using theories and models that try to explain the human behaviour in those particular scenarios. Example are the previously presented theories of attention, which attempted to describe the way drivers select the information and manage their attentional resources to perform simultaneously more than one task. Along with those theories and studies, other works have been conducted to unmask the mechanisms related with the multiple task performance.
conscious and others unconscious. He suggested existing a lower level to treat familiar processes and a higher level to monitor and alter the operations in the lower stage. When something impairs the process of information at the lower stage, the activity at the higher level increases as a way to compensate that limitation. However, when the processing capacity of this higher level reaches its limits (like the emergence of fatigue), the overall task performance can be deteriorated. Considering the driving activity as an example, whenever the completion of an additional is asked to a driver, the higher level for processing information is activated and the cost and effort devoted to that situation may decline its performance.
Consistent with this theoretical perspective was the idea of Schneider and Shiffrin (as cited in Fortin, & Rousseau, 1992), that expressed a distinction between controlled and automated processing. Controlled processing was characterized as being conscious, dependent of voluntary control, flexible but slow. Comparatively, the automatic processing was seen as requiring less processing capacity from subjects, faster but rigid and with limited voluntary correction. Thus, for experienced drivers the task performance may be relatively automatic, allowing this automatic processing of vehicle control some spare capacity for executing other tasks.
Some years latter Norman and Shallice (1980) postulated the existence of two qualitative control systems: a lower level contention scheduling and a higher one named
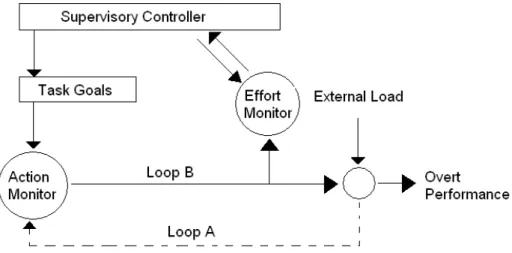
A recent work developed by Hockey (1997) represented the multiple task performance in a model named as compensatory control model. He believes that if subjects are faced with a variety of complex tasks they try to preserve their performance on the primary task by utilizing some strategies. According to this model performance derive from two types of informational processes: 1) automatic and unconscious control process and 2) another process that allows conscious control. Well-learned skills and routine behaviour are controlled by the automatic process (represented in the following figure as loop A). However, if something unexpected occurs and the actual performance doesn’t match with the desired one, the conscious control is activated (represented in the following figure as loop B). This activation aims to change the situation, either in the form of changing the task goals or modify the amount of effort expended.
Figure 7. Hockey’s compensatory control model of performance, 1997
4.1 Distraction
Performing one or more tasks while driving is an issue that researchers have been focusing on. As it was briefly explained earlier, driving and conducting a simultaneous task can impair driving performance once individuals are not devoting the necessary attention to the primary task (driving). Attention, or part of its resources, are driven away to the additional task(s), leading to a situation were drivers can be distracted from their main mission. Besides the recognised importance of distraction, its analysis is not done easily nor do results show a unique characterization of its consequences.
Early in 1980, Treat (as cited in Transport Canada, 2003) mentioned that the leading human factor causes for collision included driver distraction, inattention and improper lookout. Latter in 1996, other authors considered that driver distraction estimated to be a contributing factor of about 20% to 50% of all accidents (Ranney, Mazzae, Garrott, & Goodman, 2000). More recently the U.S National Highway Traffic Safety Administration (as cited in Manser, & Even, 2002) estimated that driver inattention was the cause of a minimum of 25% crashes, being half of these crashes due to a form of inattention called distraction. Besides the possible evolution regarding the contribution of distraction to road accidents statistics, these data can show some confusion when it is intended to know specifically the extension of this problem.
As mentioned on the inquiry to driver distraction made by the Road Safety Committee (2006), data from statistics can be somehow imprecise due to several factors. Once the cause of accidents can be varied and attributed to a combination of factors, authorities that characterize accidents can miss to qualify the cause to distraction because it can be less obvious and more difficulty to identify. In those situations, accident causes can fall into other more obvious categories, like for example speeding.
quantified consequences of driver distraction are taken into account: the fact that a single internationally accepted definition of distraction does not exist. Thus, to determine the role of driver distraction it is important to clarify its definition and distinguish it from other related driving behaviours. This lack of common, valid and reliable definition is pointed out by Pettitt, Burnett, and Stevens (2005). They consider that an agreed definition could help to clarify the future research once it would facilitate the categorization of cases and allow easier cross-study comparisons.
Generally, definitions of distraction have been made by relating it with inattention or, in the other hand by separating them into two distinct behaviours. An early definition was given by Treat in 1980 (as cited in Transport Canada, 2003) stating that driver distraction happened when a driver was delayed in the recognition of information needed to accomplish the driving task safely. This delayed recognition was due to an event, activity, object or person inside or outside the car that compelled or induced the driver to transfer attention away from the driving task. This definition, also supported by other researchers (e.g Pettitt, Burnett, & Stevens, 2005; Manser, & Even, 2002; Stutts, Reinfurt, Staplin, & Rodgman, 2001) is in fact in agreement with the Traffic Injury Research Foundation of Ontario (as cited in Road Safety Committee, 2006) when it considers that distraction is different from inattention and what distinguishes these two definitions is the presence of a triggering event or activity. This means that whenever something or someone captures the attention of a driver from the driving task, distraction should be considered. Young, Regan, and Hammer (2003), which also shares the same idea of differentiation between distraction and inattention, starts a chapter named “What is driver distraction” by saying that “driver distraction forms part of the broader category of driver inattention” (pp.2).
the Victorian Government. Similarly to the previous description VicRoads also considers distraction as triggered by a secondary event or action. This attentional deviation can be made voluntary or involuntary, happening in two possible distinct situations: while performing one or more additional task(s), or when focusing an object, event, person that is not related with the driving itself. This distraction can reduce the drivers’ awareness, the decision making and also the performance on the primary task, and can lead to serious consequences like collisions or ultimate corrective actions to recover from inadequate situations. Considering that the definition from VicRoads could be more explicit, the Road safety Committee (2006) adopts an explanation made in the 2005 International Conference on Distracted Driving:
“Distraction involves a diversion of attention from driving, because the driver is temporarily focusing on an object, person, task, or event not related to driving, which reduces the driver awareness, decision-making, and/or performance, leading to an increased risk of corrective actions, near-crashes, or crashes.” (in Road safety Committee, 2006, pp. 9)
Additionally is referred in this report that driver distraction and driver inattention should be classified as two distinct behaviours.