Prices Lead Earnings in Brazil?
Mateus Alexandre Costa dos Santos
Master in Accounting Sciences and Doctoral candidate of the Multi-institutional and Inter-regional Graduate Program of Accounting Sciences, - Federal University of Brasília, Federal University of Paraíba, Federal University of Rio Grande do Norte
E-mail: [email protected] Anderson Luiz Rezende Mol
Ph.D., Department of Administrative Sciences, Federal University of Rio Grande do Norte E-mail: [email protected]
Luiz Carlos Marques dos Anjos
Master, School of Economics, Administration and Accounting, Federal University of Alagoas E-mail: [email protected]
Josicarla Soares Santiago
Master, Department of Applied Social Sciences, Federal University of Paraíba Email: [email protected]
Received on 9.29.2012 - Desk acceptance on 10.3.2012 - 3rd version approved on 6.4.2013
ABSTRACT
This article aims to identify the timing of the return-earnings relationship in Brazil, that is, the degree of time lag between the occurrences of the variables. This research was developed based on assumptions from the prices lead earnings hypothesis, the fundamental premise of which is that the stock price is informationally richer than the current and past accounting earnings in terms of future earnings, which invalidates the establishment of a contemporaneous relationship (timing zero) between these variables. This research was conducted by means of pooled regression using panel data (fixed effects and random effects). Four models were employed in total. A total of 205 firms were analyzed over 53 quarters (1999 to 2012), resulting in 8,440 firm-quarters. The results indicated that accounting earnings alone are not informationally contemporaneous to stock price. However, when the effects of future earnings on this relationship were eliminated, it was found that there are signs of timeliness. Furthermore, it was found that the returns anticipated information about future earnings. The identified associations suggest that this anticipation occurs over at least eight quarters. However, it was not possible to determine the timing of the quarterly return-earnings relationship in Brazil because, on the one hand, past returns are associated with current earnings and, on the other, the significance of future earnings in explaining current returns depends on the arrangement of the independent varia-bles in the model. Nevertheless, it is clear that the results converge with a timing equal to 1, in which the return anticipates earnings in the following period, a result that was independent of the addition of the other variables in the model.
1 INTRODUCTION
Stock prices follow the expectations of investors and are conditioned on the information available at any given time. It may be assumed that this relationship occurs rationally but without obeying specific rules. Each investor has his/ her own decision model that is influenced by his/her indi-fference to the various risk and return configurations es-tablished for the assets. Accounting earnings, meanwhile, also capture much of this information; however, they do so subject to the limitations imposed by objectivity, by con-servatism and by the rules for the recognition of revenue within the accounting model itself, which render them in-formationally untimely.
To some extent, prices and earnings can be considered to be signs of the same state of reality, although they are not contemporaneous. This situation appears more clear-ly in light of market efficiency. Accounting earnings tend to have a delayed response to the relevant events conside-red by the market when valuing stock (Beaver, Lambert & Morse, 1980). The primary implication of this delay is that only part of the contemporaneous variation in earnings is a surprise to the market with respect to the expectations regarding future earnings (Collins, Kothari, Shanken & Sloan, 1994; Kothari & Zimmerman, 1995).
The portion of information about future earnings that is not expressed by current earnings is an important varia-ble that is omitted in the traditional model of the return-earnings relationship contributes, alongside the competing effect of information obtained from other sources, to ob-taining low and biased response coefficients for earnings and a low explanatory power for the models1 (Kothari & Zimmerman, 1995; Kothari, 2001).
The prices lead earnings hypothesis addresses part of this problem. Under this concept, it is assumed that prices contain more information about future earnings than the series of current and past earnings, i.e., prices have informational content regarding future earnings (Beaver et al., 1980; Kothari & Zimmerman, 1995). One implication of this phenomenon is that market expecta-tions for earnings are different from expectaexpecta-tions based on the earnings time series. This time series is descri-bed as a random walk in much of the literature, meaning that past earnings cannot anticipate the subsequent va-riations (Kothari & Sloan, 1992).
Important studies have explored, directly or indirectly, or recognized the lack of informational timeliness betwe-en prices and earnings, for example, Beaver, Lambert and Morse (1980), Kothari and Sloan (1992), Kothari (1992), Collins, Kothari, Shanken and Sloan (1994), Ayers and Freeman (2000) and Truong (2012). However, despite the relevance of the topic to accounting research in the capi-tal markets, with a few exceptions such as Galdi and Lo-pes (2008), Pimentel and Lima (2010), Santos and Lusto-sa (2010), Sales (2011) and Paulo, Sarlo Neto and Santos (2012), it has been little explored for the Brazilian stock
market. This study of the temporal aspects of the return-earnings relationship therefore aims to bridge this gap in the national literature and to provide theoretical and me-thodological contributions to advance the understanding of this relationship on the national scene.
The study therefore aims to identify the timing of the return-earnings relationship in Brazil, which ultimately is the primary indicator of the prices lead earnings hypothe-sis. To that end, the following research questions will be studied:
Is there informational timeliness between the quarterly ◆
stock returns and quarterly accounting earnings of publicly traded Brazilian irms?
Do the quarterly stock returns of publicly traded Brazi-◆
lian companies anticipate information regarding future quarterly earnings?
What is the timing of the return-earnings relationship? ◆
Informational timeliness is understood here to be a significant relationship between two variables, in this case accounting earnings and stock returns, when considered at the same moment in time. The timing is used to indicate the degree of the time lag between the occurrences of the variables when a significant relationship between them is verified. For example, in a contemporaneous relationship, the timing is zero; however, where there is 1 lag between the variables, the timing is -1, and so on.
In general, the results obtained showed a lack of infor-mational timeliness between returns and earnings with a timing equal to 1, where returns anticipate earnings in the subsequent period, i.e., prices can anticipate earnings. Ho-wever, the study shows that current earnings are contem-poraneous when future earnings are introduced into the analyzed relationship. These findings, among others ob-tained in the study, offer an important contribution to the improvement of the operational and analytical models em-ployed by Brazilian studies investigating the return-earnin-gs relationship, given that many of them do not commonly consider or only partly consider these time lag effects when defining such models.
Furthermore, these findings provide additional sup-port for the forecasting of future earnings for investors or investment analysts in that they indicate that the current stock return has informational content in relation to future earnings, notably for the subsequent period.
The remainder of the paper is organized as follows. Section 2 presents the empirical evidence obtained in previous studies, discusses the theoretical aspects un-derlying the price leads earnings hypothesis and states the research hypotheses. Section 3 addresses the metho-dological aspects of the study. Section 4 presents and analyzes the results obtained and Section 5 presents our final considerations.
2 DEVELOPMENT OF THE RESEARCH HYPOTHESES
2.1 Theoretical Framework.
The traditional model for the price-earnings ratio as-sumes the following: (i) the earnings of a period contem-poraneously reflects all of the information contained in that period’s return, (ii) only the information contained in earnings (expected future cash flows) affects the price of stock, (iii) earnings follow a random walk and (iv) the rate of dividend payout is 100% (Kothari, 1992).
Kothari (1992) emphasizes that the purpose of premi-se "iv" is to simplify the econometric analysis of the price-earnings ratio and that it does not sacrifice the economic intuition associated with a more realistic payout rate. Re-garding premise "iii", despite the existence of divergences, for some time, much of the literature has been assembling a substantial body of evidence indicating that the time series of annual earnings follow a random walk or a random walk with a trend (Kothari, 2001).
Premises "i" and "ii" are unrealistic and contrary to the implications of market efficiency, an underlying hy-pothesis assumed in the accounting research on capital markets. In an efficient market, the stock price (Pt) ins-tantly reflects the expectations of its participants regar-ding future cash flows. In addition, earnings (Xt), due to limitations imposed by the accounting model, especially the criteria for the recognition of revenues and expenses, tend to incorporate the information already reflected in Pt systematically with a delay. It therefore follows that Pt is informationally richer about future earnings than the se-ries of current and past earnings. In other words, the ma-rket expectations and the expectations based on the time series of Xt become different, a phenomenon (hypothesis) known as prices lead earnings (Beaver et al., 1980; Lev, 1989; Kothari, 1992, 2001).
The first study that addressed this phenomenon was that of Beaver et al. (1980). The results obtained confir-med that Pt is informationally richer than Xt. Other im-portant studies were those of Kothari (1992), Kothari and Sloan (1992) and Kothari and Zimmerman (1995), who discussed and demonstrated the effects of this phenomenon on econometric models that addressed the price-earnings ratio - traditionally used up until then in the international literature - and offered alter-natives to mitigate them.
This informational superiority of Pt, according to Beaver et al. (1980), may occur for various reasons. For example, (i) Xt can be considered to be an aggregation of earnings of smaller intervals, thus Pt can be used to obtain informa-tion about pre-aggregated series that is lost in the temporal aggregation process, (ii) there are events that affect future earnings and that are not reflected in Xt and (iii) Xt can be represented by a process comprising more than one sto-chastic variable.
If Xt follows a random walk, all information expressed in Pt is already contained in the past series of Xt. However, if Pt contains information about future earnings, it must therefore have violated the random walk premise because
the future variations of Xt can be anticipated by market participants. It is for this reason that Beaver et al. (1980) assumed that Xt is formed by a compound process as ex-pressed in equation (1):
where xt is the portion of Xt that reflects the events that also affect Pt, called undistorted earnings; εt is white noise, known as distorted earnings, which represents the impact of Xt on adjustments or events that do not affect Pt.
Kothari (1992) and Kothari and Zimmerman (1995) argue that when Pt is informationally richer, the variation of Xt is composed of a portion (at, t-1, ..., a,t, t-n) that was pre-viously incorporated by Pt-1... Pt-n and by a random portion that represents a market surprise (st). It is with this ran-dom portion that a contemporaneous relationship could be found.
Extending this idea to the compound process shown in equation (1), it is possible to assume that
where at,t-n is the portion of Xt (first subscript t=year to whi-ch X refers) anticipated by the market in period t-n (second subscript).
The portion xt is not observable, therefore, st and cannot be isolated or measured. However, accor-ding to Beaver et al. (1980), Xt offers a distorted measure of xt due to the existence of εt, and therefore, Xt measures variations of Pt with error.
It is noteworthy, however, that apart from the effects of this distortion, the informational dynamic between
Xt and Pt imposes problems on the contemporary
rela-tionship between these variables. As only the portion st correlates with variations in Pt, because is ir-relevant to the explanation of these variations, and as Pt anticipates information that will only be expressed in future earnings — variables omitted in the traditional model and uncorrelated with st — the eco-nometric consequences noted by Beaver et al. (1980) are exacerbated. This result is demonstrated by the low explanatory power offered by the traditional model of the price-earnings ratio and the low magnitude and bias of the response coefficient of Xt (Lev, 1989; Kothari & Zimmerman, 1995; Kothari, 2001).
Collins et al. (1994) found that the relationship between Pt and Xt has poor timeliness and identified that the infor-mational untimeliness of Xt is the main determinant of this phenomenon. The authors found that future variations of Xt were able to explain the current variations of Pt, i.e., Pt anticipated the portion .
Basu (1997) found that Xt is asymmetrically timely in relation to bad news signaled by negative changes in Pt, a finding that introduces additional aspects to the subject Xt = xt + εt 1
xt = st + α
Σ
N t, t-n \ 2an=1
Xt = st + α
Σ
N t, t-n + εt 2bn=1
Σ
Nn=1αt, t-n
Σ
Nn=1αt, t-n
Σ
Nn=1αt, t+n
Σ
Ncause it shows the effect of accounting conservatism on the informational portion st. This fact tends to exacerbate the problems of the poor timeliness between Xt and Pt because it indicates that as well as being reduced, timeliness is appa-rently also incomplete and skewed.
Another line of research has been exploring the in-fluence of other aspects on the prices lead earnings phe-nomenon, such as ownership structure, investor charac-teristics, analyst coverage, governance structure, level of long-term investments, goods produced and size, which have increased the understanding of the topic. In gene-ral, studies have shown that these factors affect the in-formational non-synchronization of Xt and Pt (Ayers & Freeman, 2000, 2003; Jiambalvo, Rajgopal, & Venkata-chalam, 2002; Lee, 2007).
Along the same line, Ayers and Freeman (2000) studied the association between firm size and the timing of returns relative to the average variation in sectoral annual earnings and the variation in firm-specific annual earnings. A po-sitive association was found between size and the degree of anticipation of future earnings for both analyzed varia-tions. Moreover, the results also suggested that the stock prices of large firms anticipate information that affects the entire industry, so their returns can anticipate a portion of the small firms’ returns.
Jiambalvo, Rajgopal and Venkatachalam (2002) and Ayers and Freeman (2003) found a positive association between the institutional ownership percentage in fir-ms' ownership structures and the prices lead earnings phenomenon. For Jiambalvo, Rajgopal and Venkata-chalam (2002), this association occurs because institu-tional investors are more sophisticated and have advan-tages in acquiring and processing information that are only reflected in future earnings, which would impose lower informational synchronization as these investors' ownership increases.
Ayers and Freeman (2003) also evaluated the influence of analyst coverage on the degree of anticipation of future earnings displayed in stock prices. As observed for insti-tutional investors, the results for analyst coverage showed a positive association. In addition, Ayers and Freeman (2003) found that such factors are incremental to each other in this association and their influence on the degree of anticipation is independent of firm size.
Lee (2007), in turn, presented evidence to suggest that operational (durability of products produced) and market (product power in the market) characteristics are positively associated with the anticipated recogni-tion of future earnings, while the level of investment in long-term assets is negatively associated with this anticipation.
Another interesting study is that of Truong (2012), which explores the relationship between options tra-ding and the extent to which prices anticipate future earnings. Truong (2012) found that the stock prices of firms with listed options anticipate more informa-tion about future earnings. In addiinforma-tion, a positive re-lationship was identified between the options trading
volume and this anticipation. Another result reported was that among firms with listed options, stock prices in the post-listing period reflected better and faster in-formation about future earnings than those in the pre-listing period.
In Brazil, the studies are still preliminary. For exam-ple, Galdi and Lopes (2008) and Pimentel and Lima (2010) obtained evidence of a long-term relationship between accounting earnings and stock prices. In addi-tion, among the firms analyzed, they observed a greater number of occurrences where stock price anticipated information contained in the accounting earnings, at least at a timing equal to -1. According to Galdi and Lopes (2008), the latter finding is somewhat expected considering the informational untimeliness of accoun-ting earnings.
Sales (2011) obtained results indicating that the market anticipates information contained in Xt, pricing stock du-ring the period to which it relates and after the closure of the same. This result is consistent with the findings of San-tos and LusSan-tosa (2010). Sales (2011) also found evidence of the existence of a lead-lag type structure between the varia-tions in Pt and Xt, which according to the author suggested that future earnings can explain part of the variation in Pt that is not explained by Xt. However, notwithstanding the functional relationship employed, from a time perspective, what is observed is that Pt may explain part of future ear-nings and not the reverse.
Paulo, Sarlo Neto and Santos (2012), assuming the prices lead earnings hypothesis and the asymmetric timeliness evidenced by Basu (1997) as an underlying idea, studied within the context of the Brazilian stock
market the informational content expressed by Xt when
disclosed. The results indicated that Pt only showed abnormally significant variations in response to bad news; this result is aligned with the perception of in-formation asymmetry for st.
2.2 Hypotheses.
Based on the theoretical assumptions and empirical evidence presented and discussed in the previous sec-tion, it is possible to conclude that the primary effect of the informational superiority of Pt due to its ability to quickly incorporate the relevant events that will only be reflected in future variations of Xt, the essence of the prices lead earnings hypothesis is poor or even a lack of timeliness between these variables. Thus, finding the existence of timings above zero may confirm this hypo-thesis in the Brazilian market. The following research hypotheses were therefore formalized:
H0a: The relationship between the quarterly stock re-turns and the quarterly accounting earnings of publicly traded Brazilian firms is not contemporaneous.
H0b: The quarterly stock returns of publicly traded Bra-zilian firms anticipate information regarding future quar-terly earnings.
H0c: The timing of the return-earnings relationship of pu-blicly traded Brazilian firms is greater than or equal to 1.
Σ
N3 METHODOLOGY
3.1 Data.
The empirical analysis included the quarterly data of non-financial firms listed on the São Paulo Stock Ex-change (Bolsa de Valores de São Paulo - Bovespa) for the period between 03/1999 and 03/2012. Only those firms presenting financial statements for that period, for the quarters ended 03/31, 06/30, 09/30 and 12/31 and for which the stock price was available on these dates or the day immediately after were included in the study sample. The final sample consisted of 205 firms and resulted in panel data consisting of 8,440 firm-quarters. All data were obtained from the Economática database.
The accounting variables earnings per share (EPS) and book value of equity per share (BVPS) were used, which served as a control for the effect of firm size. Both varia-bles were deflated by the stock price at the beginning of the period (end of the previous period). The EPS growth rate, referred to here as EPSGR, was determined by the natural logarithm of the difference between the EPS in two conse-cutive periods [ln(EPSit/EPSit-1)].
The stock price return was also calculated logarith-mically. The stock price was adjusted by earnings accor-ding to criteria adopted by Economática. When possible, preferred stocks were selected because of their greater liquidity.
As detailed below, the study was conducted in two stages, with the use of four econometric models, which required the use of two sets of variables. Observations located in the first and last percentiles of each variable series were excluded to minimize the econometric effect of outliers on the model results. This process resulted in a final sample of 4,177 firm quarters for the first group of variables and 3,321 for the second.
3.2 The Model.
Basically, the three functional relationships represented below were explored:
For all of these relationships, the respective eco-nometric models were estimated using pooled regres-sions and panel data. To evaluate the suitability of po-oled regression, the indication of a structural break in the model was considered at a significance level of at least 10% using the Chow test. Where a break exists (the alternative hypothesis of the test), the use of pa-nel data is recommended. The choice of the appro-priate modeling type for the panel, i.e., fixed effects or random effects models, was based on the Hausman test, the null hypothesis of which indicates the
5
Stock Return = f (Accounting Earnings, Stock Rett+1, Stock Rett+2, Stock Rett+3)
tence of random effect components in the estimated multivariate relationship.
The econometric models employed were based on Beaver et al. (1980) — model (6) — and Collins et al. (1994) — models (7), (8) and (9). In these studies, va-riations of EPS were used; therefore, the EPSGR variable was used herein. However, EPSit/pit-1 was used because of its superiority in the presence of prices lead earnings, as highlighted by Kothari (1992). Furthermore, the model estimates using these two variables offer additional op-portunities to evaluate the adequacy of these proxies for accounting earnings on the return-earnings (earnings-return) relationship in Brazil.
The functional relationship (3) was estimated using econometric model (6), below, which is based on Be-aver et al. (1980). This model is also known as the in-verted or reverse regression model, so called because it reverses the traditional relationship in which stock returns (change in price p) are a function of the
va-riation in earnings per share (ΔEPS). Two estimations
were performed where the dependent variables were EPSit/pit-1 and EPSGRit.
where
Xit = EPSit/pit-1 or EPSGRit.
EPSit = earnings per share of firm i in quarter t pit-1 = stock price of firm i at the end of quarter t-1
EPSGRit = EPSit growth rate, obtained by the natural logari-thm of the difference between EPSs in t and t-1
Rit = logarithmic return of the stock of firm i in quarter t (t-1...t-8)
BVPSit = book value of equity per share of firm i in quarter t; used as a proxy for size for control purposes
If the variations in the stock price express informa-tion that only reflects future earnings, it is likely that past returns are linked to current accounting earnings. To evaluate this aspect, quarterly returns were used that were both contemporaneous to earnings and lagged by 1 to 4, 6 and 8 quarters, aiming to analyze the informa-tional relationship of the immediately preceding quar-ter up to a two-year lag. It is assumed, therefore, that investor expectations about future earnings are eva-luated in response to the new information brought by quarterly earnings and revised and incorporated into prices in the short and medium terms. If, therefore, the prices lead earnings hypothesis is true in Brazil, it may be expected that β1 is not significant or else has low magnitude, depending on the representativeness of st. The relationships of the other coefficients to the lagged returns are expected to prove to be positive and signi-ficant. These results will specifically allow hypothesis H0b to be operationally tested and will provide input that together with the other models will allow hypothe-sis H0c to be tested.
Establishing the same reasoning above, although from Accounting Earnings = f (Stock Return) 3
Stock Return = f (Accounting Earnings) 4
Xit= β0+ β
Σ
4 k+1Rit-k+ β6Rit-6+ β7Rit-8 +β8 + εit 6k=0
the perspective of accounting earnings, it is possible to as-sume that current earnings respond in an untimely fashion to the current returns. Thus, assuming a traditional func-tional relationship between returns and earnings, adding earnings for subsequent periods would offer a better level of explanation of this relationship. Based on this notion, the functional relationship (4) was explored by means of the econometric models below:
Rit= β0+ β1Xit+ β2 + εBVPSit it 7
pit-1
Rit= β0+ βk+1Xit+k+ β5 + εBVPSit it 8
pit-1
Σ
3k=0
where Xit assumes EPSit/pit-1 or EPSGRit in the respective esti-mations. Model (7) is the traditionally studied relationship (Ko-thari, 2001) and model (8) is based on Collins et al. (1994).
However, as the informational portions of Xt and Xt+k that are already anticipated by past prices and , would not be correlated with Rt, there are mea-surement errors in the model for the coefficients of Xt and Xt+k, the extent of which depends on the deviation
Σ
Nn=1 αt, t-n
Σ
Nn=1 αt+k, t-n
Σ
N
n=1αt+k, t+n
of price variations associated with the expectations in t. In the specific case of Xt+k, there is an additional sour-ce of error arising from the informational portion not anticipated by Rt, which will only be reflected in future returns, (Collins et al. 1994; Kothari, 2001). To mitigate some of the effects of these measurement er-rors related to Xt+k, future stock returns were used (Rt+1, Rt+2 and Rt+3), as proposed by Collins et al. (1994).
The following model was therefore used, operationali-zing the functional relationship (5):
It should be stressed that the significance test of the coefficient β1, especially in model (7), represents the primary operational test of hypothesis H0a because if β1 is significantly different from zero, signs of timeliness will be obtained and therefore this hypothesis would be rejected. Furthermore, it should be noted that the re-sults obtained with models (7), (8) and (9) will also be required for the proper evaluation of the propositions contained in hypotheses H0b and H0c.
Rit= β0+ βk+1Xit+k+ βk+4 Rit+k +β8 +εBVPSit it 9
pit-1
Σ
3k=0
Σ
3
k=1
4 ANALYSIS OF RESULTS
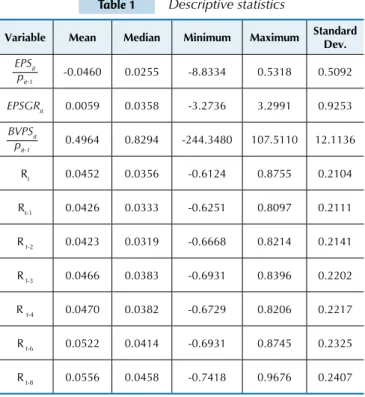
The descriptive statistics of the group of variables used in the first step of the analysis and their correlation matrix are shown in Tables 1 and 2, respectively. After excluding the outliers that were included in the first and last percen-tiles of the series of each variable, with the exception of the control variable, the initial sample was reduced to 4,177 observations.
Table 1 Descriptive statistics
Variable Mean Median Minimum Maximum Standard
Dev.
-0.0460 0.0255 -8.8334 0.5318 0.5092
EPSGRit 0.0059 0.0358 -3.2736 3.2991 0.9253
0.4964 0.8294 -244.3480 107.5110 12.1136
Rt 0.0452 0.0356 -0.6124 0.8755 0.2104
Rt-1 0.0426 0.0333 -0.6251 0.8097 0.2111
R t-2 0.0423 0.0319 -0.6668 0.8214 0.2141
R t-3 0.0466 0.0383 -0.6931 0.8396 0.2202
R t-4 0.0470 0.0382 -0.6729 0.8206 0.2217
R t-6 0.0522 0.0414 -0.6931 0.8745 0.2325
R t-8 0.0556 0.0458 -0.7418 0.9676 0.2407
EPSitis earnings per share of irm i in quarter t. pit-1is the stock price of irm i at the end of quarter t-1.
EPSGRit is the EPSitgrowth rate, obtained by the natural logarithm of the
difference between EPSs in t and t-1.
Ritis the logarithmic return of the stock of irm i in quarter t (t-1...t-8). BVPSitis the book value of equity per share of irm i in quarter t and is used as a proxy for size for control purposes.
BVPSit
pit-1 EPSit
pit-1
In the first subset of data, the variables representing ac-counting earnings have very different characteristics, whi-ch is to be expected given the means by whiwhi-ch eawhi-ch variable was calculated. It can be observed that the series EPSit/pit-1, despite having greater amplitude, has a lower standard de-viation and a lower coefficient of variation (11.07 versus 156.83) than EPSGRit. That difference indicates a certain superiority for this variable because its series exhibits less variability. With regard to returns, there is an apparent si-milarity in the statistics for these two variables. However, it is interesting to note that there is an almost monotonic increase for all variables as their lags increase, in particular in periods t-6 and, especially, t-8. This possibly shows the influence of the returns of previous periods that were not attained by other series (t, ..., t-4).
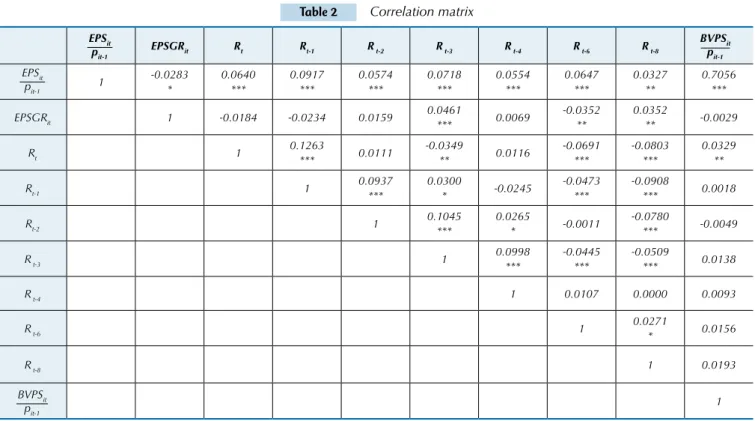
Table 2 Correlation matrix
EPSGRit Rt Rt-1 R t-2 R t-3 R t-4 R t-6 R t-8
1 -0.0283
*
0.0640 ***
0.0917 ***
0.0574 ***
0.0718 ***
0.0554 ***
0.0647 ***
0.0327 **
0.7056 ***
EPSGRit 1 -0.0184 -0.0234 0.0159 0.0461
*** 0.0069
-0.0352 **
0.0352
** -0.0029
Rt 1 0.1263
*** 0.0111
-0.0349
** 0.0116
-0.0691 ***
-0.0803 ***
0.0329 **
Rt-1 1 0.0937
***
0.0300
* -0.0245
-0.0473 ***
-0.0908
*** 0.0018
Rt-2 1 0.1045
***
0.0265
* -0.0011
-0.0780
*** -0.0049
R t-3 1 0.0998
***
-0.0445 ***
-0.0509
*** 0.0138
R t-4 1 0.0107 0.0000 0.0093
R t-6 1 0.0271
* 0.0156
R t-8 1 0.0193
1
*, ** and *** represent signiicance at the 10%, 5% and 1% levels, respectively.
BVPSit
pit-1
EPSit pit-1
BVPSit pit-1
EPSit pit-1
The first relationship examined was that proposed by model (6), where the variable representing accounting
ear-Table 3 Model (6) results
Coeficients
Xit
EPSGRit
β0
-0.0785 (-15.7777)***
0.0006 (0.0364)
β1
0.0369
(1.7850)*
-0.0596
(-0.8658)
β2
0.1499
(7.2805)***
-0.1003 (-1.4568)
β3
0.0614
(3.0427)***
0.0702
(1.0391)
β4
0.0818
(4.1406)***
0.1877
(2.8528)***
β5
0.0651
(3.3707)***
0.0083
(0.1281)
β6
0.0601
(3.2354)***
-0.1441
(-2.3344)**
β7
0.0346
(1.9238)*
0.1409
(2.3483)**
β8
0.0200
(18.4664)***
-0.0002
(-0.2039)
Panel modeling Fixed Effects Random Effects
Chow Test 18.6574*** 2.2795*
Hausman Test 47.4286*** 5.27543
Breusch-Pagan Test 24.0171***
Adjusted R2 73.47% 0.38%
F 52.57603***
-Number of observations: 4,177. Outliers corresponding to the irst and last percentiles of each variable series were excluded, with the exception of the con -trol variable. Xit is the dependent variable of the model. Two estimations were performed, one in which Xit was assumed to be EPSit/pit-1 and another where
Xit was EPSGRit. The t-statistic is shown in parentheses below the relevant coeficient.
*, ** and *** represent significance at the 10%, 5% and 1% levels, respectively.
Xit= β0+ βk+1Rit-k+ β6 Rit-6+ β7 Rit-8+ β8 + εBVPSit it
pt-1
Σ
4k=0
EPSit pit-1
In both models, the results reveal a weak or nonexistent relationship between the contemporaneous returns and ac-counting earnings, indicating the low informational repre-sentativeness of the portion st. However, the results indicate that there is a significant level of association if the returns from previous periods are considered.
The estimation involving EPSGRit indicates that the returns for quarters -3 (β4), -6 (β6) and -8 (β8) exhibit a significant relationship with this variable. An apparent response pattern was not, however, observed as expected. The intermittency in the quarters and the different signs of the coefficients cannot be explained in general terms, with the exception of the hypothesis that the variable EPSGRit is unrepresentative of the relationship studied here. This lack of representativeness is suggested by the low or nonexistent correlation with returns (Table 2), and it contributes to the low explanatory power of the model (Adjusted R2 equal to 0.38%2).
Conversely, in the estimation with the dependent va-riable EPSit/pit-1, there is explanatory power of over 70%, and a response pattern consistent with the theory can be observed. The returns for periods -1 to -6 have positive and highly significant coefficients, the values of which
2 Although inappropriate, the estimation was performed using the ixed effects model, and the adjusted R2
was found to be equal to -1.83%. This result indicates that the low explanatory power was not caused by the estimation technique used, which corroborates the inding of the low explanatory power offered by EPSGR.
Table 4 Descriptive statistics
Variable Mean Median Minimum Maximum Standard Deviation
Rt 0.0658 0.0568 -0.6668 0.8881 0.2155
-0.0767 0.0316 -11.4879 0.5131 0.7829
-0.0807 0.0306 -11.5601 0.4714 0.7851
-0.0909 0.0298 -16.7955 0.4116 0.8518
-0.09101 0.0285 -16.7955 0.3612 0.8704
EPSGRit 0.0464 0.0565 -2.7939 2.9545 0.7429
EPSGRt+1 0.0360 0.0503 -2.7324 2.8491 0.7113
EPSGRt+2 0.0363 0.0537 -2.7657 2.6974 0.7007
EPSGRt+3 0.0014 0.0382 -2.9108 2.7131 0.7312
Rt+1 0.0563 0.0455 -0.6497 0.8214 0.2065
R t+2 0.0460 0.0375 -0.6497 0.8097 0.2030
R t+3 0.0394 0.0356 -0.6493 0.7691 0.1988 -0.6774 0.7887 -490.6530 92.4912 21.4974
EPSit is earnings per share of irm i in quarter t (t+1, t+2, t+3).
pit is the stock price of irm i at the end of quarter t (t-1, t+2, t+3).
EPSGRit is the EPSit growth rate, obtained by the natural logarithm of the difference between EPSs in t and t-1.
Rit is the logarithmic return of the stock of irm i in quarter t (t-8... t-1, ..., t+1 ... t+3).
BVPSit is the book value of equity per share of irm i in quarter t and is used as a proxy for size for control purposes.
show an increasing trend as the lags decrease. This result suggests that the information expressed in current ac-counting earnings was already being anticipated by the stock price at least six months previously, which is con-sistent with the prices lead earnings hypothesis. In light of the results, it can be assumed that approximately 6% of the variations in the return of period -6, for example, are related to variations in current accounting earnings and likewise for the following periods until period -1, where there would be an approximately 15% association between the variables in question. This perception is reinforced by the linear movements of returns and ac-counting earnings, signaled by the significant level of correlation observed (Table 2). These results, in general, are consistent with those obtained by Galdi and Lopes (2008) and Sales (2011).
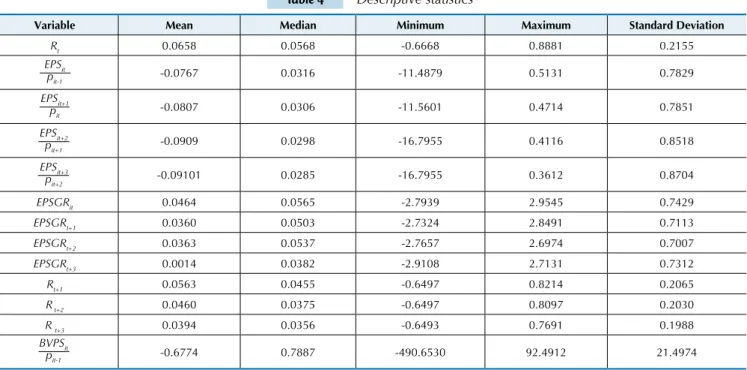
In the second stage of the study, the returns contem-poraneous with stock price were estimated on the basis of accounting earnings and the future returns of that price, so a new subset of variables was employed. The exclusion of outliers resulted in a total of 3,321 obser-vations. Table 4 shows the descriptive statistics of these variables.
EPSit pit-1
EPSit+1 pit
EPSit+2 pit+1
EPSit+3 pit+2
BVPSit
pit-1
The series of returns comprising this second data subset show behavior similar to that shown in Table 1, i.e., the descriptive statistics increase as the lags in-crease. Here it can be observed, for example, that Rt+3 has a mean and a standard deviation lower than those exhibited by Rt. This behavior is also observed for the mean values of the series of variables representing ac-counting earnings but is not observed for the
respec-tive standard deviations; there is a reverse trend for EPSit+k/pit+1, and it is not is possible to determine a pat-tern for EPSGRit+k.
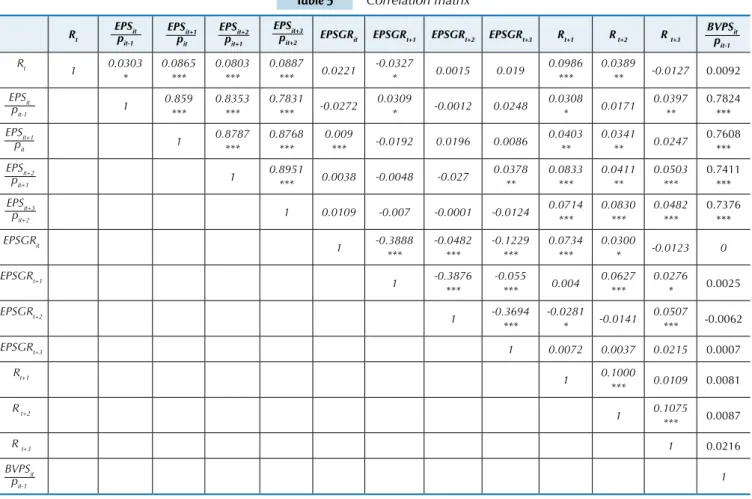
of past, current and future returns. In fact, it appears that
EPSit+k/pit-(1-k) displays a reverse behavior. Moreover, it can be
observed that the correlations between this variable and past returns appear to be higher than those for the current and future periods. For example, the correlation of earnings in t+1 with returns in t is greater than those with returns in
t+1, t+2 and t+3. Likewise, this relationship occurs for the earnings in t+2 because the correlations with the returns in t and t +1 are higher than those observed for periods t+2 and t+3 and higher than earnings in t+3. This finding suggests that some of the movements for earnings have been "antici-pated" by price variations at least a quarter in advance.
Table 5 Correlation matrix
Rt EPSGRit EPSGRt+1 EPSGRt+2 EPSGRt+3 Rt+1 R t+2 R t+3
Rt 1 0.0303 * 0.0865 *** 0.0803 *** 0.0887 *** 0.0221 -0.0327
* 0.0015 0.019
0.0986 ***
0.0389
** -0.0127 0.0092
1 0.859 *** 0.8353 *** 0.7831 *** -0.0272 0.0309
* -0.0012 0.0248
0.0308 * 0.0171 0.0397 ** 0.7824 *** 1 0.8787 *** 0.8768 *** 0.009
*** -0.0192 0.0196 0.0086
0.0403 ** 0.0341 ** 0.0247 0.7608 *** 1 0.8951
*** 0.0038 -0.0048 -0.027
0.0378 ** 0.0833 *** 0.0411 ** 0.0503 *** 0.7411 ***
1 0.0109 -0.007 -0.0001 -0.0124 0.0714
*** 0.0830 *** 0.0482 *** 0.7376 *** EPSGRit 1 -0.3888 *** -0.0482 *** -0.1229 *** 0.0734 *** 0.0300
* -0.0123 0
EPSGRt+1 1 -0.3876 *** -0.055 *** 0.004 0.0627 *** 0.0276 * 0.0025 EPSGRt+2 1 -0.3694 *** -0.0281 * -0.0141 0.0507 *** -0.0062
EPSGRt+3 1 0.0072 0.0037 0.0215 0.0007
Rt+1
1 0.1000
*** 0.0109 0.0081
R t+2
1 0.1075
*** 0.0087
R t+3 1 0.0216
1
*, ** and *** represent signiicance at the 10%, 5% and 1% levels, respectively.
BVPSit pit-1 EPSit pit-1 EPSit+1 pit EPSit+2 pit+1 EPSit+3 pit+2 BVPSit pit-1 EPSit
pit-1 EPSpitit+1
EPSit+2 pit+1
EPSit+3 pit+2
For model (7), satisfactory adjustments (highly signifi-cant F statistics) and acceptable explanatory power for the
association studied can be observed in both estimations as shown in Table 6.
Table 6 Model (7) results
Coeficients Xit EPSGRit β0 0.0640 (17.0800)*** 0.0649 (17.5682)*** β1 -0.0183 (-1.6860)* 0.0050 (0.9860) β2 -0.0006 (-1.2180) -0.0010 (-2.3093)**
Panel modeling Fixed Effects Fixed Effects
Chow Test 3.0406** 5.4102**
Hausman Test 14.8883*** 7.2134***
Adjusted R2 3.33% 3.27%
F 1.5862*** 1.5757***
Number of observations: 3,321. Outliers corresponding to the irst and last percentiles of each variable series were excluded with the exception of the
control variable. Xit is one of the independent variables of the model. Two estimations were performed, one in which Xit was assumed to be EPSit/pit-1 and another in which Xit was EPSGRit. The t statistic is shown in parentheses below the relevant coeficient.
*, ** and *** represent signiicance at the 10%, 5% and 1% levels, respectively.
EPSit pit-1
Rit= β0+ β1Xit+ β2 + εBVPSit it
Current accounting earnings were not significant, whi-ch is consistent with the results obtained with model (6) and is thus consistent with the prices lead earnings hypo-thesis. Moreover, these results are consistent with Collins et al.'s (1994) findings, which were achieved using a similar model estimated based on pooled data.
The inclusion of earnings from future periods in the relationship above generated random effects in the
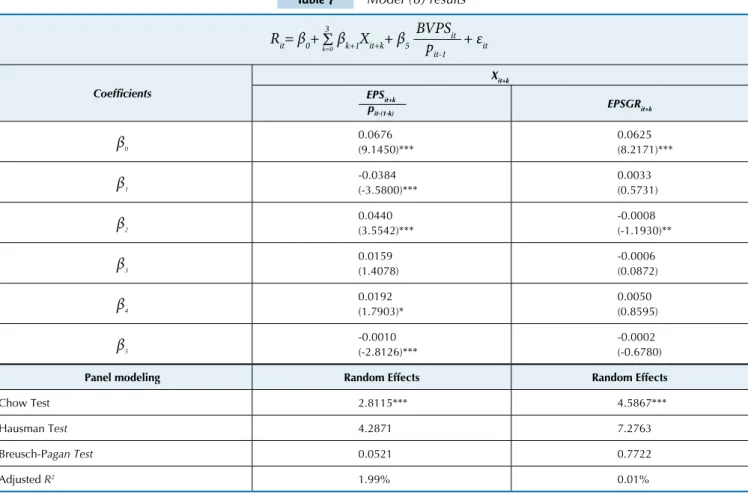
Table 7 Model (8) results
Coeficients
Xit+k
EPSGRit+k
β0
0.0676 (9.1450)***
0.0625 (8.2171)***
β1
-0.0384 (-3.5800)***
0.0033 (0.5731)
β2
0.0440 (3.5542)***
-0.0008 (-1.1930)**
β3
0.0159 (1.4078)
-0.0006 (0.0872)
β4
0.0192 (1.7903)*
0.0050 (0.8595)
β5
-0.0010 (-2.8126)***
-0.0002 (-0.6780)
Panel modeling Random Effects Random Effects
Chow Test 2.8115*** 4.5867***
Hausman Test 4.2871 7.2763
Breusch-Pagan Test 0.0521 0.7722
Adjusted R2 1.99% 0.01%
Number of observations: 3,321. Outliers corresponding to the irst and last percentiles of each variable series were excluded with the exception of the
control variable. Xit is one of the independent variables of the model. Two estimations were performed, one in which Xit was assumed to be EPSit+k/pit-(1-k) and another in which Xit was EPSGRit. The t statistic is shown in parentheses below the relevant coeficient.
*, ** and *** represent signiicance at the 10%, 5% and 1% levels, respectively.
EPSit+k pit-(1-k)
Rit= β0+ βk+1Xit+k+ β5 + εBVPSit it
pit-1
Σ
3k=0
established multivariate relationship, as verified using the Hausman test (not significant), which required the estimation of the regressions using the random effects model. This result may indicate that the fixed effects identified in model (5) were generated by the omission of these variables because these are significantly cor-related with current earnings and equity, as shown in Table 5.
A premise underlying this study is that the current va-riations in stock price capture information that will only be reflected in future earnings, so the inclusion of these would increase the explanatory power already verified by model (7). However, as shown in Table 7, the explanatory power did not increase. Instead, the adjusted R2 of the estimates
decreased. However, it is true that the included variables correlate with those already used, which tends to reduce their effect on the explanatory power. Moreover, the diffe-rence between the techniques used to estimate the models must be considered in this comparison.
One interesting aspect is the significance of coefficient β1 relative to variable EPSit/pit-1. Alone, this variable was not significant in relation to Rt; however, the inclusion of future variations allowed for the establishment of such significan-ce. This result suggests that variations in current earnings are only associated with variations in Rt when combined with the variations from the following periods, i.e., when
the econometric effects of these variations are eliminated from the current earnings. One possible explanation for this finding may be the linear behavior of these variables. According to Table 5, the current earnings show a correla-tion of 0.0303 with Rt (significant only at 10%), while they are correlated with the earnings of the following periods (t+1, t+2 and t+3) at highly significant levels and with coe-fficients above 0.78. The earnings of the following periods, in turn, also have a highly significant correlation with Rt, the coefficients of which are greater than 0.08. However, it is intriguing that the earnings in t+2 and t+3 have also not been shown to be significant.
earnings in t+1. This result is in keeping with the pri-ces lead earnings notion, but does not represent robust empirical evidence.
These findings can be attributed to measurement er-rors for these variables. As mentioned in the previous sec-tion, these variables have informational portions that do not correlate with the current return, but do with the past
Table 8 Model (9) results
Coeficients
Xit+k
EPSGRit+k
β0 0.0681 (16.5422)*** 0.0642 (16.0316)***
β1
-0.0379 (3.2902)***
0.0018 (0.3102)
β2
0.0407 (3.1436)***
-0.0072 (-1.0394)
β3
0.0132 (1.1388)
0.0008 (0.1134)
β4
0.0220 (1.8280)*
0.0050 (0.8325)***
β5
0.0435 (2.3450)**
0.0083 (0.1281)
β6
-0.0070 (-0.3701)
-0.1441 (-2.3344)**
β7
-0.0329 (-1.6989)*
0.1409 (2.3483)**
β8
-0.0007 (1.3881)
-0.0002 (-0.2039)
Panel modeling Fixed Effects Fixed Effects
Chow Test 4.9077*** 5.7257***
Hausman Test 47.9602*** 55.5329***
Adjusted R2 4.53% 3.51%
F 1.7845*** 1.6006***
Number of observations: 3,321. Outliers corresponding to the irst and last percentiles of each variable series were excluded, with the exception of the
control variable. Xit is one of the independent variables of the model. Two estimations were performed, one in which Xit was assumed to be EPSit/pit-1 and another in which Xit was EPSGRit. The t statistic is shown in parentheses below the relevant coeficient.
*, ** and *** represent signiicance at the 10%, 5% and 1% levels, respectively.
EPSit+k pit-(1-k)
Rit= β0+ βk+1Xit+k+ βk+4 Rit+k +β8 +εBVPSit it
pit-1
Σ
3k=0
Σ
3
k=1
returns and, in the case of future earnings, also with the contemporaneous returns (future). These errors cause bia-ses in the estimators and affect the explanatory power of the models because these informational portions represent omitted variables. The inclusion of future returns tends to mitigate some of these problems. Model (9) contemplates that alternative.
The results suggest that the inclusion of future returns reduced some of the problems displayed by model (8). It is clear, first, that there is no longer an indication of the presence of random effects in the model. The explanatory power of the estimates was significantly improved, from 1.99% to 4.53% and from 0.01% to 3.51%. The significance of the coefficients was virtually unchanged. It is important to note that of the returns included, Rt+1 exhibited a signi-ficant coefficient in relation to EPSit+k/pit-(1-k) and Rt+2 and Rt+3 in the estimation involving the variable EPSGR. Still regarding this estimation, the variable EPSGRt+3 also began to show a significant coefficient.
These results suggest that it is not possible to rule out a contemporary relationship, but it would only be incremental relative to the earnings of future periods. In addition, future returns may enhance the explanatory power of the model, a finding in keeping with the assumptions made in this study.
Table 9 Model results (7) - Further analysis
Variables
Estimations
(a) (b) (c) (d) (e) (f)
Coeficients
Constant 0.0613 (15.7900)***
0.0646 (16.4900)***
0.0642 (16.2700)***
0.0653 (16.4800)***
0.0657 (16.6200)***
0.0666 (16.7300)*** -0.0181
(-1.6700)*
-0.0354 (-3.1410)***
-0.0306 (-2.7090)***
-0.0246 (-2.2610)**
-0.0400 (-3.4810)***
-0.0379 (-3.2860)*** 0.0595
(5.2530)***
0.0503 (4.1440)***
0.0423 (3.2740)*** 0.0378
(3.8270)***
0.0219 (2.0680)**
0.0131 (1.1290) 0.0447
4.6380)***
0.0216 (1.8200)*
Rt+1 0.0491
(2.6520)***
0.0489 (2.6550)***
0.0423 (2.2800)***
0.0440 (2.3810)**
0.0450 (2.4320)**
0.0442 (2.3850)** -0.0005
(-1.1080)
-0.0009 (-1.8380)*
-0.0005 (-0.9982)
-0.0003 (-0.5711)
-0.0008 (-1.6550)*
-0.0006 (-1.3040) Hausman Test 50.6856*** 42.8122*** 43.0311*** 38.8427*** 41.7925*** 42.2857*** Adjusted R2 3.52% 4.33% 3.93% 4.14% 4.43% 4.50% F 1.6171*** 1.7626*** 1.6903*** 1.7287*** 1.7772*** 1.7862***
Number of observations: 3,321. Outliers corresponding to the irst and last percentiles of each variable series were excluded with the exception of the con -trol variable. The estimations were performed using the ixed effects model. The t statistic is shown in parentheses below the relevant coeficient. *, ** and *** represent signiicance at the 10%, 5% and 1% levels, respectively.
EPSit pit-1
EPSit+1 pit
EPSit+2 pit+1
EPSit+3 pit+2
BVPSit
pit-1
The results confirm that the contemporary relationship between earnings and returns is only revealed when future earnings are considered in the estimation. The relationship was clear with the inclusion of earnings in t+1, t+2 and t+3, alone or pooled. It also appears that the explanatory power of the model increased almost monotonically with the gra-dual inclusion of these variables, increasing from 3.52% to 4.50%. Rt+1 proved to be significant in all estimations and played an important role because its inclusion generated fixed cross-components, thus requiring estimation by the fixed effects model. The control level of the firms' idiosyn-crasy also contributed to the improvement of the explana-tory power of the estimates, as was observed in simulations without this variable.
Despite the significance of current earnings observed in models (6) and (7) and in the final estimates, the de-pendency on earnings in the following periods apparently weakens the evidence of their timeliness with Rt. However, it can be observed that there is an informational portion contained in current earnings that is contemporaneous to Rt but that can only be obtained after eliminating the effects of the earnings from the following periods on this portion. This finding is consistent with Kothari (1992) and Kothari and Zimmerman (1995) because it demons-trates the st portion, which represents the portion of cur-rent earnings that is a surprise to the market and therefore correlated with Rt.
It is interesting to note that in addition to the significan-ce of the current earnings coefficient, its increase in magni-tude (in absolute terms) can also be observed in all
estima-tions, suggesting that the effects of st on Rt are representative but obscured by the omission of the portion. The indication of a negative relationship contradicts the theory; however, it is possible that the relationship could be explained by the effects of conservatism, which impose a bias with respect to bad news about st. This explanation is in keeping with the results obtained by Paulo, Sarlo Neto and Santos (2012).
Another aspect that should be considered in the present analysis is the possible effect on the return-earnings rela-tionship of the recent adoption of international accounting standards in Brazil. The evidence gathered in this regard indicates that the associative capacity of accounting ear-nings should have improved (Lima, 2010 Rodrigues, 2012). However, dimensions such as informational content, con-servatism, timeliness and persistence should not have been impacted by the adoption of a new set of accounting stan-dards (Lima, 2010, Rodrigues, 2012, Santos, Lima, Freitas, & Lima, 2011).
These results suggest that the adoption of international standards has generated residual effects on the timing of the return-earnings relationship, especially in light of the findings related to timeliness and conservatism. Moreover, despite the improvement of the associative capacity of ac-counting earnings, the findings obtained with models (7) and (8) show that an improvement in that capacity was not sufficient to eliminate non-timeliness. However, it should be noted that the time window analyzed here considers the periods pre and post adoption of those standards, which may obscure observation of their effects.
Σ
N5 FINAL CONSIDERATIONS
The present study aimed to identify the timing of the re-turn-earnings relationship in Brazil because it was assumed that this level is an indicator of the prices lead earnings hy-pothesis. The study was developed using four econometric models based on the proposals of Beaver et al. (1980) and Collins et al. (1994).
The results, in general, are consistent with the theoreti-cal assumptions explored herein because there is evidence that returns anticipate information about future earnings and that the representativeness of current earnings is resi-dual. The findings suggest that prices have informational content regarding future earnings, thereby indicating that the prices lead earnings phenomenon occurs in Brazil.
Specifically with regard to the research hypotheses, hy-pothesis H0a must be rejected because the results obtained with models (6) and (7) do not provide evidence for the contemporaneity of the return-earnings relationship, al-though the inclusion jointly or alone of future quarterly earnings in the estimation did reveal such timing. It is thus found that the elimination of the effects of future earnings on current earnings in measuring the association between the latter and the current returns elicited the informational representativeness of portion st.
The results obtained with the reverse regression, model (6), indicate that quarterly returns anticipate the informa-tion contained in future quarterly earnings, thus leading to the rejection of hypothesis H0b. It is worth noting that this anticipation would have occurred at least 8 quarters ago, a process that lasted until the quarter immediately preceding the current one. These results were consistent with those obtained with models (7) and (9) with respect to the asso-ciative capacity of future quarter earnings with the current return.
However, despite the empirical evidence mentioned above, it was not possible to determine the timing of the quarterly return-earnings relationship in Brazil be-cause if on one hand, past returns are associated with current earnings, on the other, the significance of futu-re earnings in explaining curfutu-rent futu-returns depends on the arrangement of the independent variables conside-red in the model. The evidence of timeliness between the returns and current earnings, even if dependent on the inclusion of future earnings, does not dispel the in-dication of a timing equal to zero, thus leading to the rejection of hypothesis H0c.
Furthermore, an additional finding refers to the supe-riority of variable EPSit/pit-1 compared to EPSGRit in terms of its representation of accounting earnings in the rela-tionships analyzed, which is consistent with the results pre-sented by Kothari (1992).
The findings in this study contribute to the national literature because they provide a greater understanding of the temporal aspects of the return-earnings rela-tionship in Brazil, which was hitherto relatively unex-plored from the perspective employed here. Further-more, the results indicate that it is possible to improve the models aimed at studying the associative capacity of current earnings using a methodological refine-ment, the inclusion of future earnings for at least one period, thus contributing to the advancement of rese-arch in the area. In a practical sense, the indication of the anticipative capacity of stock returns of Brazilian firms in relation to their future earnings suggests for investors, financial analysts, firms and creditors that the stock return may represent a useful informational source in their assessment of a firm's capacity to ge-nerate earnings. In addition, as the results presented here demonstrate to some extent the untimeliness of accounting earnings, they may be an indication, at least for investors, of a qualitative deficiency in accounting information. The results can also provide support for standard setters and regulators when assessing the use-fulness of the financial-accounting information that is disseminated in Brazil for those users and, ultimately, of the adequacy of the accounting standards observed. This study presents a number of methodological li-mitations, among them being a lack of the following: (i) a specific analysis of the properties of accounting earnings time series and their components, (ii) an effective assessment of the effects of the adoption of international standards; and (iii) a direct analysis of the influence of market factors, such as investor characte-ristics, the governance structure of firms, and analyst coverage, among others. However, each of these limi-tations, given the breadth of the empirical studies they would require and the complexity of the topic, offers interesting research avenues that should be explored to advance the understanding of the return-earnings re-lationship, a fundamental pillar of accounting research in capital markets.
Ayers, B. C., & Freeman, R. N. (2000). Why do large irms’ price antecipate earnings earlier than small irms´ price? Contemporary Accounting Research, 17 (2), 191-212.
Ayers, B. C., & Freeman, R. N. (2003). Evidence that analyst following and institutional ownership accelerate the pricing of future earnings.
Review of Accounting Studies, 8, 47-67.
Basu, S. (1997). he conservatism principle and the asymmetric timeliness of earnings. Journal of Accounting and Economics, 24 (1), 3-37. Beaver, W., Lambert, R., & Morse, D. (1980). he information content of
security prices. Journal of Accounting and Economics, 2 (1), 3-28.
Collins, D. W., Kothari, S. P., Shanken, J., & Sloan, R. G. (1994). Lack of timeliness and noise as explanations for the Low Contemporaneous Return-Earnings Association. Journal of Accounting and Economics, 18 (3), 289-324.
Galdi, F. G., & Lopes, A. B. (2008). Relação de longo prazo e causalidade entre o lucro contábil e o preço das ações: evidências do mercado latino-americano. Revista de Administração da USP, 43 (2), 186-201. Jiambalvo, J., Rajgopal, S., & Venkatachalam, M. (2002). Institutional
ownership and extent to which stocks prices relect future earnings.
Contemporary Accounting Research, 19 (1), 117-145
Kothari, S. P. (1992). Price-earnings regressions in the presence of prices lead earnings: earnings level versus change speciications and alternative delators. Journal of Accounting and Economics, 15 (2-3), 173-202.
Kothari, S. P. (2001). Capital markets research in accounting. Journal of
Accounting and Economics, 31 (1-3), 105-231.
Kothari, S. P., & Sloan, R. G. (1992). Information in price about future earnings: implications for earnings response coeicients. Journal of
Accounting and Economics, 15 (2-3), 143-171.
Kothari, S. P., & Zimmerman, J. L. (1995). Price and return models.
Journal of Accounting and Economics, 20 (2), 155-192.
Lee, J. J. (2007, August). Cross-sectional determinants of the extent to which stock prices earnings. Working paper: Hong Kong Baptist University. Recuperado em 1 fevereiro, 2013, de http://www.af.polyu. edu.hk/jcae_af/paper2008/concurrent/S.4a%20Lee.pdf.
Lev, B. (1989). On the usefulness of earnings and earning research: lessons and directions from two decades of empirical research. Journal of
Accounting Research, 27, 153-192.
Lima, J. B. N. (2010). A relevância da informação contábil e o processo
de convergência para as Normas IFRS no Brasil. Tese de doutorado,
Programa de Pós-Graduação em Ciências Contábeis, Departamento de Contabilidade e Atuária, Faculdade de Economia, Administração e Contabilidade da Universidade de São Paulo, São Paulo, SP, Brasil. Paulo, E., Sarlo Neto, A., & Santos, M. A. C. (2012). Reação do preço das
ações e intempestividade informacional do lucro contábil trimestral
no Brasil. Advances in Scientiic and Applied Accounting, 5 (1), 54-79. Pimentel, R. C., & Lima, I. S. (2010). Time-series properties of earnings
and their relationship with stock prices in Brazil. Business and
Economics Research Journal, 1 (4), 43-65.
Rodrigues, J. M. (2012). Convergência contábil internacional: uma análise da qualidade da informação contábil em razão da adoção dos padrões internacionais de contabilidade editados pelo IASB. Tese de doutorado, Programa Multi-institucional e Inter-regional de Pós-Graduação em Ciências Contábeis, UnB, UFPB, UFRN, Brasil. Sales, I. C. H. (2011). A dinâmica da relação entre os lucros contábeis
e os retornos acionários nas empresas brasileiras de capital aberto. Dissertação de mestrado, Programa Multi-institucional e Inter-Regional de Pós-Graduação em Ciências Contábeis UnB, UFPB, UFRN, Universidade de Brasília, Brasília, DF, Brasil.
Santos, L. P. G., Lima, G. A. S. F., Freitas; S. C., & Lima, I. S. (2011). Efeito da Lei 11.638/07 sobre o conservadorismo condicional das empresas listadas BM&FBOVESPA. Revista Contabilidade e Finanças – USP, São Paulo, 22 (56), 174-188.
Santos, M. A. C., & Lustosa, P. R. B. (2010). Importância relativa do conteúdo informacional do resultado contábil no mercado acionário brasileiro. Anais do Congresso USP de Controladoria e Contabilidade, São Paulo, SP, Brasil, 10.
Truong, C. (2012). Options trading and the extent that stock prices lead future earnings information. Journal of Business Finance &