Time-based Management Practices: A Study of Brazilian Companies
Reinaldo Guerreiro
Ph.D., Full Professor, Department of Accounting and Actuarial Science, School of Economics, Business Administration and Accounting, University of São Paulo E-mail: [email protected]
Dione Olesczuk Soutes
Ph.D., Department of Accounting Sciences, State University of West Paraná - Marechal Cândido Rondon Campus E-mail: [email protected]
Received on 10.31.2012 - Desk acceptance on 11.5.2012 - 4th version approved on 8.29.2013
ABSTRACT
This study seeks to answer the following question: To what extent do Brazilian industrial companies value Time-Based Management? This study aims to determine whether the companies surveyed formalized goals and articulated actions at the strategic and operational levels of supply, production and customer relations activities. This study also seeks to identify whether the companies that more intensely value time-based management have a higher return on assets relative to other companies. To meet the objectives of the study, a sample of 97 companies were surveyed from among those listed as the largest companies in Exame Magazine’s Biggest and Best [‘Melhores e Maiores’] book, July 2009. Data were collected using two procedures: a survey instrument completed by corporate managers and a survey of published accounting information. The survey instrument was constructed based on the theoretical framework and was structured as forty-six questions divided into four blocks. An indication of the reliability of the survey instrument was provided by its Cronbach's alpha (89.9%). A literature review was initially performed on the topic, then the survey study was developed with managers from the companies included in the sample and finally the association was tested between the companies’ valuation of time-based management and economic performance indicators. A data analysis was performed using descriptive statistics via normality tests: the Kolmogorov-Smirnov test, Levene’s test for the homogeneity of variances, Student’s t-test for independent samples, the Mann-Whitney test and the Chi-Square test for tables. A significance level of 5% was adopted for all statistical tests. It was found that the selected sample companies valued time-based management (using 78.58% of practices and indicators related to time-based management), but no association was found between a higher valuation of Time-Based Management and a greater Return on Assets (ROA).
1 InTRoduCTIon
Time-based management became popular as a result of the advent of the Toyota Production System. Sin-ce the 1980s, some Western companies have adopted new strategies using time as a resource for competitive advantage, and this has spawned a series of principles known as Time-Based Management. By reducing un-productive time, companies have been able to reduce costs, improve quality and remain closer to consumers. These improvements, however, have required a funda-mental change in management logic and the traditional beliefs that focused on operating at full capacity towar-ds a new concept that seeks the total optimization of the production flow (Kujala, Lillrank, Kronstrom, & Peltokorpi, 2006).
Time-Based Management entails the commitment of all employees in all sectors of the company to the full use of their time and to ensuring the quality of the product/servi-ce being delivered either to the end consumer or to the next link in the production chain. This new type of management implies the establishment of administrative and operatio-nal strategies and a review of the operatiooperatio-nal processes and information flows, among other actions.
Basically, time-based management seeks to deliver a high quality product to the consumer at the lowest price and within the shortest possible time. It is therefore neces-sary to coordinate the manufacturing system with supply logistics and distribution systems and with the develop-ment of new products while minimizing any and all waste. In other words, Time-Based Management is how a com-pany coordinates its activities to use time as efficiently as possible and Time-Based Competition is how companies establish business strategies based on the time factor. Time-Based Competition emphasizes that the strategic value of time is based on three primary sources: (i) a rapid response time influences a price premium, (ii) the rapid delivery of custom products attracts more customers and encourages brand loyalty, which results in an increase in market sha-re, and (iii) a rapid cycle of activities saves costs, especially production and logistics costs, which results in a higher contribution margin, reduced fixed costs and therefore hi-gher profits.
In Koufteros, Vonderembse and Doll's view (1998), stu-dies in manufacturing have been based on specific firms or
industries, which has inhibited the development of gene-ralizable manufacturing theories. In Brazil, this topic has been underexplored, with Rohr and Correa's work (1998) being one of the first to address the issue, although with a limited universe of seven studied companies. The study developed by Guerreiro, Cornachione Jr. and Kassai (2012) using the action research methodology suggested the use of the time factor in selling price planning models.
The present study is justified by the need to understand the principles of Time-Based Management not only in the product manufacturing environment but also in a broader sense involving key processes in the company's production chain from the start of the supply chain to the delivery of the product to the end consumer.
Another justification for this study is the importance of the empirical verification of these principles in the Brazilian industrial environment, not just focusing on a few cases in a single economic sector but on a larger and more representative sample. The universe of the largest industries operating in the Brazilian market was there-fore investigated.
The aim of this study is to answer the following question: To what extent do Brazilian industries value Time-Based Management? The developed study has the following specific objectives: (i) to verify whether the companies surveyed articulate and formalize time-based actions and strategic goals, (ii) to verify whether the sur-veyed companies develop actions that ensure reliability and acceleration in the supply area, (iii) to verify whether the surveyed companies develop actions that ensure re-liable acceleration of the production process, (iv) to veri-fy whether the surveyed companies develop actions that facilitate reliability and value creation for customers, and (v) to verify whether companies that value time-based management more intensely have a higher return on as-sets than other companies.
The primary contributions of this study are that it strengthens the organization of the literature on time-ba-sed management and provides knowledge about Brazilian business reality, verifying whether the companies included in the sample – large-sized companies operating in Brazil - value Time-Based Management, which is a key factor in a company's competitiveness.
2 TIMe-BASed MAnAgeMenT And PeRfoRMAnCe IndICAToRS
Studies on the time element have been developed using multiple approaches, such as the importance of the time factor in managerial accounting, the time factor relating to organizational culture, the time fac-tor in the context of performance measures, the time factor studied in different countries and the time fac-tor addressed in specific industries. In addition to the studies mentioned occasionally throughout this paper, studies researching this topic include the following: Ku-mar and Motwani (1995), Tersine and Hummingbird
Ful-lerton and Wempe (2009), Sung, Lu and Ho (2010) and Narasimhan, Kull and Nahm (2012).
According to Stalk and Hout (1990b), who are consi-dered to be the precursors of Time-Based Management, a company only becomes time-based when it develops criteria that consumers value and builds the company around them. For Mason-Jones and Towill (1999), Time-Based Management is also known as the Time Compres-sion Paradigm.
Authors such as Stalk and Hout (1990b), for example, use the expression "time-based management" and others, such as Bozarth and Chapman (1996), have used the con-cept of “time-based competition (TBC),” which is characte-rized as a management approach that emphasizes reducing the time required for the company to complete its key ac-tivities. For Helms and Ettkin (2000), in the sense of being a competitive weapon, time is equivalent to money, pro-ductivity, quality and innovation. Time management has enabled large companies to not only reduce costs but also to offer a wide range of products, to cover more market segments and to increase the technological sophistication of their products.
According to Nelson (1991, p. 72), time-based compe-tition cannot be seen merely as incentives and pressure to keep prices in line with the minimum possible cost but, more importantly, as an exploration of new and potentially better ways to do things.
Time-Based Management, as the basis for Time-Based Competition, is the organization of the company, both internally and with regard to its suppliers and customers, around the goal of reducing time. This type of management begins at the strategic level with the formulation of busi-ness strategies that take the time factor into consideration. The time-based management process then approaches the supply process, followed by the production process and ends with the distribution of the product or service to cus-tomers.
2.1 Strategic Alignment.
Strategic alignment, or strategic management, is rela-ted to the development and implementation of strategy in organizations. The strategy establishes the parameters for the organization in terms of defining the business it is in and the way in which it will compete, i.e., "strategy may be defined as the unifying theme that gives coherence and direction to the actions and decisions of an organization." (Craig & Grant, 1999, p. 4).
There are differing strategic typifications in the business environment, and among them, Porter's view (1980) can be highlighted. From this perspective, it can be seen that for some time, companies have primarily focused their com-petitive strategy on two primary vectors: price and quality. Price-oriented companies produce unsophisticated goods or services serving a mass market that is basically compo-sed of price-sensitive customers. In the second vector, com-panies base their strategies on quality.
Along this same line of thought, Wright, Kroll and Par-nell (2007, p. 185) state that companies can direct their
ge-neric strategies towards three objectives at the level of the business unit: (i) products at low cost; (ii) differentiated products, or (iii) differentiated products at low cost. It can be argued that Time-Based Management is a way of gui-ding strategy toward the third objective and that by orga-nizing the company to reduce time, it is possible to reduce costs even when diversifying products.
2.2 Supply Management.
Supply management comprises a set of activities ranging from the selection of suppliers, the planning and monitoring of inventory levels, and the delivery of materials to users, all aiming to ensure that the ne-cessary materials are available to the user in the right specification, in the right quantity and at the right time (Ballou, 2006).
According to Serra (2006, p. 124), the most critical steps for efficient supply chain management are the specification of materials, supply flows, suppliers, negotiation, commu-nication and information. Adequate inventory manage-ment enables the manager to monitor and establish goals to drive the company's competitive strategies.
Another possible alternative for reducing the cost of supplies is the appropriate selection of suppliers because suppliers establish the flow of material entering the factory. "Suppliers are looked on as co-producers, not as adversa-ries. The relationship with them should be one of mutual trust and cooperation." (Arnold, 1999, p. 463).
Hendrick, Carter and Siferd (1996) report that supply activity may play a critical role in reducing the operating cycle. A decrease in the operating cycle can occur by redu-cing supply batches, by reduredu-cing resupply times, by using a single supply source to improve supply quality and through the supply activity’s potential role as a connector between manufacturing and suppliers that has the ability to reduce the operating cycle.
2.3 Production Management.
Time-Based Management began in Japan after World War II, primarily with the Toyota Production System (Arnheiter & Greenland, 2008), which created the Just in Time technique. Gupta, Al-Turki, and Perry (1999) mention that Just in Time can be considered one of the most successful innovative techniques in the business environment. Just in Time is more than a technique and may be seen as a management philosophy that guides the coordination of the receipt of raw materials and de-mands that inputs be delivered at the time they will be consumed in production, which causes a significant re-duction in inventories of in-process and finished pro-ducts and seeks to ensure that the product is delivered to the customer at the time and under the conditions previously specified.
pro-ducts were of better quality and were more inexpensive. To maintain competitiveness and profitability in the ear-ly 1980s, American entrepreneurs and researchers went to Japan (Blackburn, 1991, p. 3) to learn to emulate these new practices.
According to Hay (1988, p. 10-12), entrepreneurs and researchers gathered to study Japanese companies and identified 14 points. Seven of these were categorized as "respect for people," and the rest were categorized as "was-te elimination" or "Just in Time Production." The removal of seven of the fourteen points of the Toyota Production System and the adaptation of this system to the western environment led to the renaming of this practice as Lean Manufacturing.
Another important difference, according to Hay (1988, p. 15), was the transmutation of the term "waste elimina-tion" to "value-added," which makes more sense to Western businessmen. According to Cusumano (1989, p. 321), the Japanese interpretation of quality control is that it is seen as the efficient alignment of market and production demands with the least possible waste; it is not a mere adjustment and inspection of the production process as a way to achie-ve pre-determined quality standards, as had been the case in the Western environment.
The production process most suited to a company’s in-terests should be selected according to its strategic option. After defining the production process, if a company opted for a time-based competition strategy, it would need to focus production on the Just in Time philosophy, develop quality management programs and emphasize the preven-tive maintenance of its industrial plant.
2.4 distribution Management.
Gale (1996, p. 23) notes, "why do customers choose one product or service over another? The reason is simple: they believe that they’ll get better value than they could expect from the alternative." This author mentions that companies succeed by providing higher customer value and that value is simply quality, although as defined by the customer, offe-red at a fair price.
The quality defined by Gale (1996) is known by the ex-pressions 'level of service' or 'customer service' by logistics scholars. In this vein, Ballou (2006, p. 93) notes that "ser-vice, or customer ser"ser-vice, is a broad term that may include many elements ranging from product availability to after-sale maintenance."
Clearly identifying what the customer values and determining indicators to evaluate the distribution performance are key elements of time-based distribu-tion. As noted by Ballou (2006, p. 95) and by Bower-sox, Closs and Cooper (2006, p. 76), the constituent elements of consumer value include availability, agility and delivery reliability as well as after-sale service, whi-ch ensures open and efficient communication between consumer and company.
Millen (1991, p. 211) states that substantial improve-ments in quality, productivity, space requireimprove-ments, in-ventory levels, asset utilization and response time have
been achieved by many companies. As a subsequent step to these improvements, the companies have inclu-ded their suppliers and vendors. Millen (1991, p. 212) reports that Toyota found that all of the time gained in manufacturing was spent on product distribution and thus instructed its engineers to develop a program that would reduce this time.
In the context of the time factor in distribution mana-gement, the concept of 'order cycle time' should be noted; according to Ballou (2006), order cycle time is defined as the time from the customer's request, purchase order or service request to the delivery of the product or service to the customer.
2.5 Performance Indicators.
Several studies have been conducted on the use of fi-nancial and non-fifi-nancial performance indicators, in par-ticular, the work of Neely (1999), Said, Elnaby and Wier (2003), Souza, Lisboa and Rocha (2003), Sliwka (2004), Abdel-Maksoud et al. (2005) and Guerreiro, Cornachione Jr. and Soutes (2011).
Performance indicators have specific characteristics according to the goals to be achieved in the business evaluation process (Neely, 1999). Several indicators can be used to evaluate the performance of the company as a whole. The most commonly studied in the literature are Economic Value Added (EVA) and Return on Invest-ment (ROI). These indicators are called economic per-formance indicators.
One of the most widely used indicators for the evalu-ation of a companies' economic performance is ROI - Re-turn on Investment, also known as ROA - ReRe-turn on Assets, which expresses the potential for the company to generate operating results. Rappaport (1986) mentions that a 1986 Fortune 1000 magazine survey pointed to ROI as the most frequently used measure to evaluate the performance of business divisions. This indicator is used in this study to meet one of the objectives.
According to Assaf Neto (2008b), ROI measures operating results in relation to the mean operating as-sets maintained by the organization. Operating results reflect business performance regardless of how the com-pany is financed. It should be noted that ROI is actually a reflection of the performance of two measures: ope-rating margin and total asset turnover. Assaf (2008b) notes that another indicator of economic performance is ROE - Return on Equity, which reflects the company owner's perspective, measuring net income relative to the company's equity.
3 STudy develoPMenT
3.1 Population and Sample.
The population included in the present study is res-tricted to companies that have two specific attributes: (i) they operate in an industrial activity and (ii) they are listed among Exame Magazine’s Biggest and Best [‘ Me-lhores e Maiores’] companies in the base year of 2008. The decision to limit the study to industrial enterprises means that financial, commercial and service companies were excluded; these have different operating characte-ristics from those desired for this study. Of the list of companies, 558 operating in the industrial sector were therefore selected. Companies for which profit values were not known were also excluded, leaving a study po-pulation of 474 companies.
The sample used in the study is considered to be a non-probabilistic convenience sample (Fávero, Belfiore, Da Sil-va & Chan, 2009). Questionnaires were sent electronically to the 395 companies included in the population for which the electronic address was known. A total of 97 valid res-ponses were received.
To conduct statistical tests to meet one of the ob-jectives of the survey, companies were classified into two major groups: (i) companies producing capital goods and (ii) companies producing consumer goo-ds. The consumer goods and capital goods industries were separated because these two business segments are important from an economic standpoint and the companies from these two industries have different operating characteristics. In this context, it appeared to be worthwhile to investigate whether there would be differences between these industries in the valuing of time-based management.
3.2 Survey Instrument.
The survey instrument was constructed based on the theoretical framework and was structured as forty-six questions divided into four distinct blocks.
a) Block I - Strategic Alignment: comprising eight ques-tions aiming to verify whether companies articulate and formalize time-based actions, strategic goals and objec-tives.
b) Block II - Supply Management: comprising eight ques-tions aiming to identify acques-tions that ensure reliability and the acceleration of the company's supply process. c) Block III - Production Management: comprising
twen-ty-two questions aiming to investigate actions that ena-ble the reliaena-ble acceleration of the production process. d) Block IV - Distribution Management: comprising eight
questions seeking to identify whether companies take actions that enable reliability and responsiveness to cus-tomers' needs.
A Likert scale was used in the survey instrument for the respondent to evaluate how much he/she agreed or disagre-ed with each statement. The possible choices were 'totally disagree', 'partially disagree', 'neither agree, nor disagree', 'partially agree' and 'totally agree'.
The reliability of the survey instrument was ensured through the following actions:
a) The survey instrument was submitted for evaluation by five persons, namely, three university professors with knowledge of the subject, a business consultant and a business logistics manager.
b) Cronbach's alpha was tested to ensure the reliabi-lity of the observed measurements. As explained by Martins and Theóphilo (2007), the alpha value is the mean of all correlation coefficients, and when this value exceeds 70%, it is said that there is reliabi-lity of the measurements. In this study, Cronbach's alpha was above the threshold level with a value of 89.9%; therefore, the reliability of the survey instru-ment can be assumed.
c) A pretest was conducted with three companies that were not part of the base population of this study, and it was found that the mean time for successful completion of the instrument was approximately 20 minutes.
3.3 data collection and Processing.
Data collection was conducted during the second half of 2009 using two procedures: an instrument completed by the managers of the sample companies and a survey of ac-counting information for these companies.
A letter introducing the study was sent to the mana-ger responsible for the industrial area. This letter con-tained the access link to the questionnaire in electronic form. The body of the cover letter provided a code to be used by the respondents when completing the survey instrument. This code allowed the receipt of responses to be controlled.
Up to four emails were sent to the sampled compa-nies. In the first two emails, only the cover letter with the text and an access link to the questionnaire were sent. In conversations with respondents, it was found that they preferred to receive the questionnaire as an email mes-sage attachment. The questionnaire was therefore sent as a file attachment in the third and fourth letters to all sample firms. The response return control showed the following results: 1st submission: 28 responses, 2nd sub-mission: 27 responses, 3rd subsub-mission: 18 responses and 4th submission: 24 responses.
the two groups of respondents would represent a biased sample.
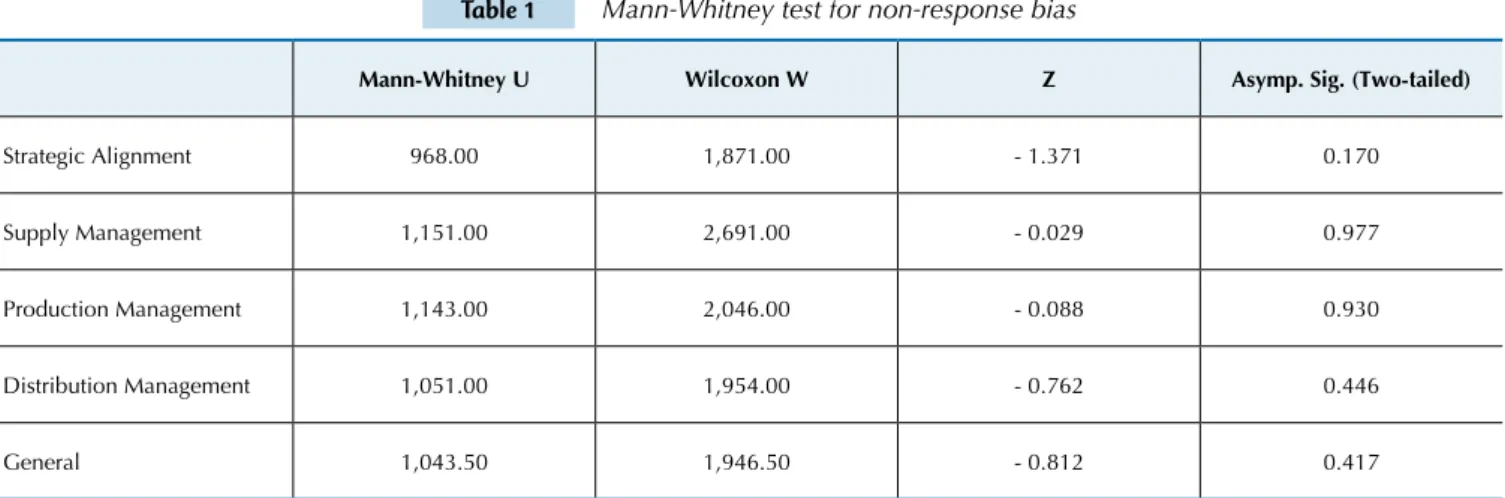
The sample was then separated between the first res-pondents and the last resres-pondents. A nonparametric Mann-Whitney test was conducted for two independent
samples, considering a significance level of 5% (Table 1). The result of the test indicated that there was no eviden-ce of non-response bias in the sample of respondents to this survey.
Table 1 Mann-Whitney test for non-response bias
Mann-Whitney U Wilcoxon W Z Asymp. Sig. (Two-tailed)
Strategic Alignment 968.00 1,871.00 - 1.371 0.170
Supply Management 1,151.00 2,691.00 - 0.029 0.977
Production Management 1,143.00 2,046.00 - 0.088 0.930
Distribution Management 1,051.00 1,954.00 - 0.762 0.446
General 1,043.50 1,946.50 - 0.812 0.417
In the second procedure, the database manager of Exame Magazine's Biggest and Best Companies book was asked for the following information: trade name, type of company, state of headquarters, number of employees, shareholder control, whether it trades on the stock ex-change, branch of activities, economic sector of activity, gross sales, gross profit, selling expenses, general and ad-ministrative expenses, equity income, total assets in 2008 and total assets in 2007.
Upon receipt of this information from the database, the ROA was calculated for each company in the sam-ple according to the formula proposed by Assaf Neto (2008a). First, the operating profit was calculated, i.e., financial income and expenses as well as taxes on profit were not considered.
After calculating the operating profit, the mean asset value was calculated, taking into account the total assets at the end of 2008 and the total assets at the end of 2007. The operating margin, asset turnover and ROA were then calculated for each of the sample companies.
3.4 data Analysis.
Considering the fact that most of the study varia-bles were ordinal, the data analysis was performed using descriptive statistics with the Kolmogorov-Smirnov and Shapiro-Wilk normality tests, Levene’s test for the homo-geneity of variance, Student’s t-test for two independent samples, the Mann-Whitney test and the Chi-square test for tables. In all of the statistical tests, a significance level of 5% was adopted.
4 deSCRIPTIon And AnAlySIS of ReSulTS of The fIeld STudy
The description and analysis of the data obtained is presented below according to the question blocks, i.e., strategic alignment, supply management, produc-tion management and distribuproduc-tion management. As mentioned earlier, each block was composed of state-ments for which the respondents marked their degree of agreement, i.e., TD (totally disagree), PD (partially disagree), NN (neither agree nor disagree), PA (par-tially agree), or TA (totally agree). Based on a broad view and considering only the 'totally agree' responses, it is possible to deduce that the sample companies sur-veyed valued time-based management: 36% for 'stra-tegic alignment,' 40% for 'supply management,' 48% for 'production management' and 50% for 'distribution management.'
After an analysis of the question blocks, this sec-tion presents an analysis of the operasec-tional performan-ce indicators that were classified according to the
blo-cks mentioned and detailed by statements to which the respondents indicated 'disagree,' 'indifferent' or 'agree'. Considering only the responses of the 'agree' type, it is possible to observe the degree of adherence to time-ba-sed management: 73% for 'strategic alignment,' 79% for 'supply management,' 79% for 'production management' and 82% for 'distribution management.' During the analysis, the term "the large majority" is used in cases where the number of respondents was higher than 50% of the study sample (97 companies).
4.1 Strategic alignment.
Table 2 Strategic alignment
TD PD NN PA TA Chi-Square
Value Sig.
We have detailed planning for the development of new products. 3 4 9 32 49 0.001
We have aggressive timelines for the development of new products. 9 9 36 27 16 0.157
We monitor the progress of the share of new products in total sales. 1 9 11 24 52 0.523
We believe that a rapid response time to the customer makes a premium price possible. 10 7 9 38 33 0.311
Our customers are loyal to our products. 4 5 11 54 23 0.116
Our customers suggest our products to new customers. 2 3 13 20 59 0.280
We adopt the principle of "zero defects" in production. 3 3 17 45 29 0.914
The use of guarantees is dropping in our company. 11 8 14 46 18 0.327
STRATEGIC ALIGNMENT 5.54% 6.19% 15.46% 36.86% 35.95% 0.014
It was found that 50.5% of the respondents indicated that they totally agreed with the statement that the com-pany has a detailed plan for the development of new pro-ducts; however, is can be observed from the responses that this plan is not converted into a challenging timeline for their development.
It can be observed that when launching new pro-ducts, the progress of sales is monitored. It can also be observed that the respondents' belief in customer loyalty is relative because the concentration of 'par-tially agree' responses was higher, but even though they question customer loyalty, the respondents strongly be-lieved that they suggest their products to other custo-mers. The concept of the production rate – referred to here as 'zero defects' - appears to have been adopted to a mild degree in that the responses were centered around 'partially agree'. Considering that manufac-turing companies align their strategies to time-based management, the final quality of the product is not yet fully achieved because the use of guarantees has not been drastically reduced.
The result of the normality tests for the questions in this block showed that the distribution of the answers is non-normal (p-value > 0.05), making it impossible to conduct parametric tests.
The chi-square test was conducted to compare the Con-sumer Goods and Capital Goods groups for all questions, and it was found that responses were equivalent in both groups, except in regard to the first question, which exhibi-ted a p-value of less than 0.05. The remaining questions did not show statistically significant differences. The set of res-ponses obtained in the Strategic Alignment block thus shows that the two industries studied articulate actions and targets of a strategic nature associated with the valuing of time.
4.2 Supply management.
The supply management block was composed of eight questions, which were grouped into two blocks of four questions. The first sub-block was designed to identify the level of commitment to suppliers and the second to the management of inventories. Table 3 summarizes the responses obtained in each.
Table 3 Supply management
TD PD NN PA TA Chi-Square
Value Sig.
Our suppliers deliver components according to our speciications. - 2 5 43 47 0.191
Our suppliers deliver components exactly at the agreed deadline. 2 12 8 64 11 0.871
Our company is in partnership with an integrated subset of suppliers. 2 12 10 38 35 0.535
Considering the total number of suppliers, our company prioritizes purchases of products
from certiied suppliers. 3 2 6 31 55 0.473
We control inventory based on the deadline for resupplying needs. 6 5 10 37 39 0.006
We measure the time lost due to lack of materials and components. 3 8 7 30 49 0.058
We control the time to quote a price, deadline and other purchase speciications. 2 19 16 38 22 0.207
There is measurement and monitoring of inventory turnover ratios. 6 10 6 24 51 0.237
In the first sub-block, it was found that there is a per-ception among respondents that suppliers are delivering components according to technical specifications, but the majority of respondents, approximately 66%, only partially agreed regarding the ability to meet established deadline policies. It is also evident that according to the majority of respondents (56.7%), companies use certifica-tion intensively as a way to ensure the quality level of their suppliers and also that there are partnerships between the surveyed companies and their suppliers, although with a somewhat lower intensity. The second sub-block shows that the majority of companies control their inventory based on the resupply deadline and that lost time due to lack of components is also measured, but the time spent on purchasing goods is still not tightly controlled. The in-ventory turnover rate was found to be emphatically used by most respondent companies.
The Kolmogorov-Smirnov and Shapiro-Wilk tests
reve-aled that all questions in this block showed a non-normal distribution, which made it impossible to carry out para-metric tests.
The chi-square test revealed that there was no differen-ce in the valuation of time-based management practidifferen-ces between the respondents coming from the consumer goods and the capital goods industries, except for the question se-eking to identify control over deadlines for the resupplying of inventories.
4.3 Production management.
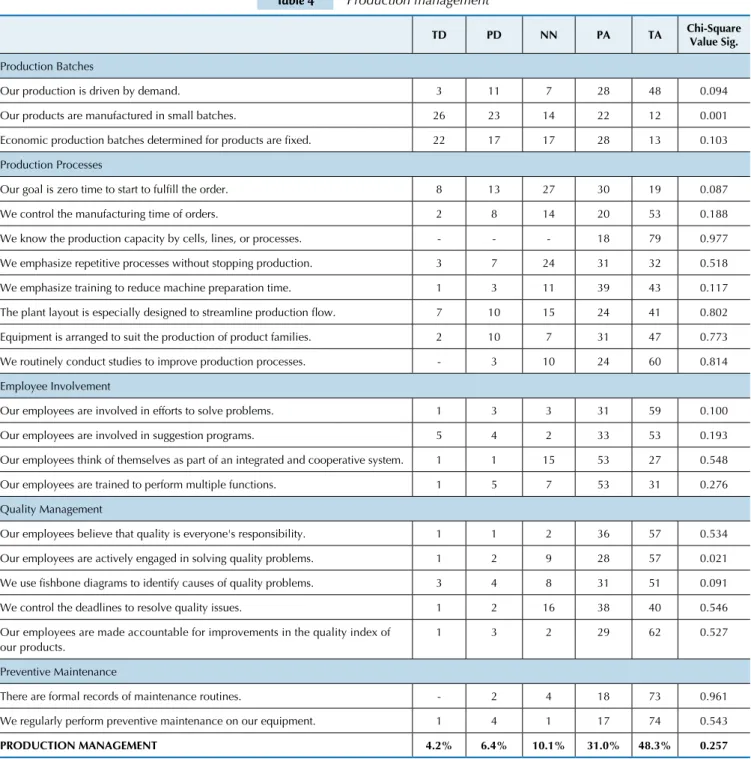
This block of questions aimed to assess whether compa-nies were developing actions to accelerate the operational process as a whole, and it was divided into five sub-blocks, namely, production batches, production processes, employee involvement, quality management and the preventive main-tenance management of industrial entities. Table 4 shows the summary of the results obtained for these questions.
Table 4 Production management
TD PD NN PA TA Chi-Square
Value Sig.
Production Batches
Our production is driven by demand. 3 11 7 28 48 0.094
Our products are manufactured in small batches. 26 23 14 22 12 0.001
Economic production batches determined for products are ixed. 22 17 17 28 13 0.103
Production Processes
Our goal is zero time to start to fulill the order. 8 13 27 30 19 0.087
We control the manufacturing time of orders. 2 8 14 20 53 0.188
We know the production capacity by cells, lines, or processes. - - - 18 79 0.977
We emphasize repetitive processes without stopping production. 3 7 24 31 32 0.518
We emphasize training to reduce machine preparation time. 1 3 11 39 43 0.117
The plant layout is especially designed to streamline production low. 7 10 15 24 41 0.802
Equipment is arranged to suit the production of product families. 2 10 7 31 47 0.773
We routinely conduct studies to improve production processes. - 3 10 24 60 0.814
Employee Involvement
Our employees are involved in efforts to solve problems. 1 3 3 31 59 0.100
Our employees are involved in suggestion programs. 5 4 2 33 53 0.193
Our employees think of themselves as part of an integrated and cooperative system. 1 1 15 53 27 0.548
Our employees are trained to perform multiple functions. 1 5 7 53 31 0.276
Quality Management
Our employees believe that quality is everyone's responsibility. 1 1 2 36 57 0.534
Our employees are actively engaged in solving quality problems. 1 2 9 28 57 0.021
We use ishbone diagrams to identify causes of quality problems. 3 4 8 31 51 0.091
We control the deadlines to resolve quality issues. 1 2 16 38 40 0.546
Our employees are made accountable for improvements in the quality index of our products.
1 3 2 29 62 0.527
Preventive Maintenance
There are formal records of maintenance routines. - 2 4 18 73 0.961
We regularly perform preventive maintenance on our equipment. 1 4 1 17 74 0.543
In the sub-block 'production batches,' a significant proportion of respondents (approximately 50%) indi-cated that production in their companies is driven by demand. However, the respondents disagreed with the statement that production occurs in small batches and agreed with the fact that their products have fixed pro-duction batches. These responses suggest that time-based management is not consciously chosen because if it were, the respondents would state that production is driven by demand and performed in small batches and would strongly disagree with the statement that there are fixed economic production batches.
What emerges from the 'production processes' sub-block questions is that currently, the respondents' com-panies are still not strongly concerned about starting to fulfill the customer's order promptly, but they do control the manufacturing time of those requests. Companies know their production capacity and are routinely con-ducting studies to improve their production process, but they still do not emphasize the production rate, despite claiming that their factory layout has been designed spe-cifically to streamline the production process.
In regard to 'employee involvement,' it was found that there is still room to accelerate the process. When ques-tioned about efforts to solve problems and involvement in suggestion programs, there were more 'totally agree' res-ponses, but when asked about cooperation between em-ployees and/or the capacity to exercise multiple functions, their conviction decreased as there were more 'partially agree' responses.
The 'quality management' sub-block showed that the efforts to improve the quality of employees and the pro-cess as a whole are reinforced by accountability for the product quality index. Furthermore, staff are engaged in solving problems and believed that quality is a responsi-bility that must be shared by all, but deadlines for solving problems are still not effectively controlled.
A belief that the companies have apparently already internalized is the need for 'preventive maintenance.' This
commitment is evidenced by the rate of the respondents’ total agreement to the two statements on preventive main-tenance, wherein the respondents not only stated that pre-ventive maintenance is performed but also that they keep formalized records of it.
The result of the normality tests for the questions in this block showed that the p-value in each case was in the re-jection area, that is, it can be stated that the distribution of responses is non-normal.
The chi-square test was conducted to compare the Consumer Goods and Capital Goods groups for all questions and found that only two questions showed a statistically significant difference, namely, 'our pro-ducts are manufactured in small batches' and 'our em-ployees are actively engaged in solving quality proble-ms,' where the p-value was less than 0.05. None of the remaining questions showed statistically significant differences. This result suggests that both groups of respondents equivalently value the precepts of Time-Based Management.
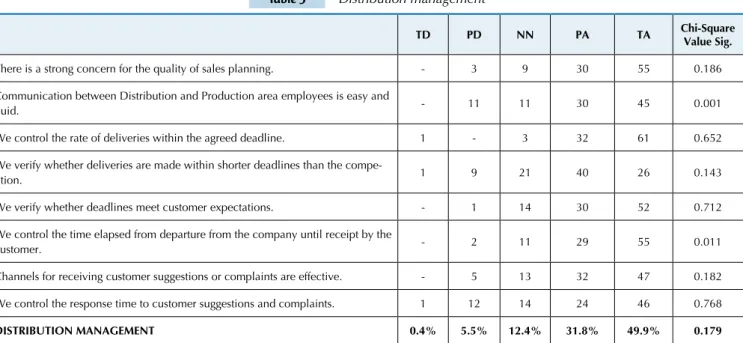
4.4 distribution management.
This block comprises questions designed to identify whether companies are concerned with acceleration in the distribution process and with capturing the value per-ceived by their customers. Table 5 summarizes the res-ponses to the questions in this block. It was found that there is strong concern regarding sales planning quality, and this result confirms the statement that production is determined by demand. Another observation was that companies are concerned with meeting their agreement with the customer and the customer’s expectations, but communication between the sales and production areas and the channels of communication with customers are not perceived as being very fluid. An interesting finding was that there is not an intense concern with competitors’ deadlines as most respondents said that they only par-tially agreed with the monitoring of the deadlines offered by the competition.
Table 5 Distribution management
TD PD NN PA TA Chi-Square
Value Sig.
There is a strong concern for the quality of sales planning. - 3 9 30 55 0.186
Communication between Distribution and Production area employees is easy and
luid. - 11 11 30 45 0.001
We control the rate of deliveries within the agreed deadline. 1 - 3 32 61 0.652
We verify whether deliveries are made within shorter deadlines than the
compe-tition. 1 9 21 40 26 0.143
We verify whether deadlines meet customer expectations. - 1 14 30 52 0.712
We control the time elapsed from departure from the company until receipt by the
customer. - 2 11 29 55 0.011
Channels for receiving customer suggestions or complaints are effective. - 5 13 32 47 0.182
We control the response time to customer suggestions and complaints. 1 12 14 24 46 0.768
The result of the normality tests for this block's ques-tions showed that the p-value of all quesques-tions was in the rejection area, indicating that the distribution of responses is non-normal.
The chi-square test was conducted between the Consu-mer Goods and Capital Goods groups for all questions, and it was found that in most cases, the valuing of Time-Based Distribution Management was similar for the two groups, with the exception of the second and sixth questions. Thus, the valuing of Time-Based Distribution Management is si-milar for the two groups.
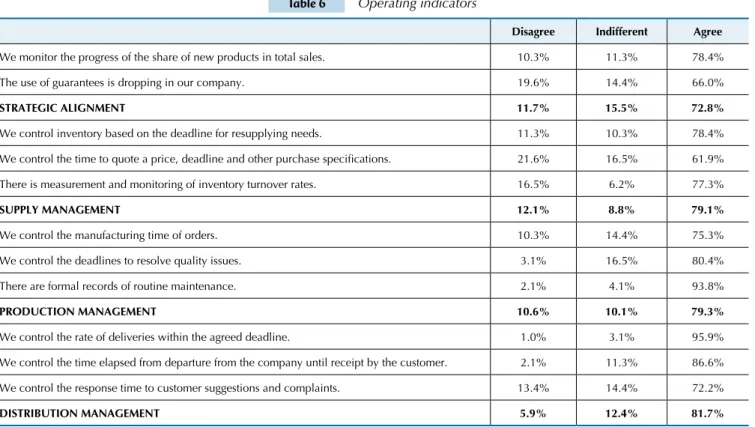
4.5 operational performance indicators.
In an attempt to verify the valuing of Time-Based Ma-nagement and its effective use in industries, the question-naire contained eleven questions on the use of particular indicators, which were termed 'operational indicators.' In
each block, there were at least two questions about the use of these indicators.
In the first block, two indicators were considered to demonstrate strategic alignment, and in the second blo-ck, two other indicators sought to attest to time-based supply management. In the third block, four indicators were used to ensure that there was time-based produc-tion management, and in the fourth block, three indica-tors were used to verify whether there was time-based distribution management.
The comparison of the results obtained for these state-ments with the percentage of total agreement in the block was a way to verify the consistency of responses as agre-ement in the use of indicators implies a formalized con-trol and not just a letter of intent detached from practice. Table 6 shows the percentage of adherence to the use of these indicators.
Table 6 Operating indicators
Disagree Indifferent Agree
We monitor the progress of the share of new products in total sales. 10.3% 11.3% 78.4%
The use of guarantees is dropping in our company. 19.6% 14.4% 66.0%
STRATEGIC ALIGNMENT 11.7% 15.5% 72.8%
We control inventory based on the deadline for resupplying needs. 11.3% 10.3% 78.4%
We control the time to quote a price, deadline and other purchase speciications. 21.6% 16.5% 61.9%
There is measurement and monitoring of inventory turnover rates. 16.5% 6.2% 77.3%
SUPPLY MANAGEMENT 12.1% 8.8% 79.1%
We control the manufacturing time of orders. 10.3% 14.4% 75.3%
We control the deadlines to resolve quality issues. 3.1% 16.5% 80.4%
There are formal records of routine maintenance. 2.1% 4.1% 93.8%
PRODUCTION MANAGEMENT 10.6% 10.1% 79.3%
We control the rate of deliveries within the agreed deadline. 1.0% 3.1% 95.9%
We control the time elapsed from departure from the company until receipt by the customer. 2.1% 11.3% 86.6%
We control the response time to customer suggestions and complaints. 13.4% 14.4% 72.2%
DISTRIBUTION MANAGEMENT 5.9% 12.4% 81.7%
In the block that addresses the articulation and for-malization of time-based actions and strategic goals, the use of the 'we monitor the progress of the share of new products' indicator is noteworthy as it has a higher percentage than the overall mean. The high percenta-ge of respondents who reported that they disagree with the drop in the use of guarantees should be noted. A cross-referencing of the results obtained for this indica-tor with the Quality Management score shows that the respondents disagreeing that the use of guarantees in their companies is dropping had higher scores for time-based quality management. This result shows that there is evidence of inconsistency in these results because if companies are actually investing in quality, the use of guarantees should be dropping.
In the block relating to time-based supply
manage-ment, all indicators mentioned had a high degree of agre-ement by the respondents in regards to their use. This result, however, draws attention to the fact that 16.5% of companies in the study did not calculate or use the inven-tory turnover indicator.
In the block relating to time-based production manage-ment, only the indicator for the control of order manufac-turing time obtained a score below the mean of the block as a whole, thus demonstrating consistency between the results obtained.
5 eConoMIC PeRfoRMAnCe IndICAToRS
After establishing the valuation of the principles and practices of Time-Based Management, we attemp-ted to determine whether there is evidence for the im-pact of this valuation on the economic performance in-dicators. First, the evidence for Operating Margin was sought, followed by Asset Turnover and, finally, Return on Assets as a whole.
5.1 operating Margin.
To ascertain whether there was an association be-tween the operating margin and the time-based mana-gement variables, the economic performance variables were statistically tested to determine whether they had a normal distribution. The results of the Kolmogorov-Smirnov and Shapiro-Wilk tests revealed that the p-va-lue was less than 0.05, confirming that the distribution was non-normal.
The Mann-Whitney test was thus used to verify whe-ther the samples of the two groups (Consumer Goods and Capital Goods industries) could be considered to derive from populations with equal means. The results showed that the difference between the two groups was statistically significant only at the 10% level (p-value = 9.2%). This re-sult suggested a slight difference between the two groups regarding Operating Margin.
5.2 Asset Turnover.
A test was performed to ascertain whether asset tur-nover had a normal distribution. Using the Kolmogorov-Smirnov and Shapiro-Wilk tests, the p-value was found to be 0.155, which is in the acceptance area, meaning that the statistical hypothesis that the distribution is normal cannot be rejected.
After showing that the variable had a normal distri-bution, a new test was conducted to verify whether this normality was maintained when separating the variable by the type of goods produced. The Kolmogorov-Smir-nov test showed a p-value (sig) greater than 5% for both groups of goods, allowing the hypothesis that Asset Tur-nover is normal to be accepted despite being different for the two groups.
Another assumption that required a statistical test was the homogeneity of variance within the two groups. Levene's test was performed to test this homogeneity and revealed that the observed variances were homogeneous with a p-value (sig) greater than 5%.
Given that the variable had a normal distribution and given the homogeneity of variances for the two groups, a test was performed to establish whether the difference in the industries' mean asset turnover was statistically significant, and it was concluded that the asset turnover of consumer goods was higher than the asset turnover of capital goods.
5.3 Return on Assets.
After testing the Operating Margin and Asset Turnover variables, the two were associated according to the above DuPont model, and new normality tests were conducted (Kolmogorov-Smirnov and Shapiro-Wilk tests). The tests showed that the p-value (sig) was in the rejection area, i.e., the assumption that the distribution is non-normal could be accepted.
Being a non-normal distribution, the nonparametric Mann-Whitney test was performed to verify whether the samples of the two groups (Consumer Goods and Capital Goods Industries) could be considered to derive from po-pulations with equal means, and it was found that there was no difference between the two groups.
5.4 economic performance versus time-based
management.
After testing the time-based management variables and economic performance variables separately, the results obtained in the questionnaires were combined with the economic performance indicators to verify whether the higher valuation of time-based manage-ment impacted the companies' economic performance. The initial goal objective was to separate the respon-dents into those who value and those who do not value time-based management, taking the score obtained in each block of the survey instrument as a base. For this purpose, positive values were assigned for the agree-ment alternatives and negative values for the disagre-ement alternatives, and the weights assigned ranged from -2 to +2.
It was found, however, that the number of respon-dents with scores less than zero was quite small for all questionnaire blocks, and there was only one case with an overall score below zero. This test was therefore not possible.
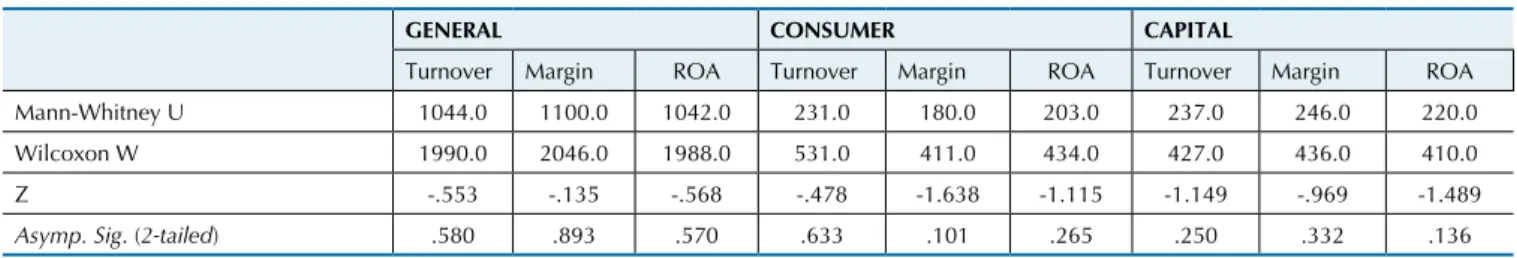
5.5 economic performance versus processes
considered together.
Table 7 Mann-Whitney test for economic indicators
GENERAL CONSUMER CAPITAL
Turnover Margin ROA Turnover Margin ROA Turnover Margin ROA
Mann-Whitney U 1044.0 1100.0 1042.0 231.0 180.0 203.0 237.0 246.0 220.0
Wilcoxon W 1990.0 2046.0 1988.0 531.0 411.0 434.0 427.0 436.0 410.0
Z -.553 -.135 -.568 -.478 -1.638 -1.115 -1.149 -.969 -1.489
Asymp. Sig. (2-tailed) .580 .893 .570 .633 .101 .265 .250 .332 .136
Grouping Variable: general_group
In light of the results obtained, it cannot be said that companies in the two industries studied who reported a greater valuation for time-based management showed an economic performance superior to the other companies
during the period considered. This statement is based on the data in Table 7, which show that the p-value (sig) of all groups and variables of economic performance was greater than 0.05.
6 dISCuSSIon of ReSulTS
The results allow some reflections to be made con-cerning the claims made by the authors of the theoretical framework. The first reflection refers to the indifference detected in a significant number of respondents with res-pect to the establishment of aggressive timelines for the development of new products. This statement received the lowest level of agreement in the entire questionnaire. The degree of indifference was surprising because it is believed that this is an important aspect of time-based competition. Of the 36 respondents that were indifferent, 8 (eight) were from the Steel & Metallurgy sector and 7 (seven) were from the Consumer Goods sector, i.e., the result of the first sec-tor confirms Jayaram et al.'s findings (1999) that the closer the company is toward the beginning of the value chain, the lower the impact of timelines on their strategies; however, the high rate observed in the second sector was surprising because this sector delivers the product directly to the end consumer.
Another result that stood out was that a rapid response time to the customer does not affect a price premium in the perception of 17% of the respondents, contrary to Kumar and Motwani's (1995) statement. In seeking to identify the sectors to which these respondents were related, the highest concentration was observed in the Consumer Goods sector. This result was again surprising, as according to Jayaram et al. (1999), the closer the company is to the end consumer, the greater the impact rapid response and delivery should have on business results.
Approximately 34% of the respondents who only partially believed in customer loyalty fully believed that these same customers recommended their products to new customers.
Another finding of the study is that Kumar and Motwani's statement (1995) that a rapid cycle of activities saves on production and logistics costs, which, in turn, results in a higher contribution margin and profitability, was not perceived by the sample evaluated. However, the perception of the respondents did confirm the authors' sta-tement that the rapid delivery of custom products attracts more customers and encourages brand loyalty.
Most of the companies in the Steel & Metallurgy sec-tor were in the group with lower scores regarding time-based supply management. This finding corroborates the claims of Ittner, Larcker, Nagar, and Rajan (1999) that the practice of partnering with suppliers is a contin-gent one, i.e., companies may be more or less interested in partnerships with their suppliers depending on the economic sector of activity.
The results indicated that the perception of the respon-dents corresponds to Ittner, Nagar, and Rajan’s (2001) theory in which they claim that stronger progress is a function of proactive investments in improvements in quality and auto-nomous learning by doing rather than by defect resolution; in the respondents' perception, it is important to routinely conduct studies to improve production processes.
The results encountered did not corroborate those ob-tained by Bulgarelli and Porto (2011, p. 16), who found in their study the following:
(...) companies of the different analyzed sectors are highly differentiated in terms of the gains and losses in produc-tivity with the adoption of each strategy, method and te-chnique. It is not possible, therefore, to state that certain strategies or techniques are likely to result in productivity gains when adopted because results are dependent on the sector analyzed (...),
because, as discussed earlier, the results are homogenous for the groups of respondents in the sample.
Zeithaml (2000) summarized evidence and iden-tified the relationship between service quality and profits. However, the results observed herein did not corroborate the claim that there is a direct relationship between service quality and profits. The results, ho-wever, confirmed that there is a relationship between service quality and purchase intentions because, in the perception of the respondents, their customers recom-mended their products to new consumers, thus de-monstrating that they attest to the quality of services and products.
importance of timely responses to customers, but there are companies that do not attribute much importance to this fact, as evidenced by the fact that over 50% of the respon-dents are not concerned with a rapid response; some said they only partially agreed with this statement, while others proved to be indifferent and even disagreed with the
adop-tion of this practice.
The findings of this study confirmed De Toni and Tonchia's (2001) findings that the use of time indicators is more strongly observed in the supply and production are-as. As observed, time indicators are not used by most of the sample companies in other areas.
7 ConCluSIonS
This study sought to establish the extent to which the companies surveyed valued time-based management. Five study objectives were established based on that question.
The first objective was to verify whether the surveyed companies articulate and formalize time-based actions and strategic goals, that is, to establish whether there is an alignment of organizational strategies aimed at the reliable acceleration of production processes. It may be concluded that yes, 72.81% of respondents said they agree with the actions and indicators evaluated, i.e., corporate strategy is aligned with the intention to reach the customer before the competition does and in a reliable manner.
The second objective was to verify whether the sur-veyed companies develop actions to ensure reliability and acceleration in the supply area, and this process showed a higher agreement rate than that for strategic alignment. The percentage agreement with the actions and indicators for Time-Based Supply Management corresponded to 79.12% of respondents. The third objective was to determine whe-ther the surveyed companies develop actions to ensure the reliable acceleration of their production process, and it was found that 79.33% of the respondents said that they agree with the actions and indicators of Time-Based Production Management.
The fourth objective was to determine whether the surveyed companies develop actions to ensure reliability and value creation for customers. The percentage of agre-ement with the use of Time-Based Distribution Mana-gement practices was found to be 81.7% of respondents. The fifth objective was to verify whether the companies that valued time-based management more intensely had a higher return on assets than the other companies. No as-sociation was found between the two variables, and thus, it cannot be said that the companies that place more value on time-based management have better economic results than other companies.
Returning to the study question, it is possible to con-clude that the sample companies operating in Brazil value time management because the respondents said that they agreed with the use of 78.58% of the practices and
indi-cators related to Time-Based Management. Reflecting on the contributions of this work, it is possible to state that this study is pioneering because only one other study has been conducted on Brazilian companies on this topic and only based on a very limited sample of companies. It was also possible to determine that there are few international studies with this study design.
Fundamentally, the primary contribution of this study is to provide answers to the study question formulated. We consider that the knowledge gained regarding Brazilian business reality is important. More specifically, the finding that the organizations included in the studied sample, lar-ge-sized industries operating in Brazil, value Time-Based Management is important because Time-Based Manage-ment is an important criterion for companies acting in an increasingly competitive environment.
In light of the reflections offered in the work of Van der Stede, Young and Chen (2005) on survey type studies, some considerations must be made regarding the limita-tions of this study: first, the study sample is not proba-bilistic and the results of the study cannot therefore be generalized, second, the survey instrument used contains questions that can be interpreted differently by respon-dents despite all of the caution taken, and third, only one respondent provided the information for each company and there may therefore be a limitation or distortion of perception about the reality of the company. A final con-sideration concerns the limitation in meeting the fifth goal of the study, i.e., the association between time-ba-sed management and return on investment, because data were only taken for 2008 and that year was atypical from the point of view of the world economy.
Finally, Chung's position (1999) should be revisited. He states that for competition to be considered success-ful, it is necessary to combine two aspects of time: Chro-nos (chronological time) and Kairos (God's time), mea-ning that one should not only do things quickly but also do them well. Time-based competition is competition based on change. The desire to change is the motivation beyond competition.
Abdel-Maksoud, A., Dugdale, D., & Luther, R. (2005). Non-inancial performance measurement in manufacturing companies. he British Accounting Review, 37 (3), 261-297.
Arnheiter, E. D., & Greenland, J. E. (2008). Looking for root cause: a comparative analysis. he TQM Journal, 20 (1), 18-30.
Arnold, J. R. T. (1999). Administração de materiais: uma introdução. São Paulo: Atlas.
Assaf Neto, A. (2008a). Estrutura e análise de balanços: um enfoque
econômico-inanceiro (8a ed.). São Paulo: Atlas.
Assaf Neto, A. (2008b). Finanças corporativas e valor (3a ed.). São Paulo: Atlas.
Babbie, E. (2001). Métodos de pesquisa de survey. Belo Horizonte: UFMG. Ballou, R. H. (2006). Gerenciamento da cadeia de suprimentos/logística
empresarial (5a ed.). Porto Alegre: Bookman.
Blackburn, J. D. (1991). he time factor. In J. D. Blackburn (Ed.). Time-based competition: the next battleground in American manufacturing.
Homewood, Illinois: Business One Irwin.
Bowersox, D. J., Closs, D. J., & Cooper, M. B. (2006). Gestão logística de cadeias de suprimentos. Porto Alegre: Bookman.
Bozarth, C., & Chapman, S. (1996). A contingency view of time-based competition for manufacturers. International Journal of Operations & Production Management. Bradford, 16 (6), 56.
Bulgarelli, L. H. P., & Porto, G. (2011). Análise da produtividade nas empresas industriais no Estado de São Paulo com base na adoção de estratégias e técnicas de manufatura: um estudo sobre a PAEP. Revista Ibero-Americana de Estratégia, 10 (2), 84-117.
Canen, T., Canen, A. G., & Helo, P. (2008). Time-based competition and multiculturalism: a comparative approach to the Brazilian, Danish and Finnish furniture industries. Management Decision, 46 (3), 349-364. Chung, C. H. (1999). Balancing the two dimensions of time for
time-based competition. Journal of Managerial Issues, 11 (3), 299-314. Craig, J., & Grant, R. (1999). Gerenciamento estratégico. São Paulo: Littera
Mundi.
Cusumano, M. A. (1989). Japanese automobile industry. Cambridge: Harvard University Press.
Daugherty, P. J., & Pittman, P. H. (1995). Utilization of time-based strategies: creating distribution lexibility/responsiveness. International Journal of Operations & Production Management, 15 (2), 54-60. De Toni, A., & Tonchia, S. (2001). Performance measurement systems
- models, characteristics and measures. International Journal of Operations & Production Management, 2 (1/2), 46-71. Dibrell, C., Davis, P. S., & Danski, P. (2005). he inluence of
internationalization on time-based competition. Management International Review, 45 (2), 173-195.
Fávero, L. P., Beliore, P., Da Silva, F. L., & Chan, B. L. (2009). Análise de dados: modelagem multivariada para tomada de decisões. Rio de Janeiro: Elsevier.
Fullerton, R. R., & Wempe, W. F. (2009). Lean manufacturing, non-inancial performance measures, and inancial performance. International Journal of Operations & Production Management, 29 (3), 214-240. Gale, B. T. (1996). Gerenciando o valor do cliente. São Paulo: Pioneira. Guerreiro, R., Cornachione Jr., E., & Kassai, C. R. (2012). Determining the
“plus” in cost-plus pricing: a time-based management approach. Journal of Applied Management Accounting Research (Jamar), 10 (1), 1-16. Guerreiro, R., Cornachione Jr., E., & Soutes, D. O. (2011). Empresas que se
destacam pela qualidade das informações a seus usuários externos também se destacam pela utilização de artefatos modernos de contabilidade gerencial? Revista de Contabilidade & Finanças, 22 (55), 88-113. Gupta, S. M., Al-Turki, Y. A. Y., & Perry, R. F. (1999). Flexible
kanban system. International Journal of Operations & Production Management, 19 (10), 1065-1093.
Hay, E. J. (1988). he just-in-time breakthrough: implementing the new manufacturing basics. New York: Wiley.
Helms, M. M., & Ettkin, L. P. (2000). Time-based competitiveness: a strategic perspective. Competitiveness Review, 10 (2), 1. Hendrick, T. E., Carter, C. R., & Siferd, S. P. (1996). Purchasing`s
involvement in time-based strategies. International Journal of Purchasing and Materials Management, 32 (3), 2-10.
Hoon, H. S. (1995). Time-based competition: some empirical data from Singapore. Asia Paciic Journal of Management, 12 (2), 123-131. Hutchinson, R. (2007). Linking manufacturing strategy to product cost:
toward time-based accounting. Management Accounting Quarterly, 9 (1), 31-42.
Ittner, C. D., Larcker, D. F., Nagar, V., & Rajan, M. V. (1999). Supplier selection, monitoring practices, and irm performance. Journal of Accounting and Public Policy, 18 (3), 253-281.
Ittner, C. D., Nagar, V., & Rajan, M. V. (2001). An empirical examination of dynamic quality-based learning models. Management Science, 47 (4), 563-578.
Jácome, R., Lisboa, J., & Yasin, M. (2002). Time-based diferention - an old strategic hat or an efective strategic choice: an empirical investigation. European Business Review, 4 (3), 184-193. Jayaram, J., Vickery, S. K., & Droge, C. (1999). An empirical study
of time-based competition in the North American automotive supplier industry. International Journal of Operations & Production Management, 19 (10), 1010-1033.
Jeong, Ki-Y., & Phillips, D. T. (2001). Operational eiciency and efectiviness measurement. International Journal of Operations & Production Management, 21 (11), 1404-1416.
Kouteros, X. A., Vonderembse, M. A., & Doll, W. J. (1998). Developing measures of time-based manufacturing. Journal of Operations Management, 16 (1), 21-41.
Kujala, J., Lillrank, P., Kronstrom, V., & Peltokorpi, A. (2006). Time-based management of patient processes. Journal of Health Organization and
Management, 20 (6), 512-524.
Kumar, A., & Motwani, J. (1995). A methodology for assessing time-based competitive advantage of manufacturing irms. International Journal of Operations & Production Management, 15 (2), 36-53.
Martins, G. A., & heóphilo, C. R. (2007). Metodologia da investigação cientíica para ciências sociais aplicadas. São Paulo: Atlas.
Mason-Jones, R., & Towill, D. R. (1999). Total cycle time compression and the agile supply chain. International Journal of Production Economics, 62, 61-73.
Millen, R. (1991). Time-Based Logistics. In J. D. Blackburn (Ed.). Time-based competition: the next battleground in American manufacturing. Homewood, Illinois: Business One Irwin.
Nahm, A. Y., Vonderembse, M. A., & Kouteros, X. A. (2004). he impact of organizational culture on time-based manufacturing and performance. Decision Sciences, 35 (4), 579-607.
Narasimhan, R., Kull, T. J., & Nahm, A. Y. (2012). Alternative relationships among integrative beliefs, time-based manufacturing and performance. International Journal of Operations & Production Management, 32 (4), 496-524.
Neely, A. (1999). he performance measurement revolution: why now and what next? International Journal of Operations & Production Management, 19 (2), 205-228.
Neely, A., Gregory, M., & Platts, K. (2005). Performance measurement system design. International Journal of Operations & Production Management, 25 (12), 1228-1263.
Nelson, R. R. (1991, Winter). Why do irms difer, and how does it matter? Strategic Management Journal, 12, 61-74.
Porter, M. E. (1980). Competitive strategy: techniques for analyzing industries and competitors. New York: he Free Press.
Rappaport, A. (1986). Creating sharehold value: the new standard for business performance. New York: he Free Press.
Rohr, S., & Correa, H. L. (1998). Time-based competitiveness in Brazil: whys and hows. International Journal of Operations & Production Management, 18 (3), 233-245.
Said, A. A., Elnaby, H. R. H., & Wier, B. (2003). An empirical investigation of the performance consequences of noninancial measures. Journal of Management Accounting Research, 15, 193-223.
Serra, S. M. B. (2006). Qualidade na gestão de suprimentos. In O.J. Oliveira (Org.). Gestão da qualidade: tópicos avançados. São Paulo: Pioneira homson Learning.
Shingo, S. (2007). O sistema Toyota de produção do ponto de vista da engenharia de produção. Porto Alegre: Bookman.
Sliwka, D. (2004). On the use of noninancial performance measures in management compensation. Journal of Economics & Management Strategy, 11 (3), 487-511.
Souza, M. A. de, Lisboa, L. P., & Rocha, W. (2003). Práticas de contabilidade gerencial adotadas por subsidiárias brasileiras de empresas multinacionais. Revista de Contabilidade & Finanças, 14 (32), 40-57.
Stalk Jr, G., & Hout, T. M. (1990a). How Time-based management measures performance. Planning Review, 18 (6), 26.
Stalk Jr, G., & Hout, T. M. (1990b). Redesign your organization for time-based management. Planning Review, 18 (1), 4.
Sung, T. J., Lu, Y. T., & Ho, S. S. (2010). Time-based strategy and business performance under environmental uncertainty: an empirical study of design irms in Taiwan. International Journal of Design, 4 (3), 29-42. Tersine, R. J., & Hummingbird, E. A. (1995). Lead-time reduction: the
search for competitive advantage. International Journal of Operations & Production Management, 15 (2), 8-18.
Tu, Q., Vonderembse, M. A., Ragu-Nathanb, T. S., & Sharkeyb, T. W. (2006). Absorptive capacity: enhancing the assimilation of time-based manufacturing practices. Journal of Operations Management, 24, 692-710.
Van der Stede, W. A., Young, M. S., & Chen, C. X. (2005). Assessing the quality of evidence in empirical management accounting research: the case of surveys studies. Accounting, Organizations and Society, 30 (7-8), 655-684.
Vickery, S. K., Yomans, J. M., & Markland, R. E. (1995). Time-based competition in the furniture industry. Production and Inventory Management Journal, fourth quarter, 35 (4), 14-21.
Wagner, B., & Digman, L. (1997). he relationships between generic and time-based strategies and performance. Journal of Managerial Issues, 9 (3), 334-354.
Wright, P. L., Kroll, M. J., & Parnell, J. (2007). Administração estratégica: conceitos. São Paulo: Atlas.