INFLUENCE OF THE Al CONTENT ON THE PHASE
TRANSFORMATIONS IN Cu-Al-Ag ALLOYS
A. T. ADORNO1; A. V. BENEDETTI1; R. A. G. da SILVA1; M. BLANCO1
1 Departamento de Físico-Química - Instituto de Química - Unesp
Caixa Postal 355 - CEP 14801-970 –Araraquara-SP – Brasil. Introduction
The literature about alloys of the Cu-Al system is extensive, due to its practical use. These alloys are of low cost and present good strength and hardness, depending on the Al content. They are used for making sleeves, guides, seats, flanges, gear wheels and many other critical small parts, as electrolysis cell cathodes, circuit plates and casting moulds when high thermal conductivity is needed. Cu-Al alloys with concentration in the range from 9 to 14wt.%Al contain in their structure the (α + γ1) eutectoid, which is formed through decomposition of the β phase. On rapid cooling from high temperatures, the β phase undergoes a martensitic transformation. When quenched from the β state, alloys containing more than about 11wt.%Al first become ordered to the β1 phase and then transform martensitically to either β1’,(β1’ + γ’) or γ’,
depending on the Al content. In alloys with less than 11wt.%Al the β phase transforms to an fcc type of disordered martensite [8]. Silver additions to the Cu-Al alloys increase its hardness [4] and improves the resistance to stress corrosion [1], without changing significantly the plasticity and workability of the alloys.
In this work, the influence of the Al content on the phase transformations of Cu-Al-Ag alloys was studied by classical differential thermal analysis (DTA), optical microscopy (OM) and X-ray diffractometry (XRD), and the results were compared with those found in the literature[2]
Experimental
The 9%wt.Al-4wt.%Ag, Cu-10wt.%Al-4wt.%Ag and Cu-11wt.%Al-4wt.%Ag alloys were prepared in an induction furnace under Abstract
The influence of the Al content on the phase transformations in Cu-Al-Ag alloys was studied by classical differential thermal analysis (DTA), optical microscopy (OM) and X-ray diffractometry (XRD). The results indicated that the increase in the Al content and the presence of Ag decrease the rate of the
β1 phase decomposition reaction and contribute for the raise of this transition temperature, thus decreasing the stability range of the perlitic phase resulted from the b1 decomposition reaction.
Keywords:phase transitions; martensitic transformation; Cu-Al-Ag alloys.
Volume 28 (2003) número 1
argon atmosphere using 99.95% starting materials and graphite crucible. Results from chemical analysis indicated a final alloy composition very close to the nominal one. Small cylinders of about 10 mm length and 5.0 mm diameter were used for DTA analysis and flat square samples of about 10 mm were obtained for metallography and XRD. These samples were initially annealed for 120 h at 850 ºC for homogenization and after annealing some of them were equilibrated for one hour at 850 ºC and quenched in iced water. The XRD diagrams were obtained using a Siemens D5000 X-ray diffractometer. After the heat treatments the flat samples were polished, etched and examined in a Leica DMR optical microscope.
DTA curves were obtained using a sample holder with two Ni/Cr-Ni/Al thermocouples, one of which was introduced in the sample and the other in a pure copper cylinder with the same sample dimensions. The sample holder, inside a Vycor tube, was introduced in a furnace and the thermocouples terminals were connected to a HP 34404A multimeter. The heating rate and the data acquisition were controlled using a MQ 112 Micro-Química interface.
Results and discussion
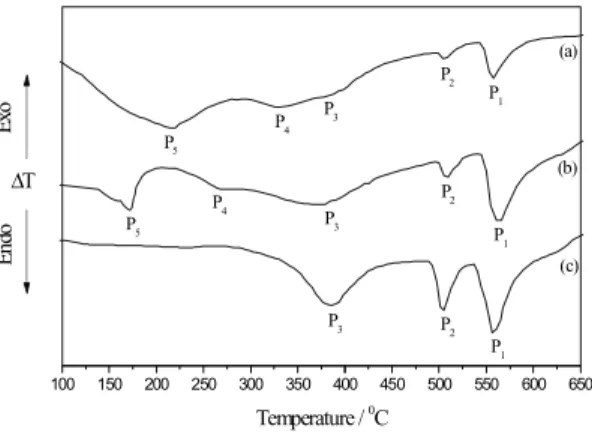
Figure 1 shows the DTA curves obtained at a heating rate of 20 ºCmin-1for the Cu-9wt.%Al-4wt.%Ag (curve a), Cu-10wt.%Al-Cu-9wt.%Al-4wt.%Ag (curve b) and Cu-11wt.%Al-4wt.%Ag (curve c) alloys annealed at 850 ºC for 120 hours. In curves (a) and (b) five endothermic peaks were observed, while in curve (c) only three peaks were detected. Peak P1, at about 559 ºC, is due to the α + γ1↔ β eutectoid transformation [10], as expected from the Cu-Al equilibrium diagram [9]. The endothermic peak P2, at about 508 ºC, is associated to the β1 phase disordering. The martensitic phase β1’ changes into the β1 phase in the same temperature interval of the α2 phase disordering process and at about 508 ºC the β1 phase transforms into the β phase [7]. Peak P3, at about 380 ºC, is associated to the dissolution of the α2 phase precipitates formed during slow cooling [4]. The peak P4, which is observed at about 330 ºC in curve (a) and 270 ºC in curve (b), corresponds to the α + α2 → α + γ1 order-disorder transition6 and peak P5, observed at about 220 ºC in curve (a) and 170 ºC in curve (b)
corresponds to the beginning of the α2 phase disordering [2]. Peaks P4 and P5 were not detected in curve (c). It is possible to observe, in fig.1, that the intensity of peak P1 increases with the Al concentration and that its temperature is shifted to lower values, when compared with the temperature for samples without Ag addition [2]. This temperature shift may be associated to the Ag dissolution in the matrix, which increases the α
phase relative fraction and facilitates the formation of the β phase from the combination of the remaining
α with the perlitic phase. The increase in the intensity of peak P1 may be due to the increase in the Al concentration, which causes an increase in the relative fraction of the γ1 phase.
Figure 1. DTA curves obtained after annealing:
(a) Cu-9%Al-4%Ag alloy; (b) Cu- 10%Al-4%Ag alloy and (c) Cu-11%Al-4%Ag alloy. Heating rate 20 ºC min-1.
Peak P2 is also shifted to lower temperatures, compared with samples without Ag additions, and its intensity increases with Al concentration. The shift and intensity increase may be related to the combined effects of Al concentration increase, which facilitates the β1 phase rosettes formation [5] and the aftereffect of
β phase formation from β1, and of the presence of Ag, which seems to increase the relative fraction of theβ1’ martensitic phase retained in samples cooled at a rate higher than 2 ºCmin-1. Peak P3 intensity increases with the increase in the Al content, due to the greater a2 relative fraction. The presence of Ag seems not to interfere in this transformation, because it is observed at the same temperature as the samples without Ag. Peaks P4 and P5 are shifted to lower temperatures with the increase in the Al concentration, and for the Cu-11wt.%Al-4wt.%Ag (curve c) they are not detected.
100 150 200 250 300 350 400 450 500 550 600 650
(c) ∆T En do Ex o
Temperature /0C
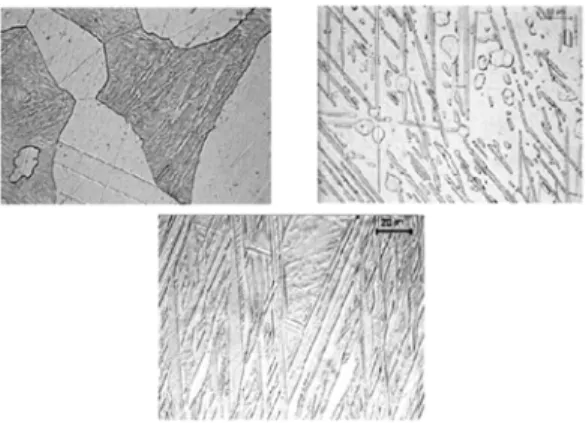
Figure 2. Optical micrographs (500x) obtained for the alloys after annealing: (a) 9%Al-4%Ag; (b) Cu-10%Al-4%Ag; (c) Cu-11%Al-4%Ag.
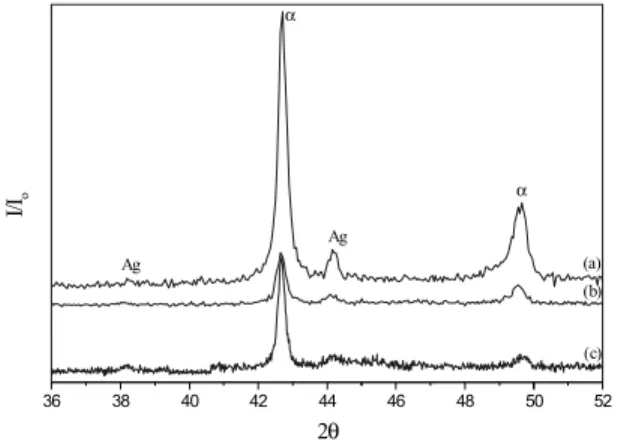
Figure 3. X-ray diffraction patterns obtained
for the alloys after annealing: (a) 9%Al-4%Ag; (b) Cu-10%Al-4%Ag; (c) Cu-11%Al-4%Ag.
The starting point of the DTA curves in fig. 1 corresponds to the perlitic phase, as observed in the optical micrographs of figure 2. At this point there is also an amount of Ag remaining from the solution treatment, as showed in the X-ray diffraction patterns of figure 3. The micrographs of fig. 2 seems to confirm that the increase in the Al content decreases the relative fraction of α phase and promotes the perlitic phase formation.
Figure 4 shows the DTA curves obtained at a heating rate of 20 ºCmin-1 for the Cu-9wt.%Al-4wt.%Ag (curve a), Cu-10wt.%Al-Cu-9wt.%Al-4wt.%Ag (curve b) and Cu-11wt.%Al-4wt.%Ag (curve c) alloys
36 38 40 42 44 46 48 50 52
(c) (b) (a) I/Io
2θ
α
Ag
α
Ag
quenched from 850 ºC. In the curves of fig. 4 the endothermic peak P1, at about 559 ºC, is due to the
α + γ1↔ β eutectoid transformation [10] and the endothermic peak P2, at about 525 ºC, is attributed to the β1→ β transition from the remaining part of theβ1phase formed at low temperature [8]. The endothermic peak P3, at about 480 ºC, is associated to the reverse martensitic transformation and to the
β1→ α + γ1decomposition from part of theβ1 phase. Peak P3 was not detected in curves (a) and (b). The exothermic peak P4, at about 400 ºC, may be associated to the precipitation of Ag dissolved in the matrix [3]. P5 is due to the ordering of the martensiticβ’ phase remaining from the β’→ β1’ transformation and to the end of the α2 phase ordering [2]. P6 may be associated to the beginning of the α phase ordering. Peak P1 in fig. 4 seems to undergo the same changes observed for the corresponding peak in fig. 1. It is possible to observe an increase in the intensity of peak P2 in fig. 4, but the transition temperature is very close to the expected one [2]. Comparing to the transition for the annealed sample (fig. 1), this phase transition is now the dominant effect for the quenched samples, in the temperature range considered. This must be associated to the increase in the martensitic phase retained at fast cooling. This peak temperature is close to that observed for samples without Ag addition, indicating that the effect of the presence of Ag has been minimized by the heat treatment. Peak P3, observed at about 480 ºC in curve (c) of fig. 4, is observed at about 380 ºC in Cu-Al alloys [2], indicating that the increase in the Al concentration and the presence of Ag are decreasing theβ1 phase decomposition reaction rate and contributing to the increase in the temperature transition. Thus it causes a decrease on the stability range of the perlitic phase produced by the β1 phase decomposition. As the β1’→ β1
the β1 phase decomposition catalyzes the Ag precipitation reaction. The absence of the exothermic peak P4 in curve (a) seems to indicate that this thermal event is occurring in the same temperature range of the endothermic peak P3, and that the enthalpic variations are similar, causing the absence of both thermal events. Peak P5is observed at about 290 ºC in alloys with 9 and 10 wt.%Al and is associated to the martensitic ordering reaction [2] and is not observed in curve (a) of fig. 4, indicating that the presence of Ag disturbs the β’ phase ordering process. In curve 4-b this peak was observed at about the same temperature as that for the alloy without Ag addition.
The starting point of the DTA curves of fig. 4 corresponds to the martensitic phase, as showed by the micrographs in figure 5. It is known [12] that alloys with less than 10.8 wt.%Al must show the β’ type martensitic phase and that over this concentration the martensitic phase observed is the β1’. The micrographs in fig. 5 show the presence of the β1’ martensitic phase in the Cu-10 wt.%Al alloy. It seems to indicate that the addition of 4 wt.%Ag shifts the equilibrium concentration to higher Al contents. The presence of the β1’ martensitic phase in the Cu-10 wt.%Al-4 wt.%Ag alloy indicates that the dominant effect, in the temperature range where peak P5 is detected, is the end of the α phase ordering process. In curve 4-c this final step is shifted to higher temperatures, probably due to some interaction of the α phase with Ag.
Figure 4. DTA curves obtained for alloys initially quenched: (a) Cu-9%Al-4%Ag; (b) Cu-10%Al-4%Ag; (c) Cu-11%Al-4%Ag. Heating rate 20 oCmin-1
Figure 5. Optical micrographs (500x) obtained for alloys quenched from 850 oC: (a) Cu-9%Al-4%Ag; (b) Cu-10%Al-4%Ag; (c) Cu-11%Al-4%Ag.
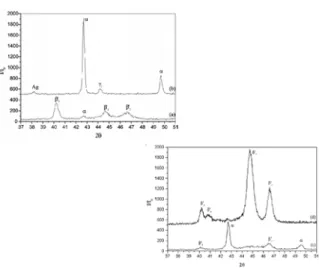
In the micrographs of figure 6 it is possible to observe the phase transformations sequence occurring in the Cu-10 wt.%Al-4 wt.%Ag alloy initially quenched from 850 oC and then successively quenched in the temperature range from 300 to 950 oC. These micrographs seems to confirm what was proposed in the discussions of fig. 4. In the X-ray diffraction patterns showed in figure 7 it is possible to observe that the proposed sequence is in good agreement to that expected from the Cu-Al equilibrium diagram [9], and that this sequence of transformations is not modified by the presence of Ag.
Figure 7. X-ray diffraction patterns obtained
for the Cu-10%Al-4%Ag alloy initially quenched from 850 ºC and then quenched from: (a) 300 ºC; (b) 500 ºC; (c) 600 ºC and (d) 950 ºC.
Conclusions
The results indicate that with the addition of 4 wt.%Ag to the 9wt.%Al, Cu-10wt.%Al and Cu-11wt.%Al alloys it is possible to observe the phase transformations corresponding to higher Al concentration. The increase in the Al content decreases the α phase relative fraction and promotes the perlitic phase formation. The increase in the perlitic phase seems to facilitate the Ag diffusion. The increase in the Al concentration and the presence of Ag decrease the β1 phase decomposition reaction rate and contribute for the increase in the temperature transition, thus decreasing the stability range of the perlitic phase, produced by the β1 phase decomposition reaction. The results also indicate that this decomposition reaction seems to catalyze Ag precipitation.
Acknowledgements
The authors thank FAPESP and CNPq for financial support.
ADORNO, A. T.; BENEDETTI, A. V.; SILVA, R. A. G.; BLANCO, M.; Influência da concentração de Al nas transformações de fase em ligas de Cu-Al-Ag.
Resumo
A influência da concentração de Al nas transformações de fase em ligas de Cu-Al-Ag foi estudada por análise térmica diferencial clássica (ATD), microscopia óptica (MO) e difratometria de raios X (DRX). Os resultados indicaram que o aumento no teor de Al e a presença de Ag diminuem a velocidade da reação de decomposição da fase
β1 e contribuem para o aumento da temperatura desta transição, diminuindo assim o intervalo de estabilidade da fase perlítica, resultante da reação de decomposição.
Palavra-chave: transformações de fase; transformação martensítica; ligas de Cu-Al-Ag
References
[1] ADORNO, A. T.; GUERREIRO, M. R.; BENEDETTI, A. V. Influence of silver additions on the aging characteristics of the Cu-10.4at.%Al alloys. J. Alloys Comp., v. 268, p. 122-129, 1998.
[2 ]ADORNO, A. T.; GUERREIRO, M. R.; BENEDETTI, A. V. Thermal behavior of Cu-Al alloys near the α-Cu-Al solubility limit. J. Thermal Anal. Cal., v. 65, p. 221-229, 2001.
[3] ADORNO, A. T.; GUERREIRO, M. R.; RIBEIRO, C. A.; GUERREIRO, C. T. R. Influence of silver additions on the thermal behavior of the Cu-8wt.%Al alloy. J. Thermal
Anal. Cal., v. 64, p. 1141-1146, 2001.
[4] ARRUDA, G. J.; ADORNO, A. T.; MAGNANI, R.; BEATRICE, C. R. S. Kinetics of eutectoid decomposition in Cu-Al and Cu-Al-Ag alloys.Mater. Lett., v. 32, p. 79-84, 1997.
[5] COPE, R. G. The tempering of martensite in copper-aluminum alloys.J. Inst. Metals, v. 87, p. 330-336, 1959.
[6] GAUDIG, W.; WARLIMONT, H. The structure of short range ordered α-Cu-Al alloys and a new superlattice phase.
Acta Metall., v. 26, p. 709-724, 1978.
[7] KWARCIAK, J. Phase transformation in Cu-Al and Cu-Zn-Al alloys. J.Thermal Anal., v. 31, p. 559-566, 1986.
[8] KWARCIAK, J.; BOJARSKI, Z.; MORAWIEC, H. Phase transformation in martensite of Cu-12.4%Al. J. Mater. Sci., v. 21, p. 788-792, 1986.
2nd. ed. Metals Park: American Society for Metals, v.1, p.141-143, 1992.
[10] MURRAY, J. L. The aluminum-copper system. Int.
Met. Rev., v. 30, p. 211-233, 1985.
[11] RUZZANTES, J. E.; KUROKAWA, S.; GARCÌA, E. A.; DYMENT, F. Diffusion in the β/γ2 interphase boundary of the Cu-Al system. Acta Metall., v. 28, p. 699-707, 1980.