Ecl. Quím., São Paulo, 35(1): 35 - 40, 2010 40
Artigo
Article www.scielo.br/eq
Volume 35, número 1, 2010
41
ConCLuSion
From the results obtained in the current
study, the relative proportion of these lavonoids
was reduced by maceration conventional techni-que, while microwave and ultrasonic techniques in combination with 70% ethanol solvent were the
most eficient. It may suggest that microwave and
ultrasonic methods using 70% ethanol are suitable
for fast extraction of lavonoids in a simple way,
also considering extraction yield and extraction time. These methods also permitted the
acquisi-tion of lavonoids from reduced raw plant mate -rial.
Acknowledgments
C. P. Victório acknowledges the PhD fello-wship from CAPES/ PROAP/PROEX (Brazil). The authors are also grateful to Gisele de Olivei-ra (UFRJ) for the valuable technical assistance in HPLC use.
resumo: O presente estudo teve como objetivo veriicar a melhor metodologia de extração para rápida e eiciente obtenção de lavonóides a partir de Alpinia zerumbet. Folhas secas foram extraídas com água destilada e etanol 70%, utilizando as metodologias de extração: maceração sob agitação, ultrassom,
microondas e agitador. Para veriicação dos lavonóides rutina e kaempferol-3-O-glicuronídeo foram
utilizadas as técnicas de CCD e CLAE em fase reversa. O solvente etanol 70% foi mais eiciente como extrator. Para as metodologias ultrassom, microondas e agitador, não houve variação signiicativa para
o rendimento utilizando etanol 70% (11 a 14%). A concentração relativa de rutina e kaempferol-3-O -glicuronídeo, respectivamente, foi maior pelos métodos de extração por ultrassom (1,5 e 5,62 mg g-1 folha seca) e microondas (1,0 e 6,64 mg g-1 folha seca), utilizando etanol 70%. Procedimentos rápidos e
simpliicados de extração otimizam o trabalho itoquímico e a obtenção de metabólitos secundários.
Palavras-chave: cromatograia líquida de alta eiciência, maceração, microondas, ultrassom, Zingiberaceae
BiBLiogrAPHY
[1] C. P. Victório, R. M. Kuster, C. L. S. Lage, Braz. J. Med. Plant 11 (2009) 147.
[2] R. Soares de Moura, A. F. Emiliano, L. C. R. Carvalho, M. A. V. Souza, D. C. J. Guedes, Cardiovas. Pharmacol.46 (2005) 288.
[3] L. A. M. A. da Costa, S. M. Morais, M. C. B. R. Dantas, R. A. C. M. Lobo, M. C. Fonteles, Rev. Bras. Farmacol. 79 (1998) 96.
[4] M. A. Mpalantinos, R. Soares de Moura, J. P. Parente, R. M. Kuster, Phytother. 12 (1998) 442.
[5] B. H. Havsteen, Pharmacol. Therapeutics 96 (2002) 67. [6] C. P.Victório, S. G. Leitão, C. L. S. Lage, J. Ess. Oil Res. 22 (2010) 52.
[7] X. Pan, G. Niu, H. Liu, J. Chromatogr A 922 (2001) 371. [8] C. P.Victório, C.A.S. Riehl, C. L. S. Lage. J. Ess. Oil-Bear. Plants12 (2009) 137.
[9] X. Pan, G. Niu, H. Liu, Chem. Eng. Process. 42 (2003) 129.
[10] D. P. Fulzele, R. K. J. Satdive, J. Chromatogr. A 1063 (2005) 9.
[11] A. H. Goli, M. Barzegar, M. A. Sahari, Food Chem. 92 (2004) 521.
[12] N.Turkmen, F. Sari, Y. S. Velioglu, Food Chem. 99 (2006) 835.
[13] R. M. S. Celeghini, J. H. Y. Vilegas, F. M. Lanças, J. Braz. Chem. Soc. 12 (2001) 706.
[14] Y. Yang, F. Zhang, Ultras. Sonochem. 15 (2008) 308. [15] A. A. Craveiro, F. J. A. Matos, J. W. Alencar, M. M. Pu-mel, Flav. Frag. J. 4 (1989) 43.
[16] K. Ganzer, I. Szinai, A. Salgo, J. Chromatogr. 520 (1990) 257.
[17] E. Rijke, P. Out, W. M. A. Niessen, F. Ariese, C. Gooijer, U. A. Th. Brinkman, J. Chromatogr., A 112 (2006) 31. [18] B. H. Oliveira, T. Nakashima, J. D. S. Filho, F. L. Frehse, J. Braz. Chem. Soc. 12 (2001) 243.
[19] L. Tao, Z. T. Wang, E. Y. Zhu, Y. H. Lu, D. Z. Wei, South African J. Bot. 72 (2006) 163.
[20] C. A. Williams, J. B. Harborne, Biochem. Syst. Ecol. 5 (1977) 221.
Artigo/Article
SPot-teSt iDentiFiCAtion AnD rAPiD
quAntitAtiVe SequentiAL AnALYSiS oF DiPYrone
M. Tubino1*, A. C. Biondo1, M. M. D. C. Vila2, L. Pezza3 and H. R. Pezza3
1 State university of Campinas - uNiCAMP, institute of Chemistry, P.O. Box6154, 13083-970 Campinas, SP, Brazil,
2 Sorocaba university - uNiSO, Sorocaba, SP, Brazil
3 São Paulo State university- uNESP, Chemistry institute of Araraquara, Araraquara, SP, Brazil
Abstract: A qualitative spot-test and tandem quantitative analysis of dipyrone in the bulk drug and in pharmaceutical preparations is proposed. The formation of a reddish-violet color in-dicates a positive result. In sequence a quantitative procedure can be performed in the same flask. The quantitative results obtained were statistically compared with those obtained with the method indicated by the Brazilian Pharmacopoeia, using the Student’s t and the F tests. Considering the concentration in a 100 µL aliquot, the qualitative visual limit of detection is about 5×10⁻⁶ g; instrumental LOD ≅ 1.4×10⁻⁴ mol L-1 ; LOQ ≅ 4.5×10⁻⁴ mol L-1.
Keywords: dipyrone, spot-test, analysis, qualitative, quantitative
introduction
Dipyrone (sodium salt of 1-phenyl-2,3-di- methyl-4-methylaminomethane-sulfonate-5-pyra-zolone) (Fig. 1) is a water-soluble pyrazolone de-rivative widely used in therapeutics as a analgesic, antipyretic and antispasmodic drug [1]. Dipyrone was developed in Germany and was introduced into clinical practice in 1922. It is still in use in many countries for adults and children, where it is sold as an over-the counter (OTC) painkiller [2,3]. Due to its strong analgesic effect, available paren-teral formulation, and low cost, dipyrone is wide-ly used, generating a consumption of more than 10 thousand tons/year. Dipyrone is very popular in Brazil and is marketed in the sodium salt form or as the magnesium salt, as well as in association with other drugs [4]. However, the use of dipy-rone was proscribed more than twenty years ago in the U.S.A. due to its putative role in depressing bone marrow, causing aplastic anemia and
agran-ulocytosis. However, this has been criticized by many authors [2,4,5].
Figure1. Structural formula of dipyrone.
The metabolism of dipyrone has been re-cently reviewed. It was demonstrated that it inhi-bits cyclooxygenase (COX). However, in contrast
Ecl. Quím., São Paulo, 35(1): 41 - 46, 2010 42
Artigo Article
Ecl. Quím., São Paulo, 35(1): 41 - 46, 2010 43
Artigo Article
to classical COX-inhibitors, such as aspirin-like
drugs, dipyrone has no anti-inlammatory effect
and a low gastrointestinal toxicity, indicating a different mode of action. The authors suggested that the pharmacologically active metabolites of dipyrone inhibit COX activity by sequestering radicals that initiate the catalytic activity of this enzyme or through the reduction of the oxidized states of the COX protein [6]. After oral intake,
it is spontaneously hydrolyzed in the gastric luid
to its main metabolite, 4-methylaminoantipyrine (4-MAA), which is rapidly and nearly completely absorbed. 4-MAA is then converted to variety of metabolites by various enzymatic reactions. The
effect of dipyrone occurs approximately ifteen
minutes after oral administration. The biotransfor-mation takes place at the hepatic level, the dura-tion of this effect is approximately 4-6 hours, and its elimination occurs at the renal level [7].
Recently, additional beneicial effects of
dipyrone, such as vascular smooth muscle rela-xation, and as antiapoptotics and anticolvulsants, have been reported and have increased the interest in dipyrone [3].
A great problem related with
pharmaceuti-cal products around the world is falsiication. The -se incidents probably occur more frequently in de-veloping and poor countries but certainly Europe and United States are not completely free of them. In Brazil the problem was denounced some years ago [8,9] and involved antibiotics, contraceptives, cancer medicines and also common analgesics and antipyretics like dipyrone and aspirin. There is suspicion that such anomalies still remain. From these considerations, it is clearly apparent that it is very important to develop quick, simple, relia-ble and low cost analytical procedures that could be used routinely for screening examinations to
detect possible falsiications.
Some methods have been developed for dipyrone determination, such as titrimetry [1], HPLC [10], spectrophotometry [11-15], poten-tiometry [16], amperometry [17,18], turbidimetry
[19], voltammetry [20], and relectometry [21].
The iodometric titration of dipyrone is recommen-ded by the Pharmacopoeia [1] but this procedure is very slow and laborious, thus less applicable to large-scale analysis.
The aim of the present work is to develop a simple and reliable spectrophotometric method for the qualitative spot-test [22] associated with a rapid quantitative sequential analysis of dipyrone in pharmaceutical preparations. A similar qualita-tive procedure has been reported [23] but in the present work the sequential quantitative analysis using iron III as catalyst was developed. The me-thod is based on the selective oxidation of dipyro-ne, a characteristic reaction of a pyrazolodipyro-ne, in the presence of concentrated sulfuric acid, splitting off formaldehyde which reacts with chromotropic acid producing a reddish-violet compound [11]. The sulfuric acid addition promotes the oxidation of dipyrone and guarantees the temperature neces-sary for the reaction, to occur, as it interacts with the small quantity of water intentionally added in order to take advantage of the highly exothermic process of the hydration of this acid. The
forma-tion of the reddish-violet compound identiies the
dipyrone. In case of positive qualitative result the quantitative analysis can be sequentialy perfor-med.
experimental
Reagents
All chemicals were of analytical
gra-de and were used without further puriication.
Concentrated sulfuric acid (96%) was obtained from Synth®. Chromotropic acid (disodium salt, dihydrate, C10H6O8S2Na2.2H2O) and dipyrone (C13H16N3NaO4S) were obtained from Sigma-Al-drich®. Distilled water was obtained from a glass distillation device.
Pharmaceutical dosage forms of dipyrone were purchased from reliable drugstores. The commercial tablets comprising dipyrone tested were: - Novalgina (500 mg); Conmell (320 mg); Anador (500 mg); Lisador (500 mg); Buscopan (250 mg) and Generic Medley (500 mg).
Solutions
Chromotropic acid solution: prepared daily by dissolving 0.2002 g of chromotropic acid in 5 mL of distilled water, in order to obtain a 0.1mol L 1 concentration.
iron (iii) chloride 0.1 mol L-1 solution: to prepare 25 mL of a 0.1 mol L-1solution about 0.67 g of analytical grade (Vetec®) FeCl3.6H2O were
dissolved in a volumetric lask.
Standard dipyrone solution: prepared by dissolving an adequate mass of dipyrone in 50.0 mL of distilled water, in order to obtain a 0.1mol L 1 concentration. From this solution, by appro-priate dilutions, the other solutions of the dipyro-ne were prepared.
Sample preparation: Twenty tablets were powdered in a mortar after weighing. An accura-tely weighed portion of one tablet, equivalent to about 15 mg of anhydrous dipyrone, was
dissol-ved in 10.0 mL of water, in a volumetric lask, to
obtain a solution with a concentration of approxi-mately 4.5 × 10 -3 mol L-1.
Procedure
Add, with a micro spatula, to the tube
(straight walled volumetric lask of 5.0 mL) about
2 to 3 mg of solid chromotropic acid. Transfer
ca-refully 100 μL of dipyrone solution into this tube.
Gently dissolve the chromotropic acid. Add a drop of the 0.1 mol L-1 iron (III) chloride solution and
homogenize. Then add 500 μL of good quality
concentrated sulfuric acid. The acid should be rapidly added, all at once. Shake the tube care-fully in order to homogenize. If a reddish-violet color appears the test is positive for dipyrone. To sequentially perform the quantitative analysis the volume is completed to 5.0 mL with water. The absorbance is measured at 576 nm using the
volu-metric lask as the spectrophotovolu-metric cell. Alter -natively spectrophotometric cuvettes can be used.
Apparatus
A Femto 600 single beam spectrophotome-ter was used for all absorbance measurements. The absorbance measurements were performed using a
straight walled volumetric lask also used for the
reaction. Spectrophotometric glass cuvettes 1.00 cm optical path were also used.
The 5.00 mL straight walled volumetric
lask used is essentially an adequately calibrated
tube with 11 cm total height, 1.0 cm ID, 1.4 cm
OD and itted with a stopper to allow shaking wi -thout losing solution. It is similar to the usual 1.0
and 2.0 volumetric lasks. This format was used in
order to promote the most intimate contact of the analyte and of the reagents due to the format and
to the dimensions of the bottom of the lask.
As the volumetric tubes were not of optical
quality their transmittance (illed with water) at 576 nm was compared. No signiicant difference
was observed and, therefore, they were used wi-thout necessity of any correction in the measured absorbances.
Volume measurements of the aliquots and of the sulfuric acid were done using Eppendorf® micropipettes.
Reference method
To analyze the samples by the classic
iodometric method, the preparation procedure
recommended by the Brazilian Pharmacopoeia
[1] was used.
Statistical analysis
The statistical t-Student test and the F tests [24] were applied to compare the recovery results obtained by the two analytical methods, the pro-posed and the titrimetric ones [1].
results and Discussion
Ecl. Quím., São Paulo, 35(1): 41 - 46, 2010 44
Artigo Article
Ecl. Quím., São Paulo, 35(1): 41 - 46, 2010 45
Artigo Article
the oxidation probably begins with the isomeric methoxy form of the pyrazolone [22]. The
for-maldehyde formed is identiied by reacting it with
warm chromotropic acid, yielding a red-violet co-lor [22]. The nature of this chromogen has never been unambiguously determined but some expe-rimental evidence suggests the hypothesis that it has a mono-cationic dibenzoxanthylium structure [26]. In this work, we use the highly exothermic hydration process of the sulfuric acid and its very low heat capacity to provoke the necessary tem-perature increase for the reaction to occur [23]. In order to accelerate the reaction iron III was used as catalyst. A drop of a 0.1 mol L-1 iron (III) chlo-ride solution was added directly in the solution containing the dipyrone with the chromotropic acid. When the sulfuric acid is added, the increase of the reaction rate can be visually observed when compared to the reaction without the addition of iron III.
The absorption spectrum of the reaction
product was obtained using the inal solution in the volumetric lask. With the deined working
conditions the maximum absorption wavelength was observed at 576 nm.
The stability of the product formed was stu-died over time. Measurements performed 15 days later showed that the reddish-violet compound formed is completely stable in this time interval when stored at ambient temperature (ca. 25 oC).
The molar ratio of the analyte to the analytical reagent and the volume ratio of the con-centrated sulfuric acid were investigated. The best conditions were: 1:10 ratio of dipyrone to chro-motropic acid using 500 µL of concentrated sul-furic acid.
The absorbance was measured at 576 nm
using the volumetric lask as spectrophotometric
cell. These results were compared with those ob-tained with spectrophotometric cuvettes.
The calibration curves were constructed in the range from 1.0 × 10⁻³ mol L-1 to 6.0 × 10 3 mol L-1 considering the concentration in the aliquot. They can be described by the equations: a) A = 0.15 + 110 C (r=0.999) where A is the absorbance at 576 nm and C is the concentration in mol L-1 in the aliquot; when using the spectrophotometer
with the straight walled volumetric lask and b) A
= 0.16 + 114 C (r=0.998) with the cuvettes.
For both procedures, using the volumetric tubes for spectrophotometric measurements or using the cuvettes, the instrumental limits of de-tection, LOD, and of quantitation, LOQ, are: LOD
≅ 1.4 × 10⁻⁴ mol L-1 (LOD ≅ 3.3 SD / slope); limit of quantitation LOQ ≅ 4.5 × 10⁻⁴ mol L-1 (LOQ
≅ 10 SD / slope). The visual qualitative limit of detection is about 5 × 10⁻⁶ g of dipyrone in the aliquot.
Alternatively, in order to obtain results more rapidly, a simple proportional calculation can be done using as standard a solution prepa-red with the expected concentration of dipyrone in the sample. If the obtained result for the sample is within the established limits, the pharmaceutical preparation can be considered in conformity with the pharmacopoeia recommendations.
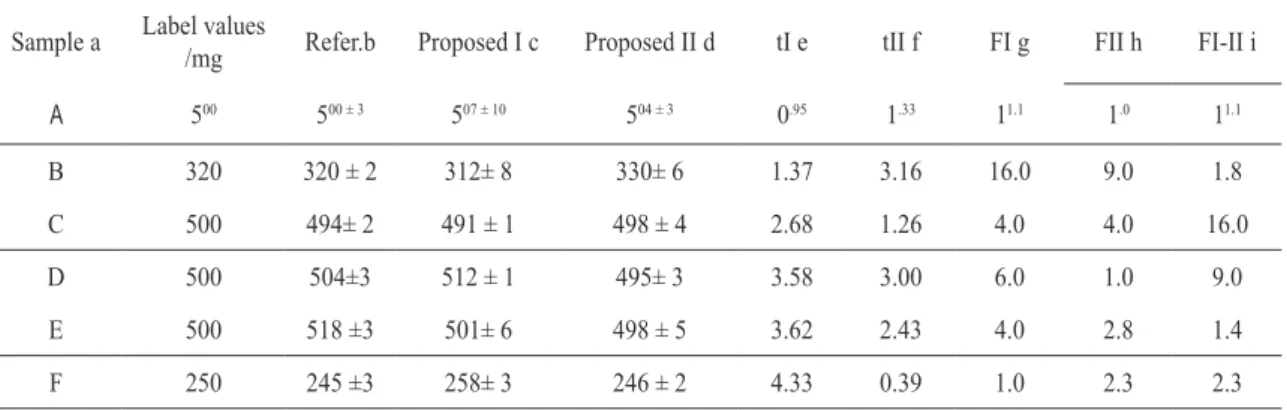
In order to test the proposed method six commercial pharmaceutical preparations, pur-chased in local pharmacies, were analyzed. The results were compared with those obtained with the titrimetric procedure recommended by the Brazilian Pharmacopoeia [1], using the paired Student’s statistical t test and the Ftest [24]. As it
can be observed in Table 1, for a conidence coe
-ficient of 0.05, in four cases values of t, slightly higher than the theoretical value, were obtained. However, the F test shows complete agreement in
all cases. For the conidence coeficient of 0.01
complete agreement was achieved in the Student’s t and in the F tests.
table 1. Comparison, using the paired statistical t test of Student and the F test, between the results obtained with the titrimetric Brazilian Pharmacopoeia procedure and those obtained with the method proposed in this work.
Sample a Label values
/mg Refer.b Proposed I c Proposed II d tI e tII f FI g FII h FI-II i
A 500 500 ± 3 507 ± 10 504 ± 3 0.95 1.33 11.1 1.0 11.1
B 320 320 ± 2 312± 8 330± 6 1.37 3.16 16.0 9.0 1.8
C 500 494± 2 491 ± 1 498 ± 4 2.68 1.26 4.0 4.0 16.0
D 500 504±3 512 ± 1 495± 3 3.58 3.00 6.0 1.0 9.0
E 500 518 ±3 501± 6 498 ± 5 3.62 2.43 4.0 2.8 1.4
F 250 245 ±3 258± 3 246 ± 2 4.33 0.39 1.0 2.3 2.3
aOther components present in the pharmaceutical preparation besides dipyrone:
A- magnesium stearate; macrogol;
B - starch; lactose; talc; magnesium stearate; C - hypromelose; polyvidone; silicon dioxide; su-crose; quinoline yelow; starch; talc; magnesium stearate;
D - prometazin hydrochloride, adiphenine hydro-chloride, magnesium stearate; silicon dioxide; talc; starch; sucrose;
E - silicon dioxide; magnesium stearate; polyvi-done, magnesium silicate;
F - hyoscine butylbromide, calcium phosphate dibasic; starch; silicon dioxide; tartaric acid; ste-aric acid; polyvidone; sucrose; talc; gum arabic; titanium dioxide; macrogol;carnauba wax; white wax.
b Reference titrimetric method [1].
c Proposed method I, using straight volumetric tubes.
d Proposed method II, using spectrophotometric cuvettes.
e Paired calculated Student’s t values, comparing the proposed method I with the reference titrimet-ric method.
f Paired calculated Student’s t values, comparing the proposed method II with the reference titri-metric method.
gF values comparing method I with reference tit-rimetric method.
hF values comparing method II with reference tit-rimetric method
iF values comparing method I with method II.
Theoretical: Students’st= 2.78 (conidence coef
-icient, α=0.05) and 4.60 (conidence coeficient,
α=0.01) for the degree of freedom ν= 4 (ν= n1 + n2 -2); n1 = n2 = 3; F = 19.00 (α=0.05).
Conclusion
The analytical method described in this work, despite the complexity of the analyte, pres-ents extreme chemical and instrumental simplic-ity, very low cost, quite good accuracy and pre-cision, rapidity and reliability. The quantitative
determination can be performed in less than ive
minutes. Therefore, considering these characteris-tics, it can be suggested for the determination of dipyrone in the bulk drug and in pharmaceutical preparations.
Acknowledgements
The authors are grateful to CNPq
(Conse-lho Nacional de Pesquisa Cientíica e Tecnológi -ca), to FAPESP (Fundação de Amparo à Pesquisa
do Estado de São Paulo) for inancial support and
Ecl. Quím., São Paulo, 35(1): 41 - 46, 2010 46
Artigo
Article www.scielo.br/eq
Volume 35, número 1, 2010
47
resumo: Um método “spot-test” qualitativo e seqüencialmente quantitativo é proposto para análise de dipirona em fármaco “puro” e em preparações farmacêuticas. A formação de colora-ção vermelho-violeta indica um resultado qualitativo positivo. Na seqüência, um procedimento quantitativo pode ser realizado no mesmo frasco. Os resultados quantitativos obtidos foram comparados estatisticamente com os resultados obtidos pelo método indicado pela Farmaco-péia Brasileira, utilizando o teste t de Student e o teste F. Considerando a concentração em uma alíquota de 100 µL, o limite qualitativo visual de detecção foi de cerca 5×10⁻⁶ g; instru-mentalmente o limite de detecção foi de LOD ≅ 1.4×10⁻⁴ mol L-1 e o limite de quantificação de LOQ ≅ 4.5×10⁻⁴ mol L-1.
Palavras-chave: dipirona, spot-test, análise, qualitativa, quantitativa
references
[1] Brazilian Pharmacopoeia, 3rd ed., Organização Andrei Editora, São Paulo, Brazil, 1977, p 406-8.
[2]I.M.Benseñor, São Paulo Med. J., 119 (2001) 190. [3] H. Ergün, D. A. C. Frattarelli and J. Aranda, J. Pharma-C. Frattarelli and J. Aranda, J. Pharma-ceut. Biomed., 35 (2004) 479.
[4] P. Danielli, and M.B Leal, Rev. Bras. Farm.,84 (2003) 17.
[5] Y. Bentur, and O. Cohen, J. Toxicol.-Clin. Toxic., 42 (2004) 261.
[6] S. C. Pierre, R. Schmidt, C. Brenneis, M. Michaelis, G. Geisslinger, and K. Scholich, Br. J. Pharmacol., 151 (2007) 494.
[7] G. Suarez-Kurtz , F.M. Ribeiro, R.C.E. Estrela, F.L. Vi-cente, and C J. Struchiner, Braz. J. Med. Biol. Res., 34 (2001) 1475.
[8]Brasil, Anvisa, Agência Nacional de Vigilância Sanitária, Rev. Saúde Pública, 38 (2004) 748.
[9] F.G.D. Vieira, J. M. Crubellate, I.G. Silva, and
W.R. Silva, RAE eletron.,1 (2002) 1.
[10]
H.Senyuva, I. Aksahin, S. Ozcan, and B.V. Kabasakal, Anal. Chim. Acta, 547 (2005)73-7.[11] K.A. Sakiara, L. Pezza, C. B. Melios, H. R. Pezza, and M. Moraes, Farmaco, 54 (1999) 629.
[12] J. L. F. C. Lima, S. M. O. Sá, J. L. Santos, and E. A. G. Zagatto, J. Pharmaceut. Biomed.,32 (2003)1011.
[13] L. H. Marcolino Jr, R. A. Souza, O. Fatibello Filho, and F.C. Moraes, Anal. Lett., 38 (2005) 2315.
[14] A.V. Pereira, L. Penckowski, M. Vosgerau, and M. F. Sassá, Quím. Nova 25 (2002)553.
[15] A. P. Nascimento, M. G. Trevisan, E. R. M. Kedor-Hack-mann, and R. J. Poppi, Anal. Lett., 40 (2007) 975.
[16] J. S. Albuquerque, V. L. Silva, F. Lima, A. Araújo, and M. C. B. S. M.Montenegro, Anal. Sci., 19 (2003) 692
[17] T. R. L. C. Paixão, C. R. Matos, and M. Bertotti, Talanta, 61 (2003) 725.
[18] E. P. Medeiros, S.L. Castro, F. M. Formiga, S. R. B. San-tos, M. C. U. Araújo, and V. B. Nascimento, Microchem. J.,
78 (2004) 91.
[19] L. H. Marcolino Jr, V. G. Bonifácio, and O. Fatibello Filho, Quím. Nova, 28 (2005) 783.
[20] M. F. S Teixeira, L. H. Marcolino Jr., O. Fatibello Filho, E. R. Dockal, and E. T. G. Cavalheiro, J. Braz. Chem. Soc.,
15 (2004) 803.
[21] P. L.Weinert, L. Pezza, and H.R. Pezza, J. Braz. Chem. Soc., 18 (2007) 846
[22] F. Feigl, Spot Tests in Organic Analysis, 7th ed., Elsevier, Amsterdan, 1966, p. 434-36 and 635.
[23] L. Pezza, M. Tubino, C. B. Melios, and H. R. Pezza, Anal. Sci., 16 (2000) 313.
[24] K. Eckschlager, Errors, Measurement and Results in Chemical Analysis, Van Nostrand Reinhold Company, Lon-don, 1972, p. 109-120.
[25] P. Karrer, Organic Chemistry, 4th ed.; Wiley, New York, 1950, p. 798.
[26] P. E. Georghiou, and C.K. Ho, Can. J. Chem., 67 (1989) 871
Artigo/Article
ProDuCtion oF BioDieSeL From BABASSu oiL
uSing metHAnoL-etHAnoL BLenDS
F. C. Silva A*, K. S. B. Cavalcante A,B, H. C. Louzeiro A,B, K. R. M. Moura A, A. P. Maciel A, L. E. B. Soledade B, A. G. Souza B
a Departamento de Química, universidade Federal do Maranhão, uFMA, Avenida dos Portugueses s/n, Campus Bacanga, CEP
65080-040, São Luís, MA, Brazil.
b Departamento de Química, universidade Federal da Paraíba, uFPB, Campus i, Cidade universitária, CEP 58059-900, João Pessoa,
PB, Brazil.
* Corresponding author. Phone: +55-98-2109-8277 E-mail address: [email protected]
Abstract: Maranhão state in Brazil presents a big potential for the cultivation of several olea-ginous species, such as babassu, soybean, castor oil plant, etc... These vegetable oils can be transformed into biodiesel by the transesterification reaction in an alkaline medium, using methanol or ethanol. The biodiesel production from a blend of these alcohols is a way of adding the technical and economical advantages of methanol to the environmental advantages of ethanol. The optimized alcohol blend was observed to be a methanol/ethanol volume ratio of 80 % MeOH: 20 % EtOH. The ester content was of 98.70 %, a value higher than the target of the ANP, 96.5 % (m/m), and the biodiesel mass yield was of 95.32 %. This biodiesel fulfills the specifications of moisture, specific gravity, kinematic viscosity and percentages of free alcohols (methanol plus ethanol) and free glycerin.
Keywords: Babassu oil, methanol, ethanol, methyl esters, ethyl esters.
i. introduction
Babassu nut is the main product of the vege-tal extractive activities in Maranhão state, Brazil, and one quarter of its territory is covered by such native palm tree (Orbignya phalerata). The activi-ties related to the babassu nut generate about 300 thousand jobs, from the collect normally made by
the “babassu breakers”, up the oil reining [1,2].
Maranhão is the biggest producer of ba-bassu nuts in Brazil. It is responsible for the production of almost 80% of the country output, corresponding to 120 thousand metric tons in the 2005 base year. [3]. The local industries produce about 60 thousand metric tons /year of babassu oil, being most of it transported to other Brazilian states [4].
Babassu oil displays a high percentage of saturated fatty acids, 91%, mainly composed of lauric acid (48%), myristic acid (16%), palmitic acid (10%), stearic acid (2%) and others (5%). It also presents 19% of unsaturated fatty acids,
chie-ly oleic (14%) and linoleic (5%) acids [5].
Maranhão is also the second biggest soy-bean producer in Northeastern Brazil, only behind Bahia state. In the 2006/2007 harvest, according to CONAB, the soybean production in Maranhão was of about 0.967 million metric tons, while the whole Brazilian output was of around 56.71 million metric tons [6].
Besides these two cultures, Maranhão dis-plays a big potential for the cultivation of other oleaginous species (castor oil plant, cotton, tame nut, etc.), due to its weather conditions,