Available online at www.ijpsdr.com
International Journal of Pharmaceutical Sciences and Drug Research 2011; 3(1): 62-66
62
Research Article
ISSN 0975-248X
A Validated HPTLC Method for Simultaneous Quantification of
Nebivolol and Hydrochlorothiazide in Bulk and Tablet Formulation
S. T. Kumbhar
*, G. K. Chougule, V. S. Tegeli, G. B. Gajeli, Y. S. Thorat, U. S. Shivsharan
DSTSM’s College of Pharmacy, Vijapur Road-1, Jule Solapur, Solapur, Maharashtra-413003, India
ABSTRACT
A HPTLC method for the estimation of Nebivolol (NBV) and Hydrochlorothiazide (HCTZ) has been developed. It employs aluminum backed silica gel 60 F254 TLC plates, (20 cm × 10 cm, layer thickness 0.2 mm) pre-washed with
methanol and mobile phase comprising of 1,4-dioxane: toluene: triethylamine (5:3:0.1 v/v). The developing solvent was run up to 80 mm in Camag chamber previously saturated with 10.0 ml of solvent mixture for 30 min. Densitometric scanning was then performed with Camag TLC Scanner-3 equipped with winCATS (version 1.3.0) at λ max 281 nm. The Rf
values were found to be 0.75 and 0.43 for Nebivolol and Hydrochlorothiazide respectively. The limit of detection and limit of quantitation were found to be 43ng/spot & 130ng/spot for Nebivolol and 25ng/spot & 76ng/spot for Hydrochlorothiazide respectively. The % RSD of intra-day variation and inter day variation were 0.54 and 0.41 respectively for NBV and 0.46 and 0.39 for HCTZ respectively. The proposed method can also be used for routine quality control to accurately determine Nebivolol and Hydrochlorothiazide in bulk and tablet dosage form.
Keywords: HPTLC, Nebivolol (NBV), Hydrochlorothiazide (HCTZ), analytical method development, method validation.
INTRODUCTION
β-blockers constitute one of the most frequently prescribed group of cardiovascular drugs. Nebivolol hydrochloride
(NBV) is chemically known as α, α - [iminobis(methylene)]bis[6-fluoro-3,4-dihydro-2H-1-benzopyran-2-methanol] hydrochloride. It is a highly selective β1-blocker with nitric oxide mediated vasodilatory actions and beneficial effects on vascular endothelial function. Nebivolol is used in the management of hypertension. [1-2] Various analytical methods have been reported for determination of nebivolol including UV spectrophotometry [3], HPLC [4-10], LC-MS [11], HPTLC [12-14]. Hydrochlorothiazide (HCTZ) is chemically known as 6- chloro-3,4-dihydro-7-sulfamoyl-2H-1,2,4-benzothiadiazine-1,1-dioxide. It is a thiazide diuretic & increases sodium and chloride excretion in distal convoluted tubule. Literature survey reveals that few UV [15-17]and HPLC [18-21] methods have been reported for determination of hydrochlorothiazide. The combination of NBV and HCTZ is choice for treatment of many low rennin hypertensions. Some methods are reported for the combination of Nebivolol and Hydrochlorothiazide including UV [22-24], HPLC [25-26] and HPTLC [27]. The purpose of this investigation was to develop
*Corresponding author: Mrs. Smita T. Kumbhar,
DSTSM’s College of Pharmacy, Vijapur Road-1, Jule Solapur, Solapur, Maharashtra-413003, India;
E-mail: [email protected]
and validate a simple, rapid, sensitive, precise, accurate and specific reverse phase HPTLC method.
MATERIALS AND METHOD Instruments
CAMAG (Muttenz, Switzerland) HPTLC system including a Linomat V Applicator, Camag TLC Scanner-3 and winCATS data processor (version 1.3.0) was used. Shimadzu AUX -120 balance was employed for weighing samples.
Chemicals and materials
NBV and HCTZ were kindly supplied by Cadila Pharmaceuticals Ltd., Ahemdabad. 1, 4-dioxane, toluene & triethylamine used were of analytical grade from E-Merck Ltd.
Preparation of standard stock solution of Nebivolol
Accurately weighed quantity of about 100 mg NBV was transferred to 100 ml volumetric flask. It was dissolved in sufficient quantity of methanol and the volume was made up to the mark with the same solvent to get concentration of 1000 µg/ml of NBV.
Preparation of standard stock solution of Hydrochlorothiazide
Accurately weighed quantity of about 40 mg HCTZ was transferred to 100 ml volumetric flask. It was dissolved in methanol and the volume was made up to the mark with the same solvent to get concentration of 400µg/ml of HCTZ.
The experiment was performed on a aluminum backed silica gel 60 F254TLC plates, (20 cm × 10 cm, layer thickness 0.2
mm) prewashed with methanol and mobile phase comprising of 1, 4-dioxane: toluene: triethylamine (5:3:0.1 v/v). The developing solvent was run upto 80 mm in Camag chamber previously saturated with 10.0 ml of solvent mixture for 30 min. Samples were applied at a distance of 10 mm from lower edge as 6 mm wide bands at a spraying rate of 15s µl-1; and the distance between the bands was 11.6 mm. The developing solvent was run upto 80 mm, and the development was performed at 25 ± 2°C. The average development time was 15 minutes. After development, the plate was dried at 50°C in an oven for about 5 minutes.
Densitometry scanning was then performed at λ max 281 nm
with Camag TLC scanner 3 equipped with winCATS software version 1.3.0, using deuterium light source and the slit dimensions were 6.00 × 0.45 mm. A typical HPTLC chromatogram is shown in Fig. 1. The chromatographic parameters are given in Table 1.
Table 1: Chromatographic conditions
Parameter Specification
Stationary Phase
Aluminium backed silica gel 60 F254TLC plates, (20 cm × 10 cm, layer thickness 0.2 mm, E-Merck, Darmstadt, Germany) pre-washed with
methanol.
Mobile phase 1,4-Dioxane: Toluene: Triethylamine (5:3:0.1
v/v)
Chamber saturation 30 min
Migration distance 80 mm
Band width 6 mm
Slit dimensions 6.00 × 0.45 mm
Radiation source Deuterium lamp
Scanning wavelength 281 nm
Spraying Rate 15s µl-1
Distance between bands 11.6 mm
Fig. 1: Densitogram of standard HCTZ (400 ng/spot): peak 1 (Rf0.43 ±
0.02), NBV (1000 ng/spot): peak 2 (Rf 0.750.02)
Linearity study for NBV
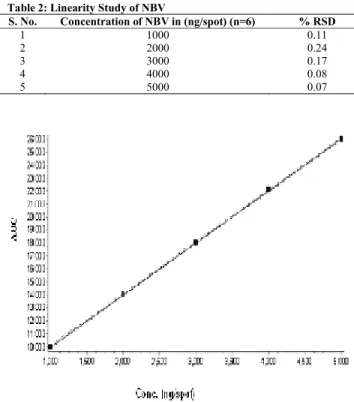
Standard solution 1-5µl (1000-5000 ng/spot) was applied on TLC plate with the help of microlitre syringe, using Linomat V sample Applicator. The plate was developed as per mentioned chromatographic conditions. Each concentration was spotted six times on the plate. Peak area was recorded for each concentration level of drug and calibration curve was obtained by plotting peak areas against concentration of NBV. The observations are given in Table 2. A typical calibration curve is shown in Fig. 2.
Table 2: Linearity Study of NBV
S. No. Concentration of NBV in (ng/spot) (n=6) % RSD
1 1000 0.11
2 2000 0.24
3 3000 0.17
4 4000 0.08
5 5000 0.07
Fig. 2: Calibration curve for NBV
Coefficient of correlation=0.9999, slope = 4.01, Y= 5985.3, X= 1492.6
Linearity study for HCTZ
Standard solution 1-5µl (400-2000 ng/spot) was applied on TLC plate with the help of microlitre syringe, using Linomat V sample Applicator. The plate was developed as per mentioned chromatographic conditions. Each concentration was spotted six times on the plate. Peak area was recorded for each concentration level of drug and calibration curve was obtained by plotting peak areas against concentration of HCTZ. The observations are given in Table 3. A typical calibration curve is shown in Fig. 3.
Table 3: Linearity Study of HCTZ
S. No. Concentration of HCTZ in (ng/spot) (n=6) % RSD
1 400 0.86
2 800 0.41
3 1200 0.23
4 1600 0.16
5 2000 0.12
Fig. 3: Calibration Curve for HCTZ
Simultaneous estimation of NBV and HCTZ from laboratory mixture
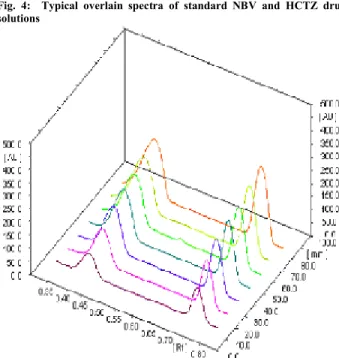
Accurately weighed quantity 100 mg of NBV and 40 mg HCTZ was transferred to 100 ml volumetric flask. It was dissolved in methanol and volume was adjusted to mark. Appropriate volume (3µl, containing 3000 ng of NBV and 1200 ng of HCTZ) was spotted for assay. Typical overlain chromatogram of NBV and HCTZ is shown in Fig 4. A 3D reproducibility spectrum is shown in Fig 5. The concentration was determined by regression analysis. The results are shown in Table 4.
Table 4: Analysis of NBV and HCTZ in laboratory mixture Components Amount taken in
(ng/spot) (n=6)
Amount found
(%)* % RSD
NBV 3000 99.94 ± 0.09 0.09
HCTZ 1200 99.98 ± 0.23 0.23
*Mean ± SD
Fig. 4: Typical overlain spectra of standard NBV and HCTZ drug solutions
Fig. 5: 3D spectra of NBV and HCTZ in standard drug solutions
Application of the proposed method for estimation in tablet dosage form
An accurately weighed tablet powder equivalent to 100 mg NBV and 40 mg HCTZ was transferred to 100 ml volumetric flask containing 40 ml methanol, sonicated for 10 min and volume was adjusted to mark with same solvent. The resulting solution was filtered using Whatmann filter. Appropriate aliquot portion (3µl, containing 3000 ng of NBV and 1200 ng of HCTZ) was spotted for assay. The concentration was determined by regression analysis. The results are shown in Table 5.
Table 5: Assay of NBV and HCTZ
Components Amount found (%)* (n=6) % RSD
NBV 99.0 ± 0.31 0.31
HCTZ 98.9 ± 0.48 0.48
*Mean ± SD
METHOD VALIDATION
The proposed method was validated according to ICHQ2B guidelines for validation of analytical procedures. The solutions of the drugs were prepared as per the earlier adopted procedure given in the experiment.[28]
Recovery study
It was done by using standard addition method at 80, 100 and 120 % level. Known amount of standard stock solution of NBV and HCTZ was added to pre-analyzed sample (2000 ng of NBV and 800 ng of HCTZ) and subjected to the proposed HPTLC method. The results are shown in Table 6.
Table 6: Results of Recovery Studies Componen
ts
Initial Amount
(ng/µl)
Amount added (ng/µl)
(n=3)
% Recovere
d
% RSD
NBV
2000 0 99.8 0.05
2000 1600 100.1 0.77
2000 2000 99.9 0.03
2000 2400 100.2 0.04
HCTZ
800 0 101.1 0.65
800 640 99.8 0.17
800 800 100.2 0.25
800 960 99.9 0.26
Precision study (Intra-day and Inter-day)
Precision was determined as intra-day and inter-day precision. Intra-day precision was determined by analyzing 3000, 4000, & 5000 ng/spot (NBV) and 1200, 1600, 2000 ng/spot (HCTZ) for three times on the same day. Inter-day precision was determined by analyzing 3000, 4000, & 5000 ng/spot (NBV) and 1200, 1600, 2000 ng/spot (HCTZ) for three consecutive days over µa period of week. The results are shown in Table 7.
Table 7: Results of Precision (Intra-day and Inter-day)
Drug Concentration ng/spot
Intra-day Precision %RSD (n=6)
Inter-day Precision %RSD (n=6)
NBV
3000 0.01 0.02
4000 0.04 0.06
5000 0.07 0.04
HCTZ
1200 0.03 0.08
1600 0.05 0.03
2000 0.06 0.07
Repeatability
plate. The separated spots were scanned 7 times without changing the positions of the plate. % RSD for measurements of peak areas was calculated and shown in Table 8.
Table 8: Results of Repeatability Studies
S. No Application volume [µl]
% RSD NBV [4000 ng/spot]
(n=7)
% RSD of HCTZ [1600 ng/spot]
(n=7)
1 4 0.13 0.58
Specificity
The mobile phase designed for the method resolved both the drugs very efficiently. The Rf values of NBV and HCTZ
were found to be 0.75 and 0.43 respectively. The peak purity of NBV was tested by correlating the spectra of NBV at the peak start (S), peak apex (M) and at the peak end (E) positions. Correlation between these spectra indicates purity of NBV peak {correlation r (S, M) = 0.996, r (M, E) = 0.999. Same procedure was followed for HCTZ. Correlation between these spectra indicate the purity of HCTZ peak {correlation r (S, M) = 0.997, r (M, E) =0.999}. Thus, it can be concluded that there was no interference due to impurities or degradation products.
Sensitivity
The sensitivity was estimated in terms of the Limit of Quantitation (LOQ) and Limit of Detection (LOD). The LOQ and LOD were calculated using equation LOD = 3.3 x N/B and LOQ = 10 x N/B, where, N is standard deviation of the peak areas of the drugs (n=3), taken as a measure of noise, and B is the slope of the corresponding calibration curve. The LOQ and LOD for NBV were found to be 130 ng/spot and 43 ng/spot, respectively. For HCTZ, LOQ and LOD were found to be 76 ng/spot and 25 ng/spot, respectively.
Ruggedness and Robustness
Ruggedness of the method was performed by applying 4000 ng and 1600 ng (n=6) for NBV and HCTZ by two different analyst keeping same experimental and environmental conditions.
Robustness of the method was performed at same concentration mentioned above for ruggedness by changing migration distance. The results are summarized in Table 9 & 10.
Table 9: Results of Ruggedness Studies Amount found of NBV [%] %RSD (n=6) Amount found of HCTZ [%] %RSD (n=6)
Analyst I 99.8 0.7 101.5 0.3 Analyst II 99.6 0.2 99.4 0.6
Table 10: Results of Robustness Studies Development distance [cm] Amount found of NBV [%] %RSD (n=6) Amount found of HCTZ [%] %RSD (n=6)
7 99.8 0.98 99.5 0.09
7.5 99.0 0.7 99.3 0.58
8 99.6 0.6 99.9 0.69
RESULTS AND DISCUSSION
The peak area was observed to be dependent on the amount of the standard, NBV and HCTZ and a linear relationship (r = 0.9992, 0.9998 respectively) was found between the peak areas of NBV and HCTZ at various concentrations over the range 1000-5000 ng, 400-2000 ng respectively. The solvent system used for development of the plates produced no interfering peaks in the area under the curve. The Rfvalues of
NBV and HCTZ under the conditions used were found to be 0.740.02 and 0.140.02 and spots were quantified at a wavelength of 281 nm. The LOD and LOQ were found to be 43ng/spot & 130ng/spot for Nebivolol and 25 ng/spot & 76 ng/spot for Hydrochlorothiazide respectively. The % RSD of intra-day variation and inter day variation were 0.54 and 0.41 respectively for NBV and 0.46 and 0.39 for HCTZ respectively.
The developed HPTLC method is simple, precise, specific and accurate for simultaneous estimation of NBV and HCTZ in bulk and tablet dosage form. The statistical analysis proves that method is reproducible and selective for the analysis of NBV and HCTZ indicating non-interference of excipients in the estimation. This method does not require an internal standard. The proposed method could be applied for routine analysis in a quality control laboratory.
ACKNOWLEDGEMENT
Authors are thankful to the Principal, DSTS Mandal’s College of Pharmacy, Solapur for providing the necessary facilities.
REFERENCES
1. Budavari S. The Merck Index: An Encyclopedia of Chemicals, Drugs and biologicals. 13th ed. Whitehouse Station (NJ): Merck Research Lab. Division of Merck 2001, pp. 854.
2. Sweetman SC, Martindale, The Complete Drug Reference, London; Pharmaceutical Press; Division of the Royal Pharmaceutical Society of Great Britain, 2007.
3. Chaudhary AB, Patel RK, Chaudhary SA. Estimation of Valsartan and Nebivolol in pharmaceutical dosage forms by absorption ratio method. Int. J Res. Pharm. Sci. 2010; 1: 108-112.
4. Yilmaz B. Reverse Phase HPLC Method for Determination of Nebivolol in Pharmaceutical Preparations. Int. J of Pharma. Sci. Review and Res. 2012; 1:14-17.
5. Kachhadia PK, Doshi AS, Joshi HS. Development and validation of
a stability-indicating column high-performance liquid
chromatographic assay method for determination of Nebivolol in tablet formulation. J of AOAC Int. 2008; 91:557-561.
6. Hendrickx J, Bockx M, Zwijsen C, Borgmans C, Mannens G, Meuldermans W, Heykants J. Location of the hydroxyl functions in hydroxylated metabolites of Nebivolol in different animal species and human subjects as determined by online HPLC-diode array detection. J. Chromatogr. 1996; 729:341-354.
7. Sahoo M K, Giri RK, Barik CS, Kanungo SK, Ravi Kumar BVV.
RP-HPLC Method for the Estimation of Nebivolol in Tablet Dosage Form. E-Journal of Chem. 2009; 6: 915-919.
8. Gupta Y, Shrivastava A, Duggal D, Patel A, Agrawal S. A new RP-HPLC method for simultaneous estimation of Nebivolol hydrochloride and Hydrochlorthiazide in dosage forms. J of young Pharm. 2009; 1:264-269.
9. Kokil SU, Bhatia MS. Simultaneous Estimation of Nebivolol Hydrochloride and Valsartan using RP HPLC. Indian J Pharm Sci. 2009; 71:111–114.
10. Kokil SU, Bhatia MS. Liquid chromatographic impurity profiling of Nebivolol Hydrochloride from bulk drug. Der Pharma Chemica. 2009; 1:177-187.
11. Ramakrishna NV, Vishwottam KN, Koteshwara M, Manoj S, Santosh M, Varma DP. Rapid quantification of nebivolol in human plasma by liquid chromatography coupled with electrospray ionization tandem mass spectrometry. J Pharm. Biomed. Anal. 2005; 39:1006-13.
12. Sharma A, Patel B, Patel R. Simultaneous Estimation of Nebivolol Hydrochloride and Amlodipine besylate by High Performance Thin Layer Chromatography. Int. J of Pharma. Bio Sci. 2010; 1:339-347. 13. Reddy TS, Devi PS. Validation of a high-performance thin-layer
chromatographic method, with densitometric detection, for quantitative analysis of Nebivolol hydrochloride in tablet formulations. J of Planar Chrom. 2007; 20:149-152.
15. Veerasekaran V, Katakdhond SJ, Kadam SS, Rao JR. Simultaneous spectrophotometric estimation of Hydrochlorothiazide and Metoprolol tartrate from combined dosage form. Ind. Drugs. 2001; 38:187-189.
16. Moussa BA, Kousy EL. Colorimetric analysis of some diuretic drugs: hydrochlorothiazide and spironolactone. Pharm. week. Bl. Sci. 1985; 7:79.
17. Hemke AT, Bhure MV, Chouhan KS, Gupta KR, Wadodkar SG. UV Spectrophotometric Determination of Hydrochlorothiazide and Olmesartan Medoxomil in Pharmaceutical Formulation. E-Journal of Chem. 2010; 7:1156-1161.
18. Chouhan KS, Bhure MV, Hemke AT, Gupta KR, Wadodkar SG.
Development of RP-HPLC method for estimation of
Hydrochlorothiazide and Olmesartan Medoxomil in Pharmaceutical Formulation. Res. J Pharma. Biol. Chem. Sci. 2010; 1:78 -84. 19. Carlucci G, Palumbo G, Mazzeo P, Quaglia MG. Simultaneous
determination of Losartan and Hydrochlorothiazide in tablets by high-performance liquid chromatography. J Pharm. Biomed. Anal. 2000; 23:185- 189.
20. Carlucci G, Carlo DV, Mazzeo P. Simultaneous determination of Valsartan and Hydrochlorothiazide in tablets by high-performance liquid chromatography. Anal. Lett. 2000; 33:2491-2500.
21. Kanumula GV, Bhanu R. Simultaneous determination of
Hydrochlorothiazide and Losartan potassium in pharmaceutical dosage by reverse phase high performance liquid chromatography. Indian Drugs. 2000, 37(1), 38-41.
22. Tarte PS, Wate SP, Khedikar PB, Pawnikar GV. Absorption
Correction Method for Estimation of Nebivolol and
Hydrochlorothiazide in Combined Tablet Dosage Form. Asian J. Research Chem. 2008; 1:74-76.
23. Shah K, Desai TR, Behera A, Pal RS, Girhepunje KM. Development of spectrophotometric methods for estimation of Nebivolol hydrochloride and Hydrochlorothiazide simultaneously, in bulk and tablet dosage form. Res. J Pharma. Biol. Chem. Sci. 2010; 1:451-457.
24. Shah KV, Thumber BL, Desai TR. Simultaneous Estimation of Nebivolol Hydrochloride and Hydrochlorothiazide in Bulk and Tablet Dosage Form by Q-Analysis Method. Int. J Pharma. Sci. Res. 2009; 1:80-85.
25. Tarte PS, Wate SP, Bondre AV, Paunikar GV. Simultaneous determination of Nebivolol and Hydrochlorothiazide in Tablet dosage form by RP-HPLC. Int. J Pharm Tech Res. 2009; 1:720-724.
26. Dhandapani B, Thirumoorthy N, Prakash DJ. Development and Validation for the Simultaneous Quantification of Nebivolol Hydrochloride and Hydrochlorothiazide by UV Spectroscopy, RP-HPLC and HPTLC in Tablets. E-Journal of Chem. 2010; 7: 341-348.
27. Damle MC, Topagi KS, Bothara KG. Development and validation of a stability-indicating HPTLC method for analysis of Nebivolol hydrochloride and Hydrochlorothiazide in the bulk material and in pharmaceutical dosage forms. Acta Chromatographica. 2010; 22: 433-443.
28. ICH Q2B, Validation of Analytical Procedures: Methodology, International Conference on Harmonization, ICH Harmonized Tripartite Guideline, Geneva, Fed. Regist. 1997; 62: 27463.
![Table 8: Results of Repeatability Studies S. No Application volume [µl] % RSD NBV [4000 ng/spot] (n=7) % RSD of HCTZ[1600 ng/spot] (n=7) 1 4 0.13 0.58 Specificity](https://thumb-eu.123doks.com/thumbv2/123dok_br/18202246.333633/4.918.96.453.164.217/table-results-repeatability-studies-application-volume-hctz-specificity.webp)
