Analysis of physiological variables during acute hypoxia and
maximal stress test in adolescents clinically diagnosed with
mild intermittent or mild persistent asthma*
Análise de variáveis fisiológicas de adolescentes com diagnóstico clínicode asma leve intermitente ou leve persistente quando submetidos a hipóxia aguda e teste de esforço máximo
Martin Maldonado, Luiz Osório Cruz Portela
Abstract
Objective: To analyze adolescents clinically diagnosed with asthma, in terms of the physiological changes occurring during acute hypoxia and during a maximal stress test. Methods: This was a descriptive, cross-sectional study involving 48 adolescents (12-14 years of age) who were divided into three groups: mild intermittent asthma (MIA, n = 12); mild persistent asthma (MPA, n = 12); and control (n = 24). All subjects were induced to acute hypoxia and were submitted to maximal stress testing. Anthropometric data were collected, and functional variables were assessed before and after the maximal stress test. During acute hypoxia, the time to a decrease in SpO2 and
the time to recovery of SpO2 (at rest) were determined. Results: No significant differences were found among
the groups regarding the anthropometric variables or regarding the ventilatory variables during the stress test. Significant differences were found in oxygen half-saturation pressure of hemoglobin prior to the test and in PaO2 prior to the test between the MPA and control groups (p = 0.0279 and p = 0.0116, respectively), as was
in the oxygen extraction tension prior to the test between the MIA and MPA groups (p = 0.0419). There were no significant differences in terms of the SpO2 times under any of the conditions studied. Oxygen consumption
and respiratory efficiency were similar among the groups. The use of a bronchodilator provided no significant benefit during the hypoxia test. No correlations were found between the hypoxia test results and the physiological variables. Conclusions: Our findings suggest that adolescents with mild persistent asthma have a greater capacity to adapt to hypoxia than do those with other types of asthma.
Keywords: Asthma; Adolescent; Cell hypoxia; Exercise test.
Resumo
Objetivo: Analisar variáveis fisiológicas de adolescentes com diagnóstico clínico de asma quando submetidos a teste de hipóxia aguda e de esforço máximo. Métodos: Estudo descritivo transversal composto por 48 adolescentes (12-14 anos), divididos em três grupos: 12 no grupo asma leve intermitente (ALI), 12 no grupo asma leve persistente (ALP) e 24 no grupo controle. Todos foram submetidos a teste de hipóxia aguda e a teste de esforço máximo. Características antropométricas foram coletadas, e variáveis funcionais foram determinadas antes e após o teste de esforço máximo. Em condições de hipóxia aguda, foram registrados o tempo de descida e o tempo de recuperação de SpO2 durante repouso. Resultados: Não foram encontradas diferenças significativas nas variáveis
antropométricas nem nas variáveis ventilatórias durante o teste de esforço entre os grupos. Foram encontradas diferenças significativas na pressão de oxigênio com 50% de saturação da hemoglobina antes do teste e na PaO2 antes do teste entre os grupos ALP e controle (p = 0,0279 e p = 0,0116, respectivamente), assim como na tensão de extração de oxigênio antes do teste entre os grupos ALI e ALP (p = 0,0419). Não houve diferenças significativas nos tempos de SpO2 em quaisquer das condições estudadas. O consumo de oxigênio e a eficiência da respiração foram semelhantes entre os grupos. O uso de um broncodilatador não trouxe vantagens nos resultados no teste de hipóxia. Não foram encontradas correlações entre o teste de hipóxia e as variáveis fisiológicas. Conclusões:
Nossos achados sugerem que os adolescentes com asma leve persistente têm uma melhor capacidade de adaptação à hipóxia comparado aos com outros tipos de asma.
Descritores: Asma; Adolescente; Hipóxia celular; Teste de esforço.
* Study carried out in the Laboratory of Exercise Physiology and Human Performance, Federal University of Santa Maria, Santa Maria, Brazil.
Correspondence to: Martin Maldonado. Kuwabara 1-6-36, Karora 408, Matsuyama, Ehime, Japan, 790-0911. Tel. 81 80 3928-0216. Fax: 81 89 9605263. E-mail: [email protected]
Financial support: None.
To answer this question, we analyzed the behavior of physiological variables during acute hypoxia and maximal stress testing in adolescents clinically diagnosed with mild intermittent or mild persistent asthma.
Methods
This was a descriptive, cross-sectional study involving 48 male and female adolescent students (12-14 years of age), residing in the city of Santa Maria, Brazil, who were divided into three groups: control (no asthma; n = 24); mild intermittent asthma (MIA; clinical diagnosis; n = 12); and mild persistent asthma (MPA; clinical diagnosis; n = 12). All of the participants reported having had no asthma attacks for a while.
The adolescents were classified on the basis of asthma severity by means of clinical diagnosis, and spirometric data were added to strengthen the diagnostic results.(11)
In order to characterize the groups, the International Physical Activity Questionnaire (IPAQ), short version, was used in determining the level of physical activity, and a health status questionnaire was used in excluding symptoms consistent with viral infection (cold or flu) in the six weeks before the test, as well as in excluding anemia and diseases that affect hematocrit levels.
Students were included in the study only after giving written informed consent, in accordance with the requirements of the Brazilian National Ministry of Health and in accordance with Resolution no. 196/96.
We used the equipment and measurement tools available in the Laboratory of Exercise Physiology and Human Performance of the Federal University of Santa Maria Center for Physical Education and Sports, located in Santa Maria, Brazil.
Respiratory variables were measured with a Vmax 229 series spirometer (SensorMedics, Yorba Linda, CA, USA). Acute hypoxia testing was performed with a portable hypoxicator device (GO2Altitude®; Biomedtech Australia Pty. Ltd., Melbourne, Australia). Blood lactate levels were determined with a Biosen 5030 lactate analyzer (EKF Industrie, Elektronik GmbH, Barleben, Germany). Blood gas analysis and oximetry were performed with an ABL 520 gas analyzer (Radiometer, Copenhagen, Denmark).
Introduction
Asthma is a chronic inflammatory disease characterized by lower airway hyperresponsiveness and variable airflow limitation. Studies conducted in various countries suggest that the prevalence of asthma has been increasing among children and adolescents.(1-5)
Asthma produces bronchial mucosal inflammation, resulting in airflow limitation. The reduction in airway diameter and the consequent increase in airway resistance cause a decrease in all maximal expiratory flows, producing blood gas abnormalities. As a consequence of these changes, there is an increase in the alveolar-arterial oxygen tension difference, an increase in physiological dead space, and a decrease in PaO2, resulting in hypoxemia. Hypoxemia triggers tachypnea and an increase in minute ventilation, with release of carbon dioxide, causing hypocapnia and respiratory alkalosis. These are the most common arterial blood gas analysis findings in an individual experiencing an asthma attack.(6) Physiological phenomena similar to those described in asthma attacks occur at high altitude. The major factor affecting the response of the body at high altitude is the decrease in barometric pressure, which results in a decrease in inspired oxygen tension (PO2) and in PaO2. Under these circumstances, chemoreceptors send impulses to the respiratory center in order to increase pulmonary ventilation. At the hematological level, there is hypovolemia associated with hyperventilation and increased blood pH in the acute phase, giving rise to respiratory alkalosis.
the ventilation volume/oxygen consumption (VE/VO2) ratio, known as the ventilatory equivalent for oxygen, were used, because these variables correlate better with physical performance. After the test had been completed, blood samples were collected from the earlobe of each participant and the measurements were immediately repeated.
Data were analyzed by nonparametric statistics, because they did not show normal distribution. The means of the groups were compared by one-way ANOVA on ranks (Kruskal-Wallis). When the means of the groups showed significant differences, the Kruskal-Wallis test was applied to 2 groups at a time in order to determine which group differed from the others. The dependent variables were compared by the Wilcoxon matched-pair sign-rank test. The variables were analyzed for correlation by using Pearson’s correlation coefficient. The analyses were performed with the SAS software program (SAS Institute, Inc., Cary, NC, USA).
Results
The variables age, weight, height, percentage of fat, body mass, and IPAQ score were analyzed to determine how different the groups were from each other in terms of biotype. When gender was not taken into account, the groups studied showed no significant differences in terms of the aforementioned variables. When gender was taken into account (Table 1), there were also no significant differences within the same group or among the groups. The exception was in relation to the percentage of fat between genders in the control group (p = 0.0164). The same result was expected for the other two groups, but this was not observed, and we believe it to be due to the peculiarities of those groups. There was no specific tendency that could be attributed to asthma or to gender in any of the groups.
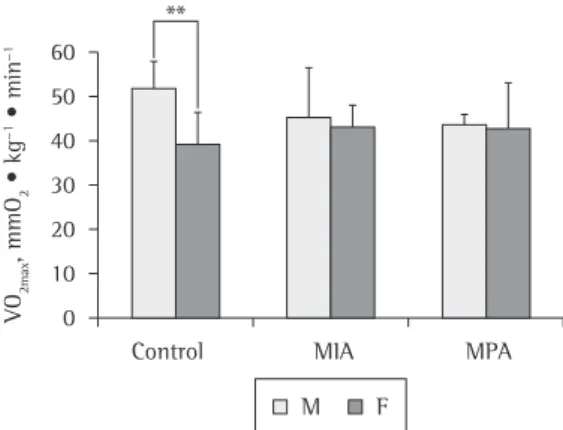
The VO2max results (Figure 1) showed a significant difference between genders in the control group (p = 0.0006). In view of this finding, the groups were divided by gender for analysis of VO2max. Same-gender comparison of VO2max among the groups revealed no significant differences.
The VE/VO2 values were analyzed at different percentages of total maximal stress test time (Figure 2). The results showed that there were Maximal stress testing was performed on an ATL
10200 treadmill (Inbramed, São Paulo, Brazil). Monitoring of HR was performed with an Accurex Plus device (Polar, Kempele, Finland).
control and MIA groups, indicating that there was no hypoxemia. However, in the MPA group, the pre-test PaO2 values were significantly below the normal range (p = 0.0116) when compared with those found in the control and MIA groups. This difference did not occur in the comparison of the post-test PaO2 values among the groups. In the comparison of the pre- and post-test PaO2 values within each group, only the control group showed significant differences. Although these results cannot be elucidated in the present study, they do suggest a differentiated adaptation behavior in the MPA group.
The P50 values obtained before and after the maximal stress test showed significant increases in all of the groups. The pre-test P50 values were significantly lower in the MPA group than in the control group (p = 0.02). Nevertheless, the P50 values found in the MPA group were above the reference range. The post-test P50 values showed no significant differences in the comparison among the groups.
In the present study, we reported only the Px values obtained before the maximal stress test. The data revealed that the lowest Px values were found in the MPA group and the highest values were found in the MIA group. Analysis by the Kruskal-Wallis test showed that the MPA group differed significantly from the MIA group no significant intergroup differences at the
different percentages.
In order to determine whether the respiratory mechanisms of our subjects with asthma were limiting factors or whether they affected gas diffusion and VO2, the blood variables PaO2, P50, and Px were assessed for potential intergroup differences and also to establish whether the values obtained in the groups were within the normal range (Table 2).
The PaO2 values obtained before the maximal stress test were within the normal range in the
Table 1 - Biotypic characteristics of the groups, separated by gender.a
Characteristic Gender Groups p*
Control MIA MPA
Gender, n M 10 8 4 0.2208
F 14 4 8
Age, years M 13.4 ± 0.7 12.65 ± 1.1 12.8 ± 1.3 0.2375 F 12.9 ± 1.0 13.0 ± 0.8 12.8 ± 0.9 0.8939
p** 0.2736 0.5345 0.8491
Weight, kg M 51.0 ± 8.5 54.3 ± 7.1 55.9 ± 19.4 0.9133 F 49.7 ± 8.8 43.7 ± 11.1 50.3 ± 10.5 0.5149
p** 0.7253 0.2345 0.6104
Height, m M 162.8 ± 8.0 159.9 ± 9.6 158.4 ± 16.1 0.7833 F 155.5 ± 7.7 154.8 ± 7.6 155.2 ± 7.0 0.9703
p** 0.0609 0.3082 0.6104
Body fat, % M 15.5 ± 5.6 19.1 ± 9.7 22.5 ± 8.0 0.3300 F 22.1 ± 6.0 19.4 ± 9.7 25.4 ± 8.7 0.3578
p** 0.0164 1.0000 0.3958
IPAQ score 4.1 ± 0.5 4.0 ± 0.4 3.9 ± 0.7 0.5122 MIA: mild intermittent asthma; MPA: mild persistent asthma; M: male; F: female; and IPAQ: International Physical Activity Questionnaire, short version. aValues expressed as mean ± SD, except where otherwise
indicated. *Kruskal-Wallis test for intergroup differences. **Wilcoxon test for intragroup gender differences.
were induced to acute hypoxia before and after bronchodilator use, and Td and Tr were analyzed (Table 3). The data showed that there were no significant intergroup differences in Td or Tr before bronchodilator use. Therefore, the subjects with asthma, when compared with each other or with the subjects in the control group, did not show a better response to hypoxia. The Td and Tr results showed no significant intergroup differences even when tested after bronchodilator use. The variables Td and Tr were assessed for correlations with the variables related to blood oxygen tension and the ventilatory variables, and there was no evidence of an association for any of them.
Discussion
Values of VO2max allow a comparative analysis of the metabolic, cardiovascular, and respiratory systems of individuals with or without asthma, being considered the best index of cardiorespiratory fitness and aerobic endurance.(14) One study reported that the aerobic power of females is lower, being equivalent to 65-75% of the aerobic power of males.(15) Same-gender comparison of VO
2max among the groups revealed no significant differences, which indicates that the individuals with asthma had no limitations in terms of cardiorespiratory fitness and is in agreement with the findings of one group of authors.(16) (p = 0.0419), which interestingly had higher
values than those found in the control group. The results in the control group were similar to those found in the MPA group, and there is no explanation for this finding.
The variables related to blood oxygen tension and the ventilatory variables were analyzed for correlations. The results showed that, in the MPA group, VE/VO2 correlated negatively with PaO2 (r = −0.72520), P50 (r = −0.72754), and Px
(r= −0.77070), all of which were obtained before
the maximal stress test.
In order to determine the existence of differentiated responses to hypoxia, the groups
Figure 2 - Mean ventilatory equivalent for oxygen (VE/VO2) at different percentages of total maximal stress test time in the three groups studied. C: control; MIA: mild intermittent asthma; and MPA: mild persistent asthma.
Table 2 - Values of PaO2 and oxygen half-saturation pressure of hemoglobin, at the two study time points, as well as oxygen extraction tension values, at one time point, in the groups studied.a
Variable Groups p*
Control MIA MPA
Pre-test PaO2, mmHg (n = 12) (n = 8) (n = 8) 0.0116 83.3 ± 4.9 81.7 ± 6.7 75.1± 6.6
Post-test PaO2, mmHg
(n = 12) (n = 8) (n = 8) 0.5650 79.6 ± 9.8 79.5 ± 8.8 74.4 ± 8.2
p** 0.0159 0.2068 0.4478
Pre-test P50, mmHg (n = 8) (n = 8) (n = 7) 0.0279 35.7 ± 1.5 35.4 ± 1.8 33.0 ± 2.4
Post-test P50, mmHg (n = 8) (n = 8) (n = 7) 0.4799 37.5 ± 1.1 37.5 ± 2.5 35.8 ± 2.8
p** 0.0107 0.0430 0.0312
Pre-test Px, mmHg (n = 11) (n = 7) (n = 7) 0.0419 44.9 ± 2.8 46.1 ± 2.1 41.8 ±3.5
MIA: mild intermittent asthma; MPA: mild persistent asthma; pre-test: blood was collected before the maximal stress test; post-test: blood was collected immediately after the maximal stress test; P50: oxygen half-saturation pressure of
hemoglobin; and Px: oxygen extraction tension. aValues expressed as mean ± SD. *Kruskal-Wallis test for intergroup
and PO2 in capillary blood, as well as the fact that capillary blood collection is less painful and less risky, favored the use of capillary sampling in the present study.(21-23)
The PaO2 values obtained before the maximal stress test in the MPA group revealed hypoxemia,(24) although the subjects in this group were not experiencing attacks. This hypoxemic profile could not be detected previously by clinical evaluation, spirometry, or exercise spirometry.
The statistical difference found in PaO2 before the maximal stress test in the MPA group, in comparison with the other groups, disappeared in the PaO2 measurements taken after the test. This was due to the fact that the post-test PaO2 values in the control group decreased significantly in relation to their respective pre-test values.
The fall in PaO2 on exertion is part of the typical exercise profile in patients with severe pulmonary disease.(25) The exertion-induced hypoxemia observed in the control group (p = 0.0159) was similar to the normal behavior described for high-performance endurance athletes.(26,27)
The P50 results found in the present study were increased when compared with those of adults.(28) However, they can fluctuate because of several factors, such as age. Higher P50 values translate to reduced hemoglobin affinity for oxygen and increased oxygen availability to the cells. This reduced affinity does not affect oxygen uptake at the alveolar level (only in extreme situations in which PO2 < 9%). In the present study, the significant increase in the post-test P50 values in all of the groups was According to some authors, individuals with
asthma have lower aerobic capacity because of the airway obstructions occurring during asthma attacks.(17,18) Therefore, analysis of VO
2max served to determine whether this oxygen consumption capacity could be different among the groups studied and whether it could affect their results of response to hypoxia.
The VE/VO2 ratio describes the respiratory efficiency, as well as revealing the amount of air to be ventilated per liter of consumed oxygen.(19) The comparison among the groups allowed us to determine whether or not the similar oxygen consumption, shown in Figure 1, occurred because of ventilatory compensation, such as an increase in ventilation, indicating poorer respiratory efficiency in the study subjects than in the controls.
Higher VE/VO2 values represent poorer respiratory efficiency, which could be understood as one of the compensation mechanisms that allowed the MPA group to obtain similar VO2max results to those obtained by the other groups. The results shown in Figure 2 revealed an “apparent” poorer respiratory efficiency in the MPA group, which began to manifest at 30-40% of total test time. However, the VE/VO2 obtained showed that there were no significant intergroup differences in the percentages of total test time, which is in agreement with the literature,(14,20) allowing us to state that the groups were similar in terms of VE/VO2.
Values of PaO2 represent the diffusion gradient determining the transfer of oxygen from the blood to the tissues(19) and make it possible to identify the presence of blood hypoxemia. The absence of significant differences between PaO2
Table 3 - Pre- and post-bronchodilator values of time to a decrease in and time to recovery of SpO2 in the groups studied.a
Variable Groups p*
Control MIA MPA
(n = 23) (n = 12) (n = 9)
Pre-BD Td, s 145.0 ± 86.5 104.7 ± 54.8 127.6 ± 76.4 0.2412 Post-BD Td, s 137.9 ± 102.7 108.8 ± 32.0 132.6 ± 62.6 0.6406
p** 0.2921 0.3651 0.6587
Pre-BD Tr, s 63.6 ± 19.1 56.2 ± 20.8 76.3 ± 42.6 0.6824 Post-BD Tr, s 60.8 ± 16.3 68.2 ± 27.83 60.4 ± 21.87 0.5931
p** 1.0000 1.0000 1.0000
MIA: mild intermittent asthma; MPA: mild persistent asthma; Td: time to a decrease; BD: bronchodilator; and Tr: time to recovery. aValues expressed as mean ± SD. *Kruskal-Wallis test for intergroup differences. **Wilcoxon test for intragroup
The hypoxia test was repeated after bronchodilator use, because, if there was obstructive airflow limitation, although not significant by spirometric criteria, the test results could be altered by the drug. The comparison of the test results obtained at the two different time points (before and after bronchodilator use) allowed us to state that bronchodilator use did not affect the results of the hypoxia test in the subjects with asthma (not experiencing attacks) or in the controls.
The Td and Tr values showed extremely high deviations, being in agreement with the findings of one author,(30) who attributed such deviations to the effect of individual variability on the hypoxic variables Td and Tr.
In conclusion, the groups showed similar VO2 and similar respiratory efficiency, neither of which affected the results of the other variables. The use of a bronchodilator provided no significant benefit during the hypoxia test. There was no evidence of an association between the hypoxia test results and the physiological variables studied. The fact that, initially, the subjects in the MPA group were hypoxemic at rest and that they showed a similar response to hypoxia to that observed in the other groups is suggestive of a greater capacity to adapt to hypoxia. However, this can be just a characteristic of the study sample. Therefore, further studies are needed in order to confirm these results.
Acknowledgments
The authors would like to thank the Center for Physical Education and Sports of the Federal University of Santa Maria. We would also like to thank Dr. Vitor Cassol, our colleagues at the Center, and the adolescents who participated in the study.
References
1. Celikel S, Isik SR, Demir AU, Karakaya G, Kalyoncu AF. Risk factors for asthma and other allergic diseases in seasonal rhinitis. J Asthma. 2008;45(8):710-4.
2. Burr ML, Butland BK, King S, Vaughan-Williams E. Changes in asthma prevalence: two surveys 15 years apart. Arch Dis Child. 1989;64(10):1452-6.
3. Shaw RA, Crane J, O’Donnell TV, Porteous LE, Coleman ED. Increasing asthma prevalence in a rural New Zealand adolescent population: 1975-89. Arch Dis Child. 1990;65(12):1319-23.
4. Robertson CF, Dalton MF, Peat JK, Haby MM, Bauman A, Kennedy JD, et al. Prevalence of asthma in Australian school-children using a standardized international expected and can be explained by known factors,
such as pH, carbon dioxide, temperature, and 2,3-diphosphoglycerate, all of which affect the oxyhemoglobin dissociation curve (Bohr effect), providing increased oxygen availability to the muscle in order to meet the demands of physical exertion.
The post-test P50 values in the three groups showed a similar behavior to that observed for the post-test PaO2 values. This result, during exercise, suggests that the individuals with asthma (in both groups) showed no signs of adaptation or of an increase in the ability to transport and release oxygen to the tissues in relation to the control group.
Values of Px reflect the combined effects that changes in PaO2 and in hemoglobin affinity for oxygen have on the arterial blood ability to provide oxygen to the tissues. In the present study, no Px reference values were found for the age group under study, and the results are described only on the basis of intergroup comparison. For adults, Px reference values range from 32 to 41 mmHg.(29)
The result of the correlation analysis between blood variables and ventilatory variables was understood on the basis that decreases in PaO2, P50, and Px values, before the maximal stress test, are signs of hypoxemia, which was present in the MPA group. However, the VO2max values reached in this group were similar to those obtained in the control group, which suggests the existence of differentiated systems of homeostatic compensation.
aerobic or anaerobic limitation? Med Sci Sports Exerc. 1997;29(4):430-5.
18. Clark CJ, Cochrane LM. Assessment of work performance in asthma for determination of cardiorespiratory fitness and training capacity. Thorax. 1988;43(10):745-9. 19. Wilmore JH, Costill DL. Fisiología del esfuerzo y del
deporte. Barcelona: Paidotribo; 2004. p. 245-72. 20. Cooke CB. Maximal oxygen uptake, economy and
efficiency. In: Ston R, Reilly T, editors. Kinanthropometry and Exercise Physiology Laboratory Manual. London: E & FN Spon; 1996. p. 197-219.
21. Dar K, Williams T, Aitken R, Woods KL, Fletcher S. Arterial versus capillary sampling for analysing blood gas pressures. BMJ. 1995;310(6971):24-5.
22. Pitkin AD, Roberts CM, Wedzicha JA. Arterialised earlobe blood gas analysis: an underused technique. Thorax. 1994;49(4):364-6.
23. Zavorsky GS, Cao J, Mayo NE, Gabbay R, Murias JM. Arterial versus capillary blood gases: a meta-analysis. Respir Physiol Neurobiol. 2007;155(3):268-79. 24. Dean H. Gasometria Arterial. In: Parsons PE, Heffner JE,
editors. Segredos em Pneumologia. Porto Alegre: Artes Médicas Sul; 2000. p. 60-70.
25. Powers SK, Howley ET. Fisiologia do Exercício. Barueri: Manole; 2000. p. 299-316.
26. Siggaard-Andersen O, Gøthgen IH, Wimberley PD, Fogh-Andersen N. The oxygen status of the arterial blood revised: relevant oxygen parameters for monitoring the arterial oxygen availability. Scand J Clin Lab Invest Suppl. 1990;203:17-28.
27. McArdle WD, Katch FI, Katch VL. Exercise Physiology: Nutrition, Energy, and Human Performance. Philadelphia: Lippincott Williams and Wilkins/Wolters Kluwer; 2009. p. 299.
28. Powers SK, Martin D, Cicale M, Collop N, Huang D, Criswell D. Exercise-induced hypoxemia in athletes: role of inadequate hyperventilation. Eur J Appl Physiol Occup Physiol. 1992;65(1):37-42.
29. Kristoffersen K. An improved method for the estimation of small quantities of alkali-resistant hemoglobin in blood. Scand J Clin Lab Invest. 1961;13:402-9. 30. Matheus-Corrêa S. Desempenho Físico em Altitude
Simulada [thesis]. Santa Maria: Universidade Federal de Santa Maria; 2004.
protocol (ISAAC). Eur Respir J Suppl. 1995;8(Suppl 19):495.
5. Solé D, Camelo-Nunes IC, Wandalsen GF, Pastorino AC, Jacob CM, Gonzalez C, et al. Prevalence of symptoms of asthma, rhinitis, and atopic eczema in Brazilian adolescents related to exposure to gaseous air pollutants and socioeconomic status. J Investig Allergol Clin Immunol. 2007;17(1):6-13.
6. McFadden ER Jr, Lyons HA. Arterial-blood gas tension in asthma. N Engl J Med. 1968;278(19):1027-32. 7. Chapman RF, Benjamin DL. The Effect of Hypo and
Hyperbaria on Performance. In: Garret WE, Kirkendall DT, editors. Exercise and Sport Science. Philadelphia: Lippincott Williams & Wilkins; 2000. p. 447-58. 8. Jedlickova K, Stockton DW, Chen H, Stray-Gundersen J,
Witkowski S, Ri-Li G, et al. Search for genetic determinants of individual variability of the erythropoietin response to high altitude. Blood Cells Mol Dis. 2003;31(2):175-82. 9. Foster GE. High on altitude: new attitudes toward
human cerebral blood flow regulation and altitude acclimatization. J Physiol. 2011;589(Pt 3):449.
10. Ganong WF. Fisiología Médica. Mexico: El Manual Moderno; 1992. p. 14-23.
11. Sociedade Brasileira de Pneumologia e Tisiologia. II consenso brasileiro no manejo da asma. J Pneumol. 24(4):171-276.
12. Petroski EL. Antropometria: Técnicas e Padronizações. Porto Alegre: Pallotti; 1999.
13. Mader A, Leisen H, Heck H, Philippi H, Rost R, Schurch P, et al. Zur Beurteilung der Sportartspezifischen Ausdauerleistungsfähigkeit im Labor. Sportarzt und Sportmedizin. 1976;27(4): 80-8.
14. Krahenbuhl GS, Skinner JS, Kohrt WM. Developmental aspects of maximal aerobic power in children. Exerc Sport Sci Rev. 1985;13:503-38.
15. Astrand P, Rodahl K. Work Physiology: Physiological Bases of Exercise. Champaign: Human Kinetics; 1996. p. 237-72.
16. Santuz P, Baraldi E, Filippone M, Zacchello F. Exercise performance in children with asthma: is it different from that of healthy controls? Eur Respir J. 1997;10(6):1254-60.
17. Counil FP, Varray A, Karila C, Hayot M, Voisin M, Préfaut C. Wingate test performance in children with asthma:
About the authors
Martin Maldonado
Visiting Researcher. Department of Pharmacology, Informational Biomedicine, Ehime University School of Medicine, Matsuyama, Japan.
Luiz Osório Cruz Portela