Ana Paula Bortoletto MartinsI Renata Bertazzi LevyI,II Rafael Moreira ClaroI,III Jean Claude MoubaracI Carlos Augusto MonteiroI
I Núcleo de Pesquisas Epidemiológicas em Nutrição e Saúde. Faculdade de Saúde Pública. Universidade de São Paulo. São Paulo, SP, Brasil
II Departamento de Medicina Preventiva. Faculdade de Medicina. Universidade de São Paulo. São Paulo, SP, Brasil III Departamento de Nutrição. Escola de
Enfermagem. Universidade Federal de Minas Gerais. Belo Horizonte, MG, Brasil
Correspondence:
Ana Paula Bortoletto Martins Av. Dr. Arnaldo, 715
01246-904 São Paulo, SP, Brasil E-mail: [email protected] Received: 5/29/2013
Approved: 9/9/2013
Article available from: www.scielo.br/rsp
Increased contribution of
ultra-processed food products in
the Brazilian diet (1987-2009)
ABSTRACT
OBJECTIVE: To establish temporal trends in household food and drink
consumption in Brazil, taking into account the extent and purpose of its industrial processing.
METHODS: Data was obtained from Household Budget Surveys conducted
in Brazil in 1987-1988, 1995-1996, 2002-2003 and 2008-2009. In all surveys, probabilistic samples of households in the metropolitan areas were studied and, for the last two surveys, the scope was national. The units of analysis were food purchases records of clusters of households. The purchased food items were divided according to the extent and purpose of their industrial processing into: ‘in natura’ or minimally processed foods, processed culinary ingredients and ready-to-consume, processed and ultra-processed food and drink products. The quantity of each item was converted into energy. For each survey, the daily availability of calories per capita and the caloric share of the food groups were estimated. For the national surveys, estimates were calculated by income quintiles. Temporal trends were assessed using linear regression models and difference of means tests.
RESULTS: The caloric share of ready-to-consume products signiicantly
increased between 2002-2003 and 2008-2009 (from 23.0% to 27.8% of total calories), mainly because of the increase in the consumption of ultra-processed
products (20.8% to 25.4%). In the same period, there was a signiicant reduction
in the caloric share of foods and culinary ingredients. The increase in the ultra-processed products caloric share occurred across all income quintiles. There was an uniform increase in the caloric share of ready-to-consume products in the metropolitan areas, mostly in place of ultra-processed products, accompanied by a decrease in the share of ‘in natura’ or minimally processed foods and culinary ingredients.
CONCLUSIONS: The share of ultra-processed products signiicantly increased
in the Brazilian diet, as seen in the metropolitan areas since the 1980s, and
conirmed at a national level in the 2000s.
DESCRIPTORS: Food Consumption. Prepared Foods. Fast Foods. Diet
Increased production and consumption of processed foods and drinks is one of the principal causes of the current obesity pandemic and of non-communicable diseases.33 Studies have shown the link between
excessive consumption of these processed products, such as soft drinks, sweets and processed meat, and excessive weight gain.18,34 Longitudinal follow ups of
more than ten years in length have shown association between the habit of eating processed food in fast food restaurants and increase in body mass index and in resistance to insulin.3,23
The industrial processing of food is practically ignored in studies on populations’ food intake and in dietary recommendations. This is perhaps due to the lack
of a classiication system which takes into account
the type of food processing before being purchased and consumed.9,14,30
A classiication system for food items was drawn up9
based on the extent and purpose of the food processing.
This classiication grouped the food items into three
groups: ‘in natura’ or minimally processed foods; processed culinary ingredients; and ready-to-consume, processed and ultra-processed products. Ultra-processed products are essentially industrial formulations, mainly or totally made from ingredients and containing little or no whole food, whereas processed products are whole foods preserved in salt, sugar or oil.9,10 The relevance
of this classiication for dealing with obesity and other
chronic diseases is reported in the literature.13,14,30
Studies in different countries have shown that ready-to-consume, processed and ultra-processed products are more energy dense, have higher sugar, sodium, total and saturated fat content with lower
protein and iber content compared to in natura or minimally processed foods combined with culinary ingredients.13,14 Ultra-processed products have special
characteristics which encourage excessive energy intake, such as their being generally served in large portions, their hyper-palatability, their long shelf-life and the ease with which they can be carried around, facilitating the habit of eating between meals and snacking, as well as their aggressive promotion through persuasive marketing strategies.9,14
Studies using data from three household budget surveys in metropolitan areas of Brazil between 1987-1988 and 2002-2003 have documented continuous increases in the caloric share of these ready-to-consume products in the diet, together with a decrease in the share of in
INTRODUCTION
natura or minimally processed foods and of processed culinary ingredients.12,13 A new household budget
survey was carried out in Brazil in 2008-2009. This survey offered the possibility of updating the trend of the share of ready-to-consume products in household food purchasing in metropolitan areas of Brazil and,
for the irst time, to document this trend throughout
the country, as the surveys were of a national scope.
The aim of this study was to estimate trends in household consumption of food items in Brazil, taking into account the extent and purpose of their industrial processing.
METHODS
The data used in this study are from the surveys carried out by the Brazilian Institute of Geography and Statistics (IBGE) in four periods: March 1987 to February 1988, October 1995 to September 1996, June 2002 to July 2003 and May 2008 to May 2009.
Representative samples of a set of Brazilian house-holds located in 11 metropolitan areas (Belem in the North; Fortaleza, Recife and Salvador in the Northeast; Belo Horizonte, Rio de Janeiro and Sao Paulo in the Southeast; Curitiba and Porto Alegre in the South and the Federal District and the municipality of Goiania in the Midwest) were studied in the four periods of the study. The total sample of households in these areas was 13,611 in 1987-1988, 16,014 in 1995-1996, 13,848 in 2002-2003 and 15,399 in 2008-2009. The metropolitan areas together represented around 1/3 of households and of the Brazilian population.a,b,c,d
The two most recent household budget surveys had a national coverage and the total number of households was 48,470 in 2002-2003 and 55,970 in 2008-2009.
All of the surveys used complex cluster sampling, involving the geographical and socioeconomic
strati-ication of all the census tracts in the country, followed by random selection of tracts in the irst stage, and of
households in the second. The data collection in all of the surveys was carried out over a 12 month period, in a uniform way in the strata, guaranteeing the repre-sentativeness of all four seasons of the year. A detailed description of the sampling process in the four surveys is available elsewhere.a,b,c,d
The basic data analyzed in this study refer to the purchase of food items for domestic consumption by the unit of consumption (the household) over seven
a Instituto Brasileiro de Geografia e Estatística. Pesquisa de orçamentos familiares, 1987/88: regiões metropolitanas. Rio de Janeiro; 1991. b Instituto Brasileiro de Geografia e Estatística. Pesquisa dos orçamentos familiares 1995-1996: primeiros resultados. Rio de Janeiro; 1997. c Instituto Brasileiro de Geografia e Estatística. Pesquisa de Orçamentos Familiares 2002-2003: Análise da disponibilidade domiciliar de alimentos e do estado nutricional no Brasil. Rio de Janeiro; 2004.
consecutive days, recorded daily in a notebook by the members of the household or by the IBGE interviewer.
The records of food items purchased by households clusters (strata) were used as units of study due to the short reference period for collecting data on the purchase of food items in each household.
The strata of households included in the surveys’ sample design were used to study the national evolution of food intake. These strata, homogenous as regards the geographic location of the households and the socio-economic level of the families, added up to 443 in 2002-2003 and 550 in 2008-2009. The mean number of households studied per strata in 2003-2003 was 109.4 (varying between 9 and 801) and in 2008-2009 it was 101.7 (varying between 8 and 796).
Data from the Sistema IBGE de Recuperação Automática (SIDRA – IBGE Automatic Recover System)e on food and drink purchases were used for
each of the 11 metropolitan areas and according to clusters of households corresponding to ten classes of household income, totaling 110 strata per survey. The mean number of households analyzed in each unit of study was 123.7 in 1987-1988 (varying between 45 and 351), 145.6 in 1995-1996 (varying between 47 and 474), 65.7 in 2002-2003 (varying between 15 and 228) and 86.0 in 2008-2009 (varying between 8 and 339).
In the 1987-1988 survey, only a description of the food purchased and the amount spent was recorded, meaning that the quantity purchased (in kg or l) needed
to be deined indirectly (based on mean price for the
food item recorded by the IBGE in the week and the metropolitan area in question). In the other surveys, the quantity of each food item purchased was recorded directly by members of the household. Food purchased for consumption outside of the home was not recorded
with suficient detail (a simple description of type and
cost are available) to be included in this study.
Data on household income and spending – and other information characterizing the residence and its inhab-itants – were obtained by trained interviewers using standardized questionnaires.
The total quantities of each food item purchased, after excluding inedible portions, were converted so as to express daily intake values. The total daily purchase of each food item was converted into energy using the Tabela Brasileira de Composição de Alimentos (TACO – Brazilian Table of Food Composition);f if the food
item was not included in the table, that of the United States Department of Agriculture (USDA) was used.g
The items were grouped according to the
abovemen-tioned classiication, based on the extent and purpose of
industrial processing.10 They were grouped into the three
following groups: in natura or minimally processed foods, including rice and beans, meat, milk and eggs, fruit and vegetables, roots and tubers among others; processed culinary ingredients, which are substances extracted from other foods, including oils and fats,
lours and sugar; and ready-to-consume products, which
could be either processed or ultra-processed.
Processed ready-to-consume products are produced from adding substances such as salt, sugar and oil to whole foods. They include vegetables or legumes
preserved in brine, fruits in syrup, ish preserved in oil, salted or smoked ish or meat, and cheeses with
added salt. Ultra-processed ready-to-consume prod-ucts are produced predominantly or entirely from industrial ingredients and have little or no food in their composition. In general, they contain preservatives, cosmetic additives and often added synthetic vitamins and minerals. They include bread, cereal bars, cookies, savory snacks, cakes and baked goods, ice-cream, soft drinks, ready-meals, pizzas, sausages, nuggets, canned and dried soup and infant formula.
We estimated the mean value of available calories per capita for each period studied and the proportion of calories acquired for each of the three groups and their subgroups. The estimates were obtained for all Brazilian households, for household strata according to quintiles of per capita monthly income and for the set of households belonging to the 11 metropolitan areas of the country.
The test of means for independent samples (t-test) was used for each quintile of income in the temporal trend analysis of the national estimates. Statistical
signiicance was tested for the variations using linear
regression models for the analysis of temporal trend of estimates restricted to the metropolitan areas. We considered the descriptive level to be 0.05 for
statis-tical signiicance in all tests.
Weighting factors were used in the analyses to enable the results to be extrapolated to all Brazilian house-holds and for their metropolitan areas. We used the Stata v. 12.1 statistical package for all analyses.
RESULTS
The total daily per capita quantity of energy from the purchased food items corresponded to 1,791 kcal (standard error (se): 33 kcal) in 2002-2003 and to
e Instituto Brasileiro de Geografia e Estatística. SIDRA: banco de dados agregados. Brasília (DF); 2012 [cited 2012 Mar 1]. Available from: http://www.sidra.ibge.gov.br
f Universidade Estadual Campinas. Núcleo de Estudos e Pesquisa em Alimentação. Tabela Brasileira de Composição de Alimentos – TACO. versão 1. Campinas; 2004.
1,598 kcal (se: 27 kcal) in 2008-2009 in the set of Brazilian households.
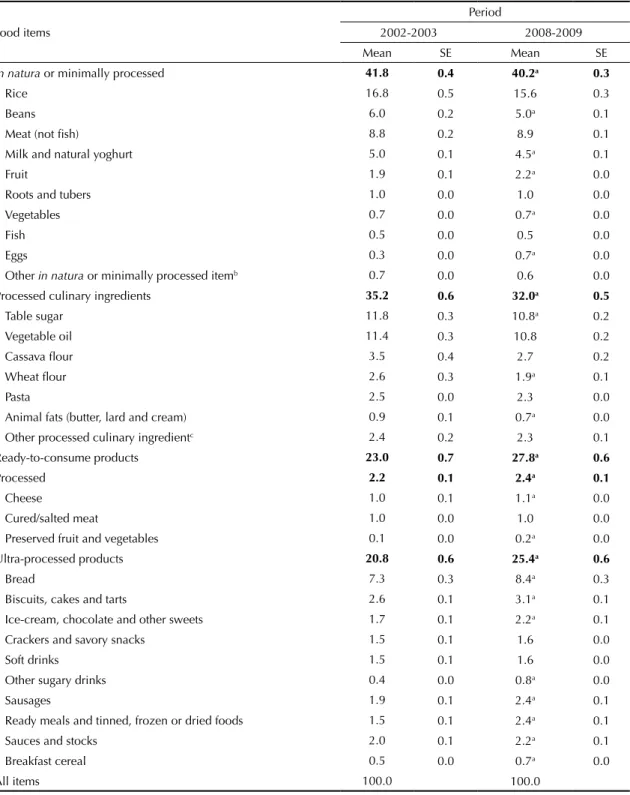
The caloric share of ready-to-consume products
increased signiicantly (from 23.0 to 27.8%) in the
six years between the two surveys, above all among ultra-processed products (from 20.8% to 25.4%).
There were signiicant decreases in the caloric share
of in natura or minimally processed foods (1.6 percentage points – pp) and of culinary ingredients (3.2 pp) (Table 1).
The caloric share of all the ultra-processed ready-to-consume products increased, above all for sausages, sugary drinks, sweets, chocolates and ice-cream and for ready meals which tripled their caloric share in the period. Among the processed products there was a small, though significant, growth in the caloric share of cheese and preserved fruit and vegetables. The caloric share of beans (1.0 pp) and milk (0.5 pp)
decreased signiicantly among the in natura or mini-mally processed foods. The greatest decreases among
culinary ingredients were for reined sugar (1.0 pp) and for wheat lour (0.7 pp) (Table 1).
The increase in the caloric share of ready-to-consume products was found in all economic strata, above all with regards ultra-processed products, and tended to be greater among those on lower incomes (Table 2).
The quantity of daily per capita energy purchased was 1,883 kcal (se: 46 kcal) in 1987-1988, 1,693 kcal (se: 47 kcal) in 1995-1996, 1,492 kcal (se: 49 kcal) in 2002-2003 and 1,411 kcal (se: 46 kcal) in 2008-2009 in the set of metropolitan households.
The caloric share of ready-to-consume products
increased in a uniform and signiicant manner (from
20.3% to 32.1%) over a period of a little more than 20 years (1987 to 2009). There was an increase in ultra-processed products, from 18.7% to 29.6%, and a reduction in the caloric share of in natura or minimally processed foods (5.1 pp) and of processed culinary ingredients (6.8 pp) (Table 3).
An increase in the caloric share of ultra-processed products in the diet was observed; for sausages, ready meals, sweets, soft drinks and other sugary drinks, this share more than doubled. The share of in natura
or minimally processed foods signiicantly decreased, except fruit and ish, whose share remained practically
constant. Among the processed culinary ingredients,
except pasta, the caloric share decreased. Cassava lour and wheat lour had the greatest reductions (1.2 pp and
0.8 pp respectively) (Table 3).
DISCUSSION
The results of this study conirmed the trend of increase
in the share of ready-to-consume products in household
food purchases in Brazilian municipalities. For the irst
time, the same trend was documented in the country as a whole and for all income groups.
Household budget surveys using the same classiication
as that used in this study have shown ready-to-consume products with higher shares than that in Brazil: 61.7% of total calories in Canada in 2001 and 63.4% in the United Kingdom in 2008.14,15 The share of in natura or
minimally processed foods and of culinary ingredients in the total calories was around half the value observed in Brazil in the two analyses.
Trends similar to those found in this study have been
reported in other countries for products classiied as
ultra-processed. Studies in Europe report increases in the share of ready meals and soft drinks in the diet, and reductions in the share of olive oil, fruit, vegetables and milk.19,32 In Taiwan, an increase in consumption
of sweets and sugary drinks was observed between 1993-1996 and 2005-2008.22 There was increased
consumption of soft drinks and other sugary drinks, products which are typically ultra-processed, in Mexico City1 and in the USA,h as well as among Chilean women
who tripled the caloric share of sugary drinks in their diet between 1999 and 2006.26
Increased share of ready-to-consume products in the diet is not limited to the Brazilian population. The substitution of in natura or minimally processed foods and culinary ingredients by ready-to-consume products is a 20th century phenomenon in developed
countries. In Canada, the share of ready-to-consume products increased from 28.7% in 1938-1939 to 61.7% in 2001; ultra-processed products increased from 24.4% to 54.9%14,16 The same phenomenon can be seen
in developing countries from the 1980s onwards.11
The rapid expansion of the share of ready-to-consume products in Brazil and other developing countries, such as China and Mexico, can be explained by changes in the food systems of these countries, due above all to national economic growth and transnational food industries (Big Food) penetrating the local markets.11,28
The increased supply of products such as soft drinks and snacks in the globalized world, accompanied by a reduction in the relative price of these products, caused the gradual replacement of traditional diets based on foods with diets composed of processed and ultra-pro-cessed products.8,i
The increased share of ready-to-consume products, even among the poorest levels of the Brazilian popu-lation may be explained by real growth in household
income, especially for families on low income. This fact means the poorest population have access to ready-to- consume products, which, in Brazil, are still relatively
Table 1. Distribution of the share (%) of food, culinary ingredients and ready-to-consume products in the total consumption of calories purchased by Brazilian households, 2002-2003 and 2008-2009.
Period
Food items 2002-2003 2008-2009
Mean SE Mean SE
In natura or minimally processed 41.8 0.4 40.2a 0.3
Rice 16.8 0.5 15.6 0.3
Beans 6.0 0.2 5.0a 0.1
Meat (not fish) 8.8 0.2 8.9 0.1
Milk and natural yoghurt 5.0 0.1 4.5a 0.1
Fruit 1.9 0.1 2.2a 0.0
Roots and tubers 1.0 0.0 1.0 0.0
Vegetables 0.7 0.0 0.7a 0.0
Fish 0.5 0.0 0.5 0.0
Eggs 0.3 0.0 0.7a 0.0
Other in natura or minimally processed itemb 0.7 0.0 0.6 0.0
Processed culinary ingredients 35.2 0.6 32.0a 0.5
Table sugar 11.8 0.3 10.8a 0.2
Vegetable oil 11.4 0.3 10.8 0.2
Cassava flour 3.5 0.4 2.7 0.2
Wheat flour 2.6 0.3 1.9a 0.1
Pasta 2.5 0.0 2.3 0.0
Animal fats (butter, lard and cream) 0.9 0.1 0.7a 0.0
Other processed culinary ingredientc 2.4 0.2 2.3 0.1
Ready-to-consume products 23.0 0.7 27.8a 0.6
Processed 2.2 0.1 2.4a 0.1
Cheese 1.0 0.1 1.1a 0.0
Cured/salted meat 1.0 0.0 1.0 0.0
Preserved fruit and vegetables 0.1 0.0 0.2a 0.0
Ultra-processed products 20.8 0.6 25.4a 0.6
Bread 7.3 0.3 8.4a 0.3
Biscuits, cakes and tarts 2.6 0.1 3.1a 0.1
Ice-cream, chocolate and other sweets 1.7 0.1 2.2a 0.1
Crackers and savory snacks 1.5 0.1 1.6 0.0
Soft drinks 1.5 0.1 1.6 0.0
Other sugary drinks 0.4 0.0 0.8a 0.0
Sausages 1.9 0.1 2.4a 0.1
Ready meals and tinned, frozen or dried foods 1.5 0.1 2.4a 0.1
Sauces and stocks 2.0 0.1 2.2a 0.1
Breakfast cereal 0.5 0.0 0.7a 0.0
All items 100.0 100.0
SE: Standard error
Numbers in bold highlight the three large groups and are not included in the total sum.
a p < 0.05 for the t-test for means of independent samples.
b Grains (other than rice and beans), nuts and seeds (unsalted), seafood, coffee, tea, condiments and dried eggs.
more expensive than in natura or minimally processed foods and processed culinary ingredients.4,j
Ready-to-consume products typically have high energy
density and are rich in sugar and fat and poor in iber.13,14
These characteristics are considered to be risk factors for obesity,24,29,33,k and the increased consumption of
these products may be one of the explanations for the
growing trend of the prevalence of being overweight in the Brazilian population. The percentage of overweight adults in Brazil increased from 24% in 1975-1975 to 49% in 2008-2009, while the prevalence of obesity in adults tripled in the same period.l
In addition to their unfavorable nutritional proile,
ready-to-consume products have characteristics Table 2. Distribution of the share (%) of food, culinary ingredients and ready-to-consume products in total consumption of calories purchased by Brazilian households in five income strata. Brazil, 2002-2003 and 2008-2009.
Income quintile
Period
Group 2002-2003 2008-2009
Mean SE Mean SE
In natura or minimally processed foods
1st quintile 43.5 1.2 43.6 1.0
2nd quintile 44.5 0.8 41.9a 0.7
3rd quintile 42.0 0.8 40.7 0.7
4th quintile 41.1 0.6 38.4a 0.6
5th quintile 37.6 0.1 36.1a 0.6
Processed culinary ingredients
1st quintile 41.7 1.0 38.2a 0.8
2nd quintile 37.6 1.0 33.6a 0.6
3rd quintile 36.9 1.0 30.0a 1.2
4th quintile 31.7 1.2 31.6 0.7
5th quintile 28.2 0.9 26.5a 0.8
Processed and ultra-processed products
1st quintile 14.7 0.9 18.1a 0.9
2nd quintile 17.9 1.1 24.4a 0.9
3rd quintile 21.1 1.0 29.3a 1.2
4th quintile 27.2 1.0 30.0a 0.7
5th quintile 34.2 1.0 37.4a 0.9
Processed products
1st quintile 1.5 0.1 1.5 0.1
2nd quintile 1.5 0.1 2.1a 0.1
3rd quintile 1.8 0.2 2.3a 0.1
4th quintile 2.4 0.2 2.3 0.1
5th quintile 3.5 0.2 3.7a 0.2
Ultra-processed products
1st quintile 13.2 0.9 16.6a 0.9
2nd quintile 16.4 1.1 22.4a 0.9
3rd quintile 19.3 1.1 26.9a 1.1
4th quintile 24.8 0.9 27.7a 0.7
5th quintile 30.7 0.9 33.8a 0.8
SE: Standard error
a p < 0.05 for the t-test for means of independent samples.
i Farina E, Nunes R. A evolução do sistema agro alimentar e a redução de preços ao consumidor: o efeito de atuação dos grandes compradores. Oficina PENSA - Estudo temático 2. São Paulo: Fundação Instituto de Administração; 2002.
j Hoffmann R. Elasticidades-renda das despesas e do consumo de alimentos no Brasil em 2002-2003. In: Silveira FG, Servo LMS, Menezes T, Piola SF, organizadores. Gasto e consumo das famílias brasileiras contemporâneas. Brasília (DF): Instituto de Pesquisa Econômica Aplicada; 2007. v.2, p. 463-83.
k World Cancer Research Fund. American Institute for Cancer Research. Food, nutrition, physical activity, and the prevention of cancer: a global perspective. Washington (DC); 2007.
Table 3. Distribution of the share (%) of food items, culinary ingredients and ready-to-consume products in total consumption of calories purchased by Brazilian households, metropolitan areas of Brazil, 1987-1988, 1995-1996, 2002-2003 and 2008-2009.
Period
Group 1987-1988 1995-1996 2002-2003 2008-2009
Mean SE Mean SE Mean SE Mean SE
In natura or minimally processed foods 44.0 0.4 44.2 0.6 40.0 0.5 38.9a 0.7
Rice 16.1 0.5 15.8 0.7 14.6 0.6 14.4a 0.7
Beans 6.0 0.2 5.6 0.3 5.7 0.3 5.0a 0.2
Meat (not fish) 9.1 0.1 10.7 0.3 9.5 0.3 8.9a 0.2
Milk and natural yoghurt 6.0 0.2 6.3 0.3 5.4 0.2 4.8a 0.1
Fruit 2.5 0.1 2.3 0.2 2.0 0.1 2.4 0.1
Roots and tubers 1.3 0.0 1.0 0.1 1.0 0.1 1.0a 0.0
Vegetables 0.9 0.0 0.8 0.0 0.8 0.0 0.8a 0.0
Fish 0.3 0.0 0.3 0.0 0.4 0.0 0.3 0.0
Eggs 1.3 0.0 0.9 0.0 0.2 0.0 0.8a 0.0
Other in natura or minimally processed itemb 0.3 0.0 0.3 0.0 0.5 0.1 0.4a 0.0
Processed culinary ingredients 35.7 0.5 32.9 0.8 31.4 0.8 28.9a 0.5
Table sugar 12.7 0.3 12.3 0.5 10.5 0.5 9.6a 0.3
Vegetable oil 12.1 0.3 10.8 0.4 11.0 0.4 9.7a 0.3
Cassava flour 2.7 0.4 2.2 0.3 2.1 0.3 1.5a 0.3
Wheat flour 2.2 0.1 1.8 0.1 1.6 0.2 1.4a 0.1
Pasta 2.2 0.0 2.2 0.1 2.7 0.1 2.8a 0.1
Animal fats (butter, lard and cream) 1.1 0.1 0.9 0.1 1.0 0.1 1.2 0.1
Other processed culinary ingredientc 1.8 0.1 1.5 0.1 1.3 0.1 1.3a 0.2
Ready-to-consume products 20.3 0.5 22.8 0.9 28.5 0.8 32.1a 0.7
Processed 1.6 0.1 1.9 0.2 2.4 0.2 2.5a 0.1
Cheese 0.9 0.1 1.2 0.2 1.3 0.1 1.4a 0.1
Cured/salted meat 0.5 0.0 0.5 0.0 1.0 0.1 1.0a 0.1
Preserved fruit and vegetables 0.2 0.0 0.1 0.0 0.1 0.0 0.1 0.0
Ultra-processed products 18.7 0.4 21.0 0.8 26.1 0.8 29.6a 0.7
Bread 9.7 0.2 10.0 0.3 10.5 0.3 11.4a 0.4
Biscuits, cakes and tarts 1.8 0.1 2.2 0.1 2.4 0.1 3.4a 0.2
Ice-cream, chocolate and other sweets 1.4 0.1 1.1 0.1 1.8 0.1 2.3a 0.2
Crackers and savory snacks 0.9 0.0 1.2 0.1 1.4 0.1 1.6a 0.1
Soft drinks 0.8 0.0 1.3 0.1 2.4 0.2 2.2a 0.1
Other sugary drinks 0.1 0.0 0.1 0.0 0.4 0.0 0.5a 0.0
Sausages 0.7 0.0 1.6 0.1 2.3 0.2 2.6a 0.1
Ready meals and tinned, frozen or dried foods 0.8 0.1 1.5 0.2 2.0 0.2 2.4a 0.2
Sauces and stocks 2.1 0.1 1.6 0.1 2.5 0.1 2.7a 0.1
Breakfast cereal 0.3 0.0 0.3 0.0 0.3 0.0 0.5a 0.1
Total 100.0 100.0 100.0 100.0
SE: Standard error
Numbers in bold highlight the three large groups and are not included in the total sum.
a p < 0.05 for the t-test for means of independent samples.
b Grains (other than rice and beans), nuts and seeds (unsalted), seafood, coffee, tea, condiments and dried eggs.
which facilitate the habit of eating between meals and which encourages excess calorie consumption. The sensory characteristics5,35 of these products, along
with their aggressive marketing campaigns contribute to explaining the accelerated growth of these products in Brazil. Their practicality and because they need to or next to no preparation are attractive to a population with a lifestyle dominated by lack of time.8
The data collected for the household budget surveys
are not suficiently detailed on the consumption of
food items outside of the home. Considering the trend for spending on food consumed outside of the home to grow (from 24.5% of total spending in 1987-1988 to 33.1% in 2008-2009 in metropolitan areas,d and
from 24.1% in 2002-2003 to 31.1% in 2008-2009 in the country),d it is likely that the total share of calories
consumed outside of the home is also growing. Eating ready-to-consume products tends to be greater outside of the home. It is, therefore, possible that the increased
consumption of these products in Brazil identiied here
is actually even higher.
Another limitation is that food waste was not consid-ered, i.e., the portion of purchased food not actually consumed by the household. Ready-to-consume products tend to be less perishable than in natura or minimally processed foods. It is possible that the share of ready-to-consume products has been underestimated. However, this situation does not substantially change
the growth trend identiied in this study.
The search for strategies to reduce or slow the expan-sion of ready-to-consume products is essential. Among
them, educational activities on food and nutrition, based on dietary guidelines which emphasize the adoption of eating patterns based on in natura or minimally processed foods are necessary in order to reduce and prevent non-communicable diseases.17 No less important
are activities to regulate the relative prices of food items and to regulate the marketing of ready-to-consume products (especially for the children’s market).6,7,21 The
strategies adopted so far have not proved adequate, such
as the ineficient self-regulation by the industry with
regards advertising aimed at children.25 The effects of
increasing tax on soft drinks,2 and energy dense20 food
items, and of those high in saturated fat31 on reducing the
prevalence of excess weight and obesity27 and reducing
calories purchased for consumption20 have been shown.
These studies need to be applied in the form of effec-tive public policies which act in conjunction with other activities in order to modify the food system as a whole.
The presence of ultra-processed products increased exponentially in Brazilian eating habits, raising the need for an in-depth investigation of their impact on the population’s health. The majority of data available, both on the trends and on the impact of these products on diet and health are restricted to a limited number of items, but not to processed and ultra-processed prod-ucts overall, this being a recent method of classifying
food items. New studies to investigate the inluence of
regional, cultural and socio-economic characteristics and culinary practices on eating habits are needed, using
the classiication of food items based on the extent and
1. Barquera S, Hernandez-Barrera L, Tolentino ML, Espinosa J, Ng SW, Rivera JÁ, et al. Energy Intake from Beverages Is Increasing among Mexican
Adolescents and Adults. J Nutr. 2008;138(12):2454-61.
DOI:10.3945/jn.108.092163
2. Claro RM, Levy RB, Popkin BM, Monteiro CA. Sugar-Sweetened Beverage Taxes in Brazil.
Am J Public Health. 2012;102(1):178-83. DOI:10.2105/AJPH.2011.300313
3. Duffey KJ, Gordon-Larsen P, Jacobs Jr DR, Williams OD, Popkin BM. Differential associations of fast food and restaurant food consumption with 3-y change in body mass index: the Coronary Artery Risk
Development in Young Adults Study. Am J Clin Nutr.
2007;85(1):201-8.
4. Hoffmann R. Desigualdade de renda e das despesas per capita no Brasil, em 2002-203 e 2008-2009, e avaliação do grau de progressividade ou regressividade de parcelas
da renda familiar. Econ Soc. 2010;19(3):647-61.
DOI: 10.1590/S0104-06182010000300010
5. Ifland JR, Preuss HG, Marcus MT, Rourke KM, Taylor WC, Burau K, et al. Refined food addiction:
A classic substance use disorder. Med Hypotheses.
2009;72(5):518-26. DOI:10.1016/j.mehy.2008.11.035
6. Marins BR, Araújo IS, Jacob SC. A propaganda de alimentos: orientação, ou apenas estímulo ao
consumo? Cien Saude Coletiva. 2011;16(9):3873-82.
DOI:10.1590/S1413-81232011001000023 7. Moise N, Cifuentes E, Orozco E, Willett W. Limiting
the consumption of sugar sweetened beverages in Mexico’s obesogenic environment: A qualitative policy
review and stakeholder analysis. J Public Health Policy.
2011;32(4):458-75. DOI:10.1057/jphp.2011.39
8. Monteiro CA. The big issue is ultra-processing. World
Nutr. 2010;1(6):237-59.
9. Monteiro CA. The big issue is ultra-processing. The
price and value of meals. World Nutr.
2011;2(6):271-82.
10. Monteiro CA, Cannon G, Levy RB, Claro RM, Moubarac J-C. The Food System. Ultra-processing. The big issue for nutrition, disease, health, well-being.
World Nutr. 2012;3(12):527-69.
11. Monteiro CA, Cannon G. The Impact of Transnational “Big Food” Companies on the South: A View
from Brazil. PLoS Med. 2012;9(7):e1001252.
DOI:10.1371/journal.pmed.1001252
12. Monteiro CA, Levy RB, Claro RM, Castro IR, Cannon G. A new classification of foods based on the extent and purpose of their processing.
Cad Saude Publica. 2010;26(11):2039-49. DOI:10.1590/S0102-311X2010001100005
13. Monteiro CA, Levy RB, Claro RM, Castro IR, Cannon G. Increasing consumption of ultra-processed foods and likely impact on human health: evidence
from Brazil. Public Health Nutr. 2011;14(1):5-13.
DOI:10.1017/S1368980010003241
14. Moubarac JC, Martins APB, Claro RM, Levy RB, Cannon G, Monteiro CA. Consumption of ultra-processed foods and likely impact on human health.
Evidence from Canada. Public Health Nutr. 2012:1-9.
15. Moubarac JC, Claro RM, Baraldi LG, Levy RB, Martins APB, Cannon G, et al. International differences in cost and consumption of ready-to-consume food and drink products: United Kingdom and Brazil,
2008-2009. Glob Public Health. 2013;8(7)845-56.
DOI:10.1080/17441692.2013.796401
16. Moubarac JC, Batal M, Martins APB, Claro R, Bertazzi R, Cannon G, et al. Time trends in the consumption of processed and ultra-processed food and drink products
between 1938 and 2011 in Canada. Can J Diet Pract
Res, 2013. In press
17. Mozaffarian D, Ludwig DS. Dietary Guidelines
in the 21st century – a time for food. JAMA.
2010;304(6):681-2. DOI:10.1001/jama.2010.1116
18. Mozaffarian D, Hao T, Rimm E, Willett W, Hu F. Changes in Diet and Lifestyle and Long-Term Weight Gain in Women and
Men. N Eng J Med. 2011;364(25):2392-404.
DOI:10.1056/NEJMoa1014296
19. Naska A, Bountziouka V, Trichopoulou A. soft drinks: time trends and correlates in twenty-four European countries. A cross-national study using the DAFNE (Data Food Networking) databank.
Public Health Nutr. 2010;13(9):1346-55. DOI:10.1017/S1368980010000613
20. Nederkoorn C, Havermans RC, Giesen JCAH, Jansen A. High tax on high energy dense foods and its effects on the purchase of calories in a supermarket.
An experiment. Appetite. 2011;56(3):760-65.
DOI:10.1016/j.appet.2011.03.002
21. Nestle M, Ludwig DS. Front-of-package food labels:
public health or propaganda? J Am Med Assoc.
2010;303(8):771-2. DOI:10.1001/jama.2010.179
22. Pan W, Wu H, Yeh C, Chuang S, Chang H, Yeh NH, et al. Diet and health trends in Taiwan: comparison of two nutrition and health surveys from 1993-1996 and
2005-2008. Asia Paci J Clin Nutr. 2011;20(2):238-50.
23. Pereira MA, Kartashov AI, Ebbeling CB, Horn LV, Slattery M, Jacobs Jr DR, et al. Fast-food habits, weight gain, and insulin resistance (the CARDIA study): 15-year prospective
analysis. Lancet. 2005;365(9453):36-42.
DOI:10.1016/S0140-6736(04)17663-0
24. Popkin BM. Global nutrition dynamics: the world is shifting rapidly toward a diet linked
with noncommunicable diseases. Am J Clin Nutr.
2006;84(2):289-98.
25. Potvin Kent M, Dubois L, Wanless A. Self-regulation by industry of food marketing is having little impact during children’s preferred
television. Int J Pediatr Obes. 2011;6(5-6):401-8.
DOI:10.3109/17477166.2011.606321
últimos 20 años. Rev Med Chile. 2012;140(3):305-12. DOI:10.4067/S0034-98872012000300004
27. Sacks G, Veerman JL, Moodie M, Swinburn B. ‘Traffic-light’ nutrition labelling and ‘junk-food’ tax: a modelled comparison of cost-effectiveness for obesity
prevention. Int J Obes. (Lond). 2011;35(7):1001-9.
DOI:10.1038/ijo.2010.228
28. Stuckler D, Nestle M. Big Food, food systems,
and global health. PLoS Med. 2012;9:e1001242.
DOI:10.1371/journal.pmed.1001242
29. Swinburn BA, Caterson I, Seidell JC, James WPT. Diet, nutrition and the prevention of excess weight gain
and obesity. Public Health Nutr. 2004;7(1A):123-46.
30. Tavares LF, Fonseca SC, Rosa MLG, Yokoo EM. Relationship between ultra-processed foods and metabolic syndrome in adolescents from a Brazilian
Family Doctor Program. Public Health Nutr.
2012;15(1):82-7. DOI:10.1017/S1368980011001571
31. Tiffin R, Arnoult M. The public health impacts of a
fat tax. European J Clin Nutr. 2011;65(4):427-33.
DOI:10.1038/ejcn.2010.281
32. Varela-Moreiras G, Ávila JM, Cuadrado C, del Pozo S, Ruiz E, Moreiras O. Evaluation of food consumption and dietary patterns in Spain by the Food Consumption
Survey: updated information. Euro J Clin Nutr.
2010;64Suppl 3:37-43. DOI:10.1038/ejcn.2010.208 33. World Health Organization. Diet, nutrition and the
prevention of chronic diseases. Report of the joint WHO/FAO expert consultation Genebra; 2003. 34. Woodward-Lopez G, Kao J, Ritchie L. To what extent
have sweetened beverages contributed to the obesity
epidemic? Public Health Nutr. 2010;14(3):499-509.
DOI:10.1017/S1368980010002375
35. Yeomans MR, Blundell JE, Leshem M. Palatability: response to nutritional need or need-free stimulation
of appetite? Brit J Nutr. 2007;92 Suppl 1:3-14.
DOI:10.1079/BJN20041134
This study was supported by the Fundação de Amparo à Pesquisa, state of Sao Paulo (Doctorate grant awarded to Martins A.P.B., Process No. 2010/17080-9, doctorate grant awarded to Moubarac J.C., Process No. 2011/08425-5 and Post-doctorate grant awarded to Claro R.M., Process No. 2010/08421-7).