www.jped.com.br
ORIGINAL
ARTICLE
Parents’
perception
of
health-related
quality
of
life
in
children
and
adolescents
with
excess
weight
夽
,
夽夽
Melissa
Maria
Romero
Nascimento
a,
Tatiana
Rocha
Melo
a,
Rogério
Melo
Costa
Pinto
b,
Nívea
Macedo
Oliveira
Morales
c,
Tânia
Maria
Silva
Mendonc
¸a
a,
Helena
Borges
Martins
da
Silva
Paro
d,∗,
Carlos
Henrique
Martins
Silva
caPost-GraduatePrograminHealthSciences,UniversidadeFederaldeUberlândia(UFU),Uberlândia,MG,Brazil
bPost-GraduatePrograminHealthSciences,FaculdadedeMatemática,UniversidadeFederaldeUberlândia(UFU),Uberlândia,
MG,Brazil
cPost-GraduatePrograminHealthSciences,DepartmentofPediatrics,UniversidadeFederaldeUberlândia(UFU),Uberlândia,
MG,Brazil
dPost-GraduatePrograminHealthSciences,DepartmentofGynecologyandObstetrics,UniversidadeFederaldeUberlândia
(UFU),Uberlândia,MG,Brazil
Received26November2014;accepted15April2015 Availableonline21September2015
KEYWORDS
Qualityoflife; Child;
Adolescents; Overweight; Obesity; Self-image
Abstract
Objective: Toevaluatetheperceptionofparentsorcaregiversonthehealth-relatedqualityof life(HRQOL)ofchildren/adolescentswithoverweight/obesityandpossiblefactorsassociated withthisperception.
Methods: Thiswasacross-sectionalstudyinvolving297caregiversofchildrenandadolescents with normalweight (n=170)andwithoverweight/obesity(n=127),frompublicandprivate schoolsinthestudymunicipality.HRQOLscoresobtainedthroughtheChildHealthQuestionnaire ---ParentForm50(CHQ-PF50)werecomparedaccordingtothenutritionalstatusandgender ofthechildren/adolescents.Multipleregressionanalysiswasusedtodeterminethepredictive valueofstudiedvariablesforthevariationinHRQOLscores.
Results: Parents of children/adolescents with overweight/obesity attributed lower HRQOL scores to their children in the following domains: physical functioning (p<0.01; d=0.49),self-esteem(p<0.01;d=0.38),parentalimpact-emotional(p<0.05;d=0.29),family cohesion(p<0.05;d=0.26),physicalsummaryscore(p<0.05;d=0.29),andpsychosocial sum-maryscore(p<0.05;d=0.25).Inthemultipleregressionmodels,thevariableswiththehighest contributiontothevariationinHRQOLscoreswere:inthephysicalfunctioningdomain,parental
夽
Please citethisarticle as:NascimentoMM, MeloTR, PintoRM, MoralesNM,Mendonc¸a TM,Paro HB,et al. Parents’perceptionof health-relatedqualityoflifeinchildrenandadolescentswithexcessweight.JPediatr(RioJ).2016;92:65---72.
夽夽StudyconductedatUniversidadeFederaldeUberlândia,Uberlândia,MG,Brazil.
∗Correspondingauthor.
E-mail:[email protected](H.B.M.S.Paro).
http://dx.doi.org/10.1016/j.jped.2015.04.006
impact-time(ˇ=0.23;p<0.05);self-esteem,nutritionalstatus(ˇ=−0.18;p≤0.01);emotional
impactonparents,impactonparents’time(ˇ=0.31;p<0.05);andinfamilycohesion,global behavior(ˇ=0.30;p<0.05).
Conclusions: AnegativeimpactonHRQOLofchildren/adolescentswithoverweight/obesitywas observedinthephysicalandpsychosocialaspects.Thenutritionalstatuswasthevariablewith thegreatestcontributionfortheassessmenttheself-esteemofchildrenandadolescentsinthis study.
©2015SociedadeBrasileiradePediatria.PublishedbyElsevierEditoraLtda.Allrightsreserved.
PALAVRAS-CHAVE
Qualidadedevida; Crianc¸a;
Adolescente; Sobrepeso; Obesidade; Autoimagem
Percepc¸ãodospaisacercadaqualidadedevidarelacionadaàsaúdedecrianc¸as eadolescentescomexcessodepeso
Resumo
Objetivo: Avaliarapercepc¸ãodos paisoucuidadores arespeito daqualidadedevida rela-cionada à saúde (QVRS) de crianc¸as/adolescentes com sobrepeso/obesidade e os possíveis fatoresassociadosaessapercepc¸ão.
Métodos: Estudotransversalcomaparticipac¸ãode297cuidadoresdecrianc¸aseadolescentes eutróficos(n=170)ecomsobrepeso/obesidade(n=127),provenientesdeescolaspúblicase pri-vadasdomunicípiodoestudo.EscoresdeQVRSobtidospormeiodoChildHealthQuestionnaire ---ParentForm50(CHQ-PF50)foramcomparadosdeacordocomoestadonutricionalesexodas crianc¸as/adolescentes.Análisesderegressãomúltiplaforamutilizadasparadeterminarovalor preditivodasvariáveisestudadasparaavariac¸ãodosescoresdeQVRS.
Resultados: Pais de crianc¸as/adolescentes com sobrepeso/obesidade atribuíram menores escoresde QVRSpara seusfilhos nosdomínios:func¸ãofísica(p<0,01;d=0,49), autoestima (p<0,01;d=0,38),impactoemocionaldospais(p<0,05;d=0,29),coesãofamiliar(p<0,05; d=0,26),Sumáriodoescorefísico(p<0,05;d=0,29)eSumáriodoescorepsicossocial(p<0,05; d=0,25). Nos modelos de regressão múltipla, as variáveis com maior contribuic¸ão para a variac¸ãodos escores deQVRSforam: nodomínio func¸ãofísica,impacto notempo dospais (ß=0,23;p<0,05);autoestima,estadonutricional(ß=-0,18;p≤0,01);impactoemocionalnos
pais,impacto notempo dospais(ß=0,31; p<0,05);coesãofamiliar, comportamento global (ß=0,30;p<0,05).
Conclusões: HáimpactonegativonaQVRSdecrianc¸as/adolescentescomsobrepeso/obesidade emaspectosfísicosepsicossociais.Oestadonutricionalfoiavariáveldemaiorcontribuic¸ão paraaavaliac¸ãodaautoestimadascrianc¸aseadolescentesdopresenteestudo.
©2015SociedadeBrasileiradePediatria.PublicadoporElsevierEditoraLtda.Todososdireitos reservados.
Introduction
The prevalence of obesity has significantly increased in recentdecadesinbothdevelopedanddevelopingcountries. In Brazil, approximately one-third of children between 5 and9years ofage have excessweight.1 Amongmaleand female adolescents, the prevalence is 21.7% and 19.4%, respectively.1
With the increase in obesity, the onset of type 2 dia-betes,hepaticsteatosis, andorthopedicproblems,andan increasedriskofcardiovascularcomplicationssuchas hyper-tension,dyslipidemia,atherosclerosis,andcoronarydisease have been observed in children and adolescents, which resultsinadecreaseinlifeexpectancy.2Intheshortterm, themainconsequencesofobesityinthepediatricagerange occurinthepsychosocialcontext,suchaslowself-esteem, depressive symptoms, greater exposure to discrimination and bullying, and impaired health-related quality of life (HRQOL).3
Several studies have highlighted the negative impact onthe perception ofwell-being, both inthe physical and psychosocialdimensions, of childrenandadolescentswith overweight and obesity, either reported by the children themselvesorbytheirparentsorcaregivers.HRQOL assess-ment in children can be a problem, given the possible cognitivedifficultiesrelatedtoiteminterpretation.4Inthis context,theperceptionofcaregiversconstitutesavery use-fulalternativeforassessingthequalityoflifeofchildrenand adolescents.4
This study aimedto evaluate,from the perspectiveof parents or caregivers, the HRQOLof children/adolescents with overweight/obesity and possible associated factors, usingtheCHQ-PF50.
Methods
Thiswasacross-sectionalstudyapprovedbytheEthics Com-mitteeofUniversidadeFederaldeUberlândia(129/05).
Participants
Caregivers (parents or guardians) of children and adoles-centsenrolledinpublicandprivateschools,agedbetween 9and12years,withoverweight,obesity,ornormalweight, wereinvitedtoparticipateinthestudy.Publicandprivate schools were included in order to allow the inclusion of childrenandadolescentsfromdifferentsocioeconomicand culturallevels,asthisvariableappearstocontributeboth totheprevalenceofoverweight/obesityandthequalityof life.3Theonsetofpubertywaschosenbecauseitisgenerally associatedwithgreaterphysicalandpsychological vulnera-bilityarisingfromthetypicalchangesinthisperiodoflife.6 Caregivers who agreed to participate signed an informed consentandansweredthesociodemographicquestionnaire andtheCHQ-PF50,whichwasself-applied.
Considering a prevalence of 2% for obesity and 10% for overweight,7 a maximum error of 5%, and the num-berof childrenand adolescentsenrolledinthe firststage ofElementaryeducationattheprivateandpublicschools includedinthestudy,theminimumnumberforthesample size was 138 parents of children/adolescents with over-weight/obesity.
Anthropometricmeasurements
Anthropometricmeasurementsweretakenasdescribedby the World Health Organization (WHO).8 To measure the weight,aMarteTM (MarteCientífica, MG,Brazil)
platform-typeweighingscalewasused,withacapacityupto200kg and50gprecision;heightwasmeasuredwithameasuring tape150cmlong,withprecisionof1mm,andthehelpofa woodensquare.
The nutritional statusof children and adolescentswas assessedusing thebodymass index(BMI=weight/height2)
anthropometricindexforage,expressedasthedifference between the observed value and the reference value for age andgender, withdeviations frommeans quantifiedin percentiles, according to the reference population. The anthropometric profile of theCenters for DiseaseControl (CDC)wasusedasreference,withthefollowingdefinitions: normalweight(BMI≥5thpercentileand<85thpercentile), overweight (IMC≥85th percentile and <95th percentile), andobesity(IMC≥95thpercentile).9Althoughthiscriterion isnotusedinBrazilasareferencefornutritionaldiagnosis, the CDC anthropometricstandard is used by moststudies ofqualityoflifeinchildrenandadolescentswithobesity,10 and itsuse allowsfor a bettercomparison and universal-izationofresults.Additionally,whencomparedtotheWHO criteria,theCDCstandardhaslowersensitivityandhigher
specificity,11 whichwasmoreappropriateforthisstudy,as itdidnotaimtoevaluateriskorprevention.
Procedures
Aftertheschoolsparticipatinginthestudywereselectedby drawinglots,theirprincipalsorcoordinatorswerecontacted toreceive information about the researchobjectives and latertoallowthestudytobeconducted.
Anthropometricmeasurementsofweightandheightwere taken,andtheBMIwascalculatedtodeterminethe nutri-tionalstatus of children and adolescentsfrom the fourth to seventh year of elementary school, aged 9---12 years. Childrenandadolescentswhohadoverweight, obesity,or normalweightwereselectedbydrawinglotsaccording to thesamplingplan.Subsequently,theircaregiverswere con-tactedbytelephonetoreceiveexplanationsaboutthestudy objectives andauthorize their child’s participationin the research.Childrenandadolescentsdiagnosedashavinglow weight(BMI<5th percentile)according to theCDC9 crite-riawereexcluded,aswellasthosewithlowheightforage (height<3rdpercentile).
Tools
Socio-demographicquestionnaire
Thetoolincludedinformationaboutthechild(dateofbirth, gender)andpersonalinformationofcaregivers(age, educa-tionallevel,maritalstatus,andfamilyincome).
ChildHealthQuestionnaire---CHQ-PF50
Itis ageneric toolfor assessing health-relatedquality of life(HRQOL),whichhasbeentranslated,culturallyadapted, andvalidated for Brazilian Portuguese, aimed at children older than 5 years and adolescents.12 The CHQ-PF50 has amultidimensionalcharacteristicanddeterminesphysical, emotional, and social well-being from the perspective of parentsorguardians.Thequestionnaireconsistsof50items thatconstitute15domains:globalhealth,physical function-ing,limitations due toemotional aspects,limitations due tophysical function, bodily pain, behavior, global behav-ior,mentalhealth,self-esteem,healthperception,change in health, parental impact-emotional, parental impact-timefamilyactivities,andfamilycohesion.Theevaluation of each item uses the method of summed scores (Likert method).The finalscoreofeach domainrangesfrom0to 100.Higherscoresindicatebetterfunctionorsensationand, consequently, better quality of life. The scores are used to compare groups, and there is no cutoff value.12 Most domainsrefer to the experiences in the lastfour weeks, exceptthe change in health domain, which refers tothe experiencesofthelast12months.Tendomainsareusedto composetwosummaries:physicalandpsychosocial.12
Statisticalanalysis
groups,theStudent’st-test(continuousvariables)andthe chi-squaredtest(categoricalvariables)wereapplied.
Theinternalconsistencyreliabilitywasverifiedby Cron-bach’s ˛-coefficient for each multi-item scale; 0.5 was consideredastheminimumacceptablevalueforthe assess-ment of the toolinternal consistency.13 In this study,the Cronbach’s alpha coefficient was greater than 0.5 in all domainsoftheCHQ-PF50,exceptforthehealthperception domain(Cronbach’salpha=0.21),afactthathasoccurred intheBrazilianversionofthetool.13
Student’st-test wasusedtocomparethemeandomain scoresandtheCHQ-PF50componentsofchildrenand ado-lescents with overweight/obesity and normal weight and alsotocomparetheCHQ-PF50scoresaccordingtogenderin theoverweight/obesitygroup.Themagnitudeofthe statis-ticallysignificant differenceswascalculatedbasedonthe determinationof the effectsize (Cohen’s d). Values of d equalto0.2;0.5;and0.8wereconsideredassmall,medium andlargeeffectsizes,respectively.14
The correlationsbetweenthedomainsofthe question-naireanddemographicdatawereevaluatedbySpearman’s correlation coefficient. Hierarchical multiple regression analysiswasusedtodeterminethepredictivevalueofthe assessedvariablesfortheHRQOLscoresofthestudied pop-ulation.
DatawereanalyzedusingtheSPSSStatisticsprogram(IBM Corp.Released2011.IBMSPSSStatisticsfor Windows, Ver-sion20.0.NY,USA).Thesignificancelevelfortherejection ofthenullhypothesiswassetatp<0.05.
Results
Sociodemographiccharacteristics
A total of 360 caregivers of children and adolescents wereinvited toparticipate.Sixty-three participantswere excludedduetoincompletedataontheCHQ-PF50. There-fore, the study included 297 caregivers of children and
adolescents with normal weight (n=170) and with over-weight/obesity (n=127). The age of the children and adolescents ranged from 9 to 12 years (mean 10.6 years fornormalweightand10.63foroverweight/obesity).Most caregiversweremotherswithcompleteelementaryschool level(Table1).
Health-relatedqualityoflifeassessment
Parentsofchildrenandadolescentswithoverweight/obesity attributed lowerscores of the CHQ-PF50tothe domains: physical functioning (p<0.01; d=0.49), self-esteem (p<0.01; d=0.38), parental impact-emotional (p<0.05; d=0.29),familycohesion(p<0.05;d=0.26),physical sum-mary score (p<0.05; d=0.29), and psychosocial summary score(p<0.05;d=0.25;Table2).
Therewerenodifferencesbetweenthemeanscores of the CHQ-PF50 domains of children and adolescents with overweight/obesityaccordingtogender(p>0.05;datanot shown).
Thecorrelationsbetweenthesociodemographicdataand thedomainsoftheCHQ-PF50wereweak(r<0.30),except between nutritional status (overweight/obesity or normal weight)andself-esteem(SE;p<0.01;Table3).
ThedomainsofHRQOLthatshoweddifferencesaccording tothenutritionalstatuswereincluded inthemultivariate analysisasdependentvariables.Asindependentvariables, the nutritionalstatus(overweight/obesity/normal weight) andthe HRQOLdomainswithcorrelation coefficients>0.3 (r≥0.3) withthe dependent variableswere selected.For thedependentvariablephysicalfunctioning,amodelofhigh variance explanation(R2=0.39;p<0.05) wasobtainedfor
thevariablesnutritionalstatus,limitationsduetoemotional problems, limitations due to physical function, parental impact-time, andfamilyactivities.The variablethat con-tributed themost tothemodel wasparentalimpact-time (ˇ=0.23,p<0.05).
Table1 Socio-demographiccharacteristicsofparticipatingparents/caregiversandchildren/adolescents.
Characteristics Normalweight
n=170
Overweight/Obesity n=127
p-value
Children
Meanageinyears(SD) 10.62(1.08) 10.61(1.40) 0.98a
Femalegendern(%) 101(59.4%) 54(42.5%) <0.01b
Caregivers
Meanageinyears(SD) 36.78(7.23) 37.98(6.85) 0.15a
Primarycaregiver
Mothern(%) 153(90.0%) 120(94.5%) 0.34b
Educationalleveln(%)
0.61b
Illiterate 2(1.2%) 1(0.8%)
ElementarySchool 69(40.6%) 51(40.2%)
HighSchool 55(32.4%) 49(38.6%)
College/University 44(25.9%) 26(20.5%)
Maritalstatusn(%)
0.64b
Married 106(62.4%) 83(65.4%)
Table2 QualityoflifescoresobtainedbytheCHQ-PF50ofchildren/adolescentsaccordingtothenutritionalstatus.
Domainsandsummaries Mean(SD) F pa db
Normalweight Overweight/obesity
GGH 83.06(18.29) 78.78(19.79) 5.88 0.06
PF 95.16(12.54) 88.98(20.97) 27.51 <0.01 0.49
REB 90.39(19.26) 89.59(19.23) 0.06 0.72
RP 94.61(16.87) 91.60(17.68) 4.51 0.14
BP 83.71(20.55) 81.81(22.59) 2.76 0.45
BE 72.26(17.35) 69.92(17.05) 0.24 0.25
GBE 80.93(20.54) 78.74(22.02) 1.87 0.38
MH 74.35(14.80) 73.98(14.98) 0.49 0.83
SE 89.00(17.66) 82.32(16.01) 0.86 <0.01 0.38
GH 72.35(14.45) 70.77(14.72) 0.06 0.36
CH 74.12(24.31) 70.08(25.79) 3.34 0.17
PE 75.93(22.67) 69.36(25.37) 5.10 0.02 0.29
PT 90.39(17.13) 87.05(18.51) 3.45 0.11
FA 88.43(12.79) 87.66(15.00) 5.40 0.64
FC 75.00(22.31) 69.17(24.83) 4.98 0.04 0.26
PhS 51.86(5.71) 50.18(7.70) 7.37 0.03 0.29
PsS 48.46(7.46) 46.56(7.52) 1.71 0.03 0.25
GGH,globalhealth;PF,physicalfunctioning;REB,role/sociallimitations-emotional/behavioral;RP,role/sociallimitations-physical;BP, bodilypain;BE,behavior;GBE,globalbehavioritem;MH,mentalhealth;SE,self-esteem;GH,generalhealthperceptions;CH,change inhealth;PE,parentalimpact-emotional;PT,parentalimpact-time;FA,familyactivities;FC,familycohesion;PhS,physicalsummary score;PsS,psychosocialsummaryscore.
a Student’st-test. b Cohen’sd.
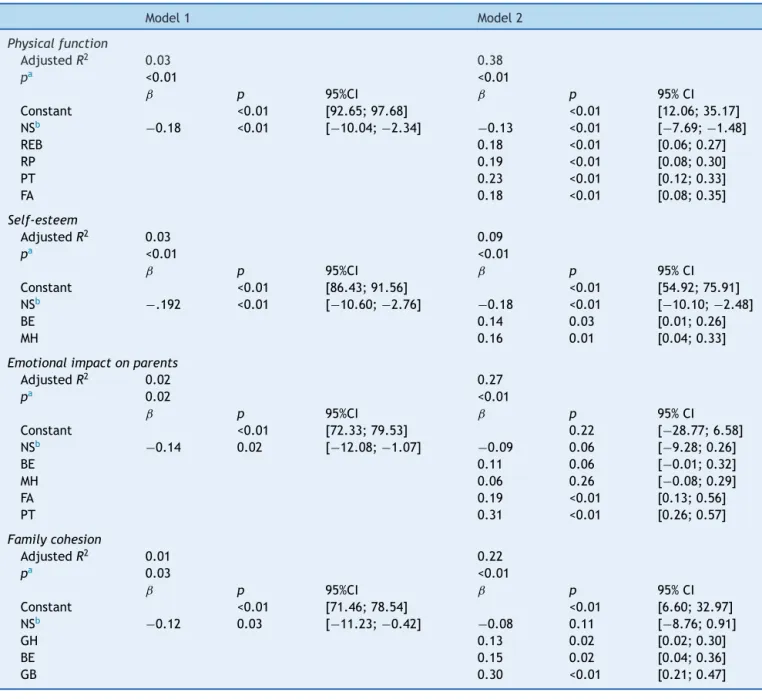
For the dependent variable self-esteem, a model of lowvarianceexplanation(R2=0.10,p≤0.01)wasobtained withthevariablesnutritionalstatus,behavior,andmental health. Thevariablethat contributedthemostnegatively to the model was nutritional status (ˇ=−0.18; p≤0.01). For the dependent variable parental impact-emotional, a
modelofhighvarianceexplanation(R2=0.28;p<0.05)was obtainedforthevariablesnutritionalstatus,globalhealth, behavior, mental health, family activities, and parental impact-time. The variable that most contributed to the model was the parental impact-time (ˇ=0.31, p<0.05). Regarding the family cohesion domain as the dependent
Table3 Spearman’scorrelationcoefficientsbetweenqualityoflifescoresobtainedthroughCHQPF-50andsociodemographic variablesofchildrenandadolescentsofthestudy.
NS GGH PF REB RP BE GBE MH SE PE PT FA FC
NS 1
GGH −0.1 1
PF −0.2b 0.2b 1
REB 0.0 0.2b 0.4b 1
RP −0.1a 0.2b 0.3b 0.6b 1
BE −0.1 0.4b 0.2b 0.3b 0.2b 1
GBE 0.0 0.4b 0.1 0.2b 0.1 0.5b 1
MH 0.0 0.3b 0.2b 0.2b 0.1a 0.5b 0.3b 1
SE 0.3b 0.2b 0.2b 0.2b 0.2b 0.3b 0.2b 0.3b 1
PE −0.1a 0.3b 0.3b 0.3b 0.2b 0.4b 0.2b 0.3b 0.3b 1
PT −0.1 0.2b 0.4b 0.4b 0.3b 0.3b 0.2b 0.2 0.2b 0.5b 1
FA 0.0 0.3b 0.4b 0.4b 0.3b 0.4b 0.4b 0.4b 0.3b 0.5b 0.5b 1
FC −0.1a 0.3b 0.1 0.0 0.1 0.3b 0.4b 0.2b 0.1 0.2b 0.1a 0.2b 1
GGH,globalhealth;PF,physicalfunctioning;REB,role/sociallimitations-emotional/behavioral;RP,role/sociallimitations-physical;BE, behavior;GBE,globalbehavioritem;MH,mentalhealth;SE,self-esteem;PE,parentalimpact-emotional;PT,parentalimpact-time;FA, familyactivities;FC,familycohesion;NS,nutritionalstatus.
Spearman’scorrelationtest.
Table4 Multiplelinearregressionmodelsforassociationsbetweenself-esteem,nutritionalstatus,andpsychologicaldomains ofqualityoflife.
Model1 Model2
Physicalfunction
AdjustedR2 0.03 0.38
pa <0.01 <0.01
ˇ p 95%CI ˇ p 95%CI
Constant <0.01 [92.65;97.68] <0.01 [12.06;35.17] NSb −0.18 <0.01 [−10.04;−2.34] −0.13 <0.01 [−7.69;−1.48]
REB 0.18 <0.01 [0.06;0.27]
RP 0.19 <0.01 [0.08;0.30]
PT 0.23 <0.01 [0.12;0.33]
FA 0.18 <0.01 [0.08;0.35]
Self-esteem
AdjustedR2 0.03 0.09
pa <0.01 <0.01
ˇ p 95%CI ˇ p 95%CI
Constant <0.01 [86.43;91.56] <0.01 [54.92;75.91] NSb −.192 <0.01 [−10.60;−2.76] −0.18 <0.01 [−10.10;−2.48]
BE 0.14 0.03 [0.01;0.26]
MH 0.16 0.01 [0.04;0.33]
Emotionalimpactonparents
AdjustedR2 0.02 0.27
pa 0.02 <0.01
ˇ p 95%CI ˇ p 95%CI
Constant <0.01 [72.33;79.53] 0.22 [−28.77;6.58]
NSb −0.14 0.02 [−12.08;−1.07] −0.09 0.06 [−9.28;0.26]
BE 0.11 0.06 [−0.01;0.32]
MH 0.06 0.26 [−0.08;0.29]
FA 0.19 <0.01 [0.13;0.56]
PT 0.31 <0.01 [0.26;0.57]
Familycohesion
AdjustedR2 0.01 0.22
pa 0.03 <0.01
ˇ p 95%CI ˇ p 95%CI
Constant <0.01 [71.46;78.54] <0.01 [6.60;32.97] NSb −0.12 0.03 [−11.23;−0.42] −0.08 0.11 [−8.76;0.91]
GH 0.13 0.02 [0.02;0.30]
BE 0.15 0.02 [0.04;0.36]
GB 0.30 <0.01 [0.21;0.47]
GGH,generalhealth;REB,role/sociallimitations-emotional/behavioral;RP,role/sociallimitations-physical;BE,behavior;GBE,global behavioritem;MH,mentalhealth;PT,parentalimpact-time;FA,familyactivities;NS,nutritionalstatus.
aANOVA.
b Reference:normalweightnutritionalstatus.
variable,significantresults wereobserved in both models (p<0.05), with moderate variance explanation with the variables nutritional status, global health, behavior, and globalbehavior(R2=0.23;p<0.05).Thevariablethatmost contributed to the model was global behavior (ˇ=0.30; p<0.05;Table4).Thephysicalandpsychosocialsummaries wereexcludedfromthemultipleregressionanalysistoavoid themulticollinearityphenomenon.
Discussion
The present study demonstrated that the caregivers perceived physical and psychosocial impairment in the
HRQOL in children and adolescents with overweight and obesityinthedomainsphysicalfunction,self-esteem, emo-tional impacton parents andfamily cohesion, and in the physical and psychosocial summaries. However, the hier-archical multiple regression modelsindicated that excess weightwasnotthe maindeterminingfactor forthe nega-tiveimpactonmostdomainsoftheCHQ-PF50.Thepresence ofoverweight/obesitywasamajorcontributingfactoronly fortheself-esteemdomain.
Previous studies have also found that the presence of overweightorobesityisrelatedtomultidimensional impair-mentintheHRQOLofchildrenandadolescents.7,15
resultinginfewerfriends,lessaffectionfromparents,and poorerschool performance. Withthe experienceof being bullied,bothinthetraditionalandthecyberversions,the obese adolescent has little motivation to perform physi-calactivity,avoidshealthylifestyles,andmayhavesuicidal ideation.16 Additionally,itisknownthatthosewhoremain obesefor more thanfour yearsandhave low self-esteem are more likelyto develop risk behaviors such asalcohol consumption andsmoking, when comparedtotheir obese peerswithnormalself-esteem.17
Adolescenceisastagewhenpeerapprovalisimportant for self-esteem development.17 Therefore, the bullying, criticism, and social isolation that many of these chil-dren andadolescentsexperience,whetherby theirfamily or friends, impair the development and consolidation of self-esteem,resultinginemotionalproblemssuchas depres-sion,anxiety,low self-esteem,and lowappraisal ofone’s body.15,17,18Itshouldalsobeconsidered,asindicatedinthe presentstudy,thatotherfactorscontributetotheimpaired perceptionofpsychosocialwell-being,suchasdisturbance in the family environment (emotional impact onparents) andpoorfamilycohesion.19
The parents’timelimitationalsoappearstocontribute toaworseperceptionofHRQOLrelatedtophysicalfunction in children and adolescentswith overweight or obesity.20 Inthepresent study,this variableaccounted forthe high-est contribution to the variance of the physical function model.Althoughparentsofchildren/adolescentswith over-weight/obesity alsoassigned poorer qualityof life to the physical function of their children in previous studies,21 the results of the present study lead to the conclusion that the nutritional status exerts less influence in this observation.
While acknowledging that parents generally underesti-mate the weight of their children and do not recognize overweight or obesity asa disease,22 this study identified anemotionalimpactonparents.However,arecentstudy23 demonstrated a greater awareness of parents about the realweightoftheirchildrenbyconcludingthatoverweight mothers have a higher concern for the future weight of theirchildren,evenwhenthesehavenormalweight. Addi-tionally, parents with overweight or those who perceive thattheir child’sweightconstitutesa health problemare morewillingtoadoptchangestohelptheirchildren.24 For theseparents, the nutritionalstatusof their children can bring concerns about their health, behavior, well-being, and school performance.20 In addition to the emotional impact observed on parents of children/adolescents with overweight/obesity,theneedtogettheminvolvedintheir children’streatmentrequiresachangeintheirlifestyle.This involvementisoftendifficult,asmanyparentsreportlack oftimetosupervisetheirchildren’snutritionandphysical activities.25 The parents’ behavior is of great importance in thetreatment of these children andadolescents,asin earlychildhoodparents serveasmodelsandprovidersfor children.26 Thus, parents areoften the target of preven-tive public health interventions aimed at improving the child’sdiet,26aspreventioniscurrentlyconsideredtobethe mosteffectivemeasuretocontrolchildhoodobesity.27 Pro-gramsofchildhoodobesitypreventionandtreatment that arebasedonfamilybehaviorareamongthemosteffective and,therefore,haveshownthatparentalinvolvementisthe
keyforthesuccessofhealthpoliciesaimedatchildrenand adolescents.28
Previousstudieshaveshownpoorerqualityoflifeamong obesefemalechildrenandadolescents,fromthe perspec-tiveofparents.5However,thisdifferencewasnotobserved inthisstudy.Thefactthatthestudypopulationwasatthe beginningof pubertymayexplain thisfinding. At thisage range,the adolescent hasyet toexperience the changes that aretypical of this phase, which usually occursafter theageof12(menarcheandhormonalchanges),29 theage atwhichthedifferencesbetweengendersstarttobecome evident.6
This study brings important contributions by showing theimportanceoftheparents’perspective onthe HRQOL of children andby assessing the magnitude of the differ-encesregarding the perceptionof HRQOL ofchildren and adolescentsaccording to their nutritional status.Another important contribution refers to building comprehensive modelsinanattempttoevaluatethebehaviorofagreater numberofstudiedvariablesinthevariationofHRQOLscores ofchildrenandadolescentsinthestudy.
However,somelimitationsshouldbementioned.Thiswas across-sectionalstudy,whichdoesnotallowforthe assess-mentofthecause-and-effectassociationbetweenthestudy variables.Thereductioninthestudysamplesizeduetoloss ofdatamayhavemaskedpossibledifferencesinqualityof lifescoresoftheanalyzedgroups.However,lossesrelatedto difficultiesinherenttoCHQ-PF50arecommonlyobservedin thestudiesthatusethistool.5Althoughtheoutcomesofthe presentstudyarerestrictedtotheagegroupof9---12years, it is known that adolescence is a very important period forthepsychosocialdevelopmentofyoungindividuals.The onsetofpubertycanbeconsideredasthemomentinwhich someonehasagreaterawarenessoftheirownbodysize,18 anditisdescribedastheperiodofgreatestvulnerabilityfor thedevelopmentofobesity.30
Fromtheperceptionofparentsorcaregivers, itcanbe concludedthat there is a negative impacton the HRQOL of children and adolescents with overweight and obesity regardingthephysicalandpsychosocialaspects.Theimpact onparents’timewasthevariablethatmostcontributedto theperceptionofphysicalfunctionoftheirchildren.Excess weightwasthevariablewiththe highest negativeimpact whenassessingtheself-esteemofchildrenandadolescents inthisstudy.Knowingtheperceptionofparentsaboutthe impactof obesity onquality of life of their children and thevariablesinvolved in thisperception iscrucialfor the involvementofthesecaregiversinthepreventionand treat-mentofobesity.
Funding
Fundac¸ãodeAmparoàPesquisadoEstadodeMinasGerais (FAPEMIG)(PPM-00306-8);ConselhoNacionalde Desenvolvi-mentoCientíficoeTecnológico(CNPq)(40973/2006-0).
Conflicts
of
interest
Acknowledgements
TotheFundac¸ãodeAmparoàPesquisadoEstadodeMinas Gerais(FAPEMIG)andConselhoNacionaldeDesenvolvimento CientíficoeTecnológico(CNPq)fortheirfinancialsupportto thisresearchproject.
References
1.IBGE.InstitutoBrasileirodeGeografiaeEstatística.POF--- Medi-das Antropométricas de crianc¸as e adolescentes 2008/2009. Availablefrom:http://www.ibge.gov.br[cited16Mar2014]. 2.TheNS,SuchindranC,NorthKE,PopkinBM,Gordon-LarsenP.
Associationofadolescentobesitywithriskofsevereobesityin adulthood.JAMA.2010;304:2042---7.
3.SchwimmerJB,BurwinkleTM,VarniJW.Health-related qual-ityoflifeofseverelyobesechildrenandadolescents. JAMA. 2003;289:1813---9.
4.TheunissenNC,VogelsTG,KoopmanHM,VerripsGH, Zwinder-manKA,Verloove-VanhorickSP,etal.Theproxyproblem:child report versusparent reportin health-related quality oflife research.QualLifeRes.1998;7:387---97.
5.Wake M, Salmon L, WatersE, WrightM, Hesketh K. Parent-reported health status of overweight and obese Australian primaryschoolchildren:across-sectionalpopulationsurvey.Int JObesRelatMetabDisord.2002;26:717---24.
6.Michel G, BiseggerC,Fuhr DC, AbelT. Age and gender dif-ferences in health-related quality of life of children and adolescents inEurope: a multilevel analyses. Qual Life Res. 2009;18:1147---57.
7.InternationalAssociationfortheStudyofObesity(IASO); Inter-nationalObesityTaskforce.Childhoodobesity.Availablefrom:
http://www.iotf.org/childhoodobesity.asp[cited10Mar2005]. 8.WorldHealthOrganization(WHO).Physicalstatus:theuseand interpretationofanthropometry.ReportofaWHOExpert Com-mittee.Geneva;1995.
9.Center for Disease Control and Prevention (CDC). National Center for Health Statistics. Growth Charts.Available from:
http://www.cdc.gov/growthcharts[cited10Mar2005]. 10.TsirosMD,OldsT,BuckleyJD,GrimshawP,BrennanL,Walkley
J, etal. Health-relatedqualityoflifeinobese childrenand adolescents.IntJObes(Lond).2009;33:387---400.
11.Kakinami L, Henderson M, Delvin EE, Levy E, O’Loughlin J, LambertM,etal.Associationbetweendifferentgrowthcurve definitionsofoverweightandobesityandcardiometabolicrisk inchildren.CMAJ.2012;184:E539---50.
12.MachadoCS,RupertoN,SilvaCH,FerrianiVP,RoscoeI,Campos LM,etal.TheBrazilianversionofthechildhoodhealth assess-mentquestionnaire(CHAQ)andtheChildHealthQuestionnaire (CHQ).ClinExpRheumatol.2001;19:S25---9.
13.McHorneyCA,WareJE,RachelLuJF,SherbourneCD.TheMOS 36-ItemShortFormHealthSurvey(SF-36):III.Testsofdata qual-ity,scalingassumptions,andreliabilityacrossdiversepatient groups.MedCare.1994;32:40---66.
14.CohenJ.Statisticalpoweranalysisforthebehavioralsciences. 2nded.NewYork:LawrenceErlbaumAssociates;1988.
15.Ul-Haq Z, Mackay DF, Fenwick E, Pell JP. Meta-analysis of theassociationbetween bodymassindex andhealth-related quality of life among children and adolescents, assessed usingthepediatric qualityoflifeinventoryindex. JPediatr. 2013;162:280-6.e1.
16.DeSmet A, Deforche B, Hublet A, Tanghe A, Stremersch E, DeBourdeaudhuijI.Traditionalandcyberbullyingvictimization ascorrelatesofpsychosocialdistressandbarrierstoahealth lifestyleamongseverelyobeseadolescents---amatched case-controlstudyonprevalenceandresultsfromacrosssectional study.BMCPublicHealth.2014;14:224---35.
17.Strauss RS. Childhood obesity and self-esteem. Pediatrics. 2000;105:e15.
18.Witherspoon D, Latta L, Wang Y, BlackMM. Do depression, self-esteem,and eatingattitudes varybyBMIamong African Americanadolescents?JPediatrPsychol.2013;38:1112---20.
19.ArkesJ. Longitudinal association between maritaldisruption andchildBMIandobesity.Obesity.2012;20:1696---702.
20.Chan CM,Wang WC.Qualityof lifeinoverweightand obese youngChinesechildren:amixed-methodstudy.HealthQualLife OutJ.2013;11:33---43.
21.WakeM,CanterfordL,PattonGC,HeskethK,HardyP,Williams J,etal. Comorbiditiesofoverweight/obesity experiencedin adolescence:longitudinalstudy.ArchDisChild.2010;95:162---8.
22.DoolenJ, Alpert PT,Miller SK. Parentaldisconnect between perceivedandactualweightstatusofchildren:ametasynthesis ofthecurrentresearch.JAmAcadNursePract.2009;21:160---6.
23.WarschburgerP,KröllerK.Childhood overweightandobesity: maternalperceptionsofthetimeforengaginginchildweight management.BMCPublicHealth.2012;12:295.
24.RheeKE,DeLagoCW,Arscott-MillsT,MehtaDS,DavisRK. Fac-torsassociatedwithparental readinessto makechangesfor overweightchildren.Pediatrics.2005;116:e94.
25.Rodrígues-Ventura AL, Pelaez-Ballestas I, Sámano-SámanoR, Jimenez-GutierrezC,Aguilar-SalinasC.Barrierstoloseweight from the perspective of children with overweight/obesity and their parents: a sociocultural approach. J Obes. 2014: 1---7.
26.Clark HR, Goyder E, Bissell P, Blank L, Peters J. How do parents’child-feedingbehavioursinfluencechildweight? Impli-cationsforchildhoodobesitypolicy.JPublicHealth.2007;29: 132---41.
27.deOnisM.Preventingchildhoodoverweightandobesity.J Pedi-atr(RioJ).2015;91:105---7.
28.GruberKJ,HaldemanLA.Usingthefamilytocombatchildhood andadultobesity.PrevChronicDis.2009;6:A106.
29.Patton GC, Viner R. Pubertal transitions in health. Lancet. 2007;369:1130---9.