Key words:
Prostate; Prostatic Neoplasms; Biopsy; Diagnosis;
Gene Expression; PSMA ADC [Supplementary Concept]
Int Braz J Urol. 2013; 39: 649-56
__________________ Submitted for publication: August 02, 2012
__________________ Accepted after revision: April 18, 2013
Purpose: The discovery of new diagnostic tools for the diagnosis of prostate cancer (PCa) has become an important field of research. In this study, we analyzed the diagnostic va-lue of the expression of the pepsinogen C (PGC) and prostate-specific membrane antigen (PSMA) genes in tissue samples obtained from prostate biopsies.
Materials and Methods: This study was comprised of 51 consecutive patients who un-derwent transrectal ultrasound (TRUS)-guided prostate biopsies between January 2010 and March 2010. The biopsies were performed with 12 cores, and an additional core was randomly retrieved from the peripheral zone from each patient for study purposes. The expression of the PGC and PSMA genes was analyzed from the cDNA from the samples via the qRT-PCR technology. The expression patterns of patients with PCa were compared with those of patients without a PCa diagnosis.
Results: PSMA was overexpressed in only 43.4% of PCa cases, and PGC was overexpres-sed in 72.7% of cases. The median expression of PSMA was 1.5 times (0.1 to 43.9) and the median PGC expression was 8.7 times (0.1 to 50.0) the expression observed in prostatic tissue from TRUS-guided biopsies of normal patients. Analysis of patients with high-risk PCa indicated that PGC was overexpressed in 71.4% of cases (with a median expression of 10.6 times), and PSMA was overexpressed in only 35.7% of cases (with a median ex-pression of 4.5 times). Among patients with low-risk PCa, PGC was also overexpressed in 71.4% of cases (with a median expression of 5.9 times), and PSMA was overexpressed in only 42.8% of cases (with a median expression of 2.5 times).
Conclusions: PGC gene expression is significantly higher in prostatic tissue in men affec-ted by PCa when compared to normal prostates. Further analyses are necessary to con-firm our results.
INTRODUCTION
During TRUS-guided prostate biopsies, the peripheral zone is sampled in a random fashion because ultrasonography is largely unable to di-fferentiate tumors from benign tissue. As a conse-quence, TRUS-guided biopsies have a high
nega-tive predicnega-tive value, and 20% to 30% of patients with a negative biopsy will, in fact, exhibit cancer on subsequent biopsies (1). Additionally, signifi-cant number of tumors might also be missed be-cause 30-40% of PCa cases are anterior or in the midline transition zone of the prostate (2).
PGC and PSMA in prostate cancer diagnosis: tissue
analysis from biopsy samples
_______________________________________________
Alberto A. Antunes, Sabrina T. Reis, Kátia R. Leite, Danilo M. Real, Juliana M. Sousa-Canavez, Luiz
H. Camara-Lopes, Marcos F. Dall’Oglio and Miguel Srougi
Laboratory of Medicine Investigation, Division of Urology, University of Sao Paulo Medical School (AAA, STR, KRL, DMR, MFD, MS) and Genoa Biotechnology SA (KRL, JMS, LHC), São Paulo, Brazil
ABSTRACT
ARTICLE
INFO
Researchers have sought a method that could identify cases in which TRUS leads to a false-negative result to avoid performing repeated biopsies with increased morbidity. Therefore, the development of new imaging platforms with MRI--fused images (3) and the discovery of new biolo-gical markers in serum, urine and prostatic tissue (4) have become important fields of research.
PGC is an aspartyl proteinase that is main-ly involved in the digestion of proteins in the sto-mach. PGC is synthesized in the gastric mucosa and secreted into the gastric lumen, where it is converted into the active enzyme pepsin C un-der acidic conditions (5,6). Surprisingly, previous studies have reported ectopic expression of PGC in several carcinomas of extragastric origin. As a type II membrane protein with folate hydrolase activity, PSMA is produced by the prostatic epi-thelium (7). The role of PSMA in prostate carci-nogenesis is unknown, and because it is highly expressed in localized and metastatic PCa, the pri-mary clinical applications of PSMA have been as a marker of the presence of metastatic PCa cells in the circulatory system and as a target protein for the immunotherapy of PCa (8).
We recently analyzed the expression levels of PGC and PSMA in prostatic tissue and conclu-ded that these genes may constitute an adjuncti-ve method to prostate biopsy in the diagnosis of PCa cases (9). The aim of the present analysis was to describe the diagnostic function of these genes using tissue samples obtained from TRUS-guided prostate biopsies.
MATERIALS AND METHODS
Patients and Tumor Samples
This study was comprised of 51 consecutive patients who underwent TRUS-guided prostate biop-sies between January 2012 and March 2012. Biop-sies were performed with 12 cores, and an additio-nal core was randomly retrieved from the peripheral zone from each patient for the study purpose. These additional cores were immediately frozen at - 80º C, and the 12 standard cores underwent traditional pathological analysis. Prior written and informed consent was obtained from each patient, and the study was approved by the ethics committee of the
Hospital das Clinicas from University of Sao Paulo Medical School.
Table-1 presents the patients’ demographic data. Indications for TRUS-guided prostate biopsy included an altered DRE alone (one case), altered serum PSA levels alone (46 cases) and both (six ca-ses). Patients who had undergone previous biopsies, prostatic surgeries or pelvic radiotherapy were not considered for analysis.
RNA Extraction and cDNA Synthesis
For the extraction of total RNA, frozen specimens were sectioned using a cryostat at -30º C into 10 fragments of 10 µm. The sectioned samples were then macerated in liquid nitrogen, and total RNA was extracted with Trizol® accor-ding to a pre-established protocol (Invitrogen Life Technologies). The purity and concentration of the RNA were measured in a spectrophotometer (260/280 nM), and RNA integrity was verified in an Agilent 2100 bioanalyzer (Agilent Technolo-gies). Synthesis of cDNA was performed from at least 5 µg of total RNA with the enzyme M-MLV reverse transcriptase and random primers (Invitro-gen Life Technologies, Carlsbad, California). The reactions were incubated at 65º C for five minutes followed by 37º C for one hour and, finally, 95º C for five minutes. The cDNA reactions were dilu-ted to a volume of 100 µL in nuclease-free water (Invitrogen Life Technologies) and were stored at -20º C until further use.
qRT-PCR and Gene Expression
the formula ΔΔCT = (CT target gene, PC sample - CT endogenous control, PC sample) - (CT target gene, BPH sample - CT endogenous control, BPH sample). The fold change in gene expression was calculated as 2-ΔΔCT. (CT means cycle threshold and PC means prostate cancer).
Statistical analysis
Descriptive statistics was employed to des-cribe the characteristics of the patients, including their age, pre biopsy PSA, DRE, prostate volume, number of biopsy cores and pathological findings. Table 1 - Demographic characteristics of patients.
Variable Patients with positive biopsies
Patients with negative biopsies
p-value
Age (years)
Mean 64.26 63.74 0.838*
Median (min – max) 64 (44-80) 64 (38-79)
DRE
Normal (%) 12 (41.9) 14 (58.1) 0.225# Altered (%) 5 (71.4) 2 (28.6)
Total PSA (ng/ml)
Mean 7.94 6.88 0.561
Median (min – max) 6.28 (1.6-19.3) 6.05 (0.4-16.8)
Total PSA / Free PSA (%)
Mean 14.3 22.1 0.073
Median (min – max) 12.0 (0.02-0.90) 18.5 (0.02-0.90)
TRUS prostate volume (grams)
Mean 59.59 59.97 0.804
Median (min – max) 55.5 (18.7-117.2) 58.75 (20.5-103.4)
Number of cores
Mean 13.81 12.42 0.011
Median (min – max) 13 (12-22) 12 (10-18)
Gleason score
Mean 6.39
---Median (min – max) 6 (6-8)
* t-Student’s test # Fisher’s exact test
A statistician performed all analyses for this study. All pathological findings were reviewed by a single pathologist.
The study’s quantitative variables were ex-pressed as median values and minimum and ma-ximum values, while the qualitative variables were expressed as numbers and percentages. For the comparison of the clinical characteristics of patients with PCa, we employed the Student’s t-test, Fisher’s test and Mann-Whitney’s test. Statistical analysis was performed using SPSS® 15.0 software for Win-dows®, and the significance was defined as p < 0.05.
RESULTS
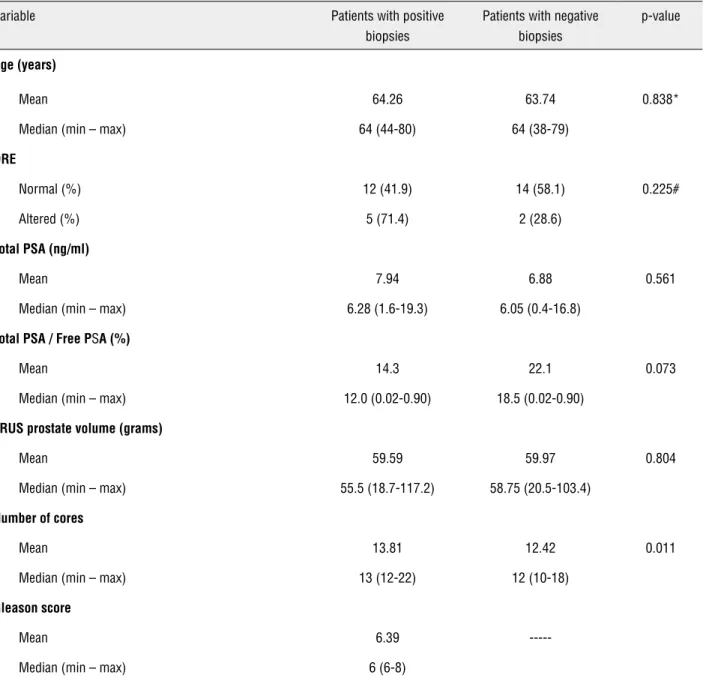
A PCa diagnosis was made in 23 cases. The other pathological findings included acinar atro-phy (13), chronic prostatitis (6), normal prostate (8), BPH (2) and atypical small acinar proliferation (2). Analysis of biopsy samples indicated that, while PSMA was overexpressed in only 43.4% of PCa ca-ses, PGC was overexpressed in 72.7% of cases. The median expression of PSMA was 0.6 times (0.1 to 43.9) (p = 0.656) and the median PGC expression was 2.8 times (0.1 to 50.0) (p = 0.026) that of the genes’ expression in prostatic tissue obtained from normal TRUS-guided biopsies (Figure-1).
According to analysis of the Gleason score, the median PGC expression levels were 2.5 (0 to 50) and 4.1 (0.4 to 34.4) times greater among patients with a low Gleason score (6) and high scores (7 or
8), respectively, in comparison with that of patients with normal biopsies (p = 0.64). Analysis of PSMA expression levels also did not indicate significant differences between patients with low and high Gleason scores (p = 0.26). According to analysis of serum PSA levels, the median levels of PGC expres-sion were 2.5 and 3.1 times greater among patients with low (< 10.0 ng/ml) and high (≥ 10.0 ng/ml) le-vels, respectively (p = 0.61). Median PSMA expres-sion levels also did not differ among patients with low and high PSA levels (p = 0.54).
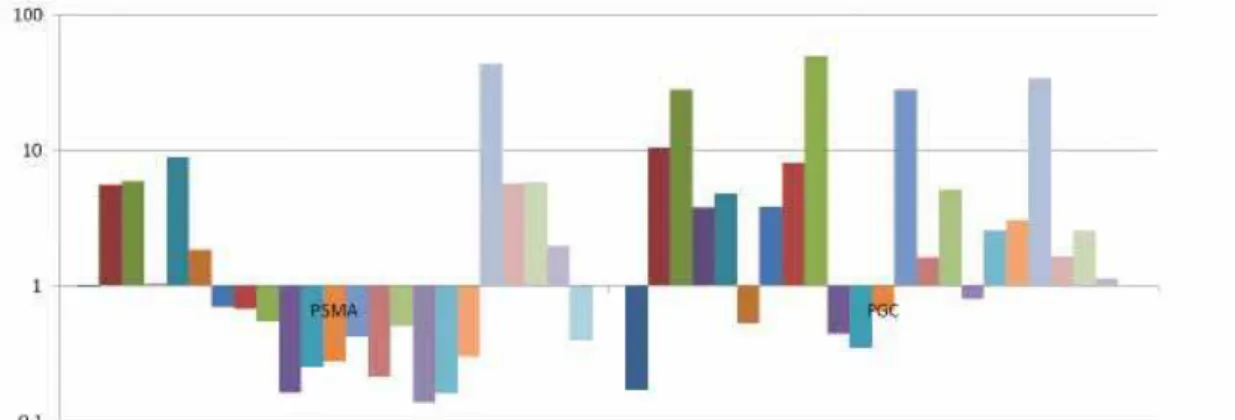
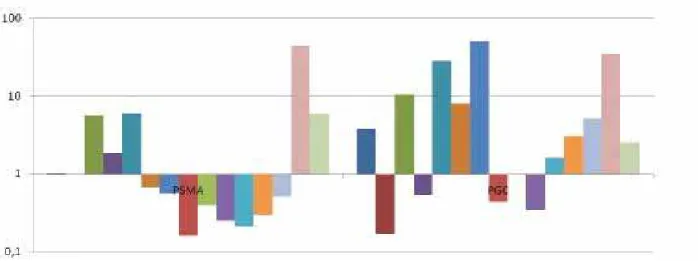
The analysis of patients with high-risk PCa, defined by a serum PSA concentration greater than 10 ng/ml, a Gleason score greater than 6 or a per-centage of positive biopsy cores of 50% or greater, demonstrated that PGC was overexpressed in 71.4% of cases (with a median expression of 3.4 times) and PSMA was overexpressed in only 35.7% of cases (with a median expression of 0.6 times) (Figure-2). Among patients with low-risk PCa, PGC was also overexpressed in 71.4% of cases (with a median ex-pression of 1.6 times) and PSMA was overexpressed in only 42.8% of cases (with a median expression of 0.7 times) (Figure-3). No statistical difference was found between PGC expression of patients with hi-gh-risk and low-risk PCa (p = 0.73).
DISCUSSION
In the present analysis of biopsy samples, we have found that PGC was overexpressed in 72.7% of
patients with PCa and exhibited an overall median expression level almost three times greater than that of patients with normal prostate biopsies. This expression pattern was retained among patients with low-risk and high-risk diseases. Quantitative analysis indicated that PGC gene expression also increased with the worsening of PCa clinical para-meters with a median expression of 1.6 times and 3.4 times that of normal prostatic tissue among
patients with low-risk and high-risk diseases, res-pectively. In contrast, PSMA was overexpressed in only 43.4% of cases with a median expression of only 0.6 times that of normal prostatic tissue.
Many studies have demonstrated that a va-riety of proteolytic enzymes are overproduced by cancer cells or by surrounding stromal cells from the host tissue (10). Extragastric PGC expression has been demonstrated in melanomas and cervical, Figure 2. Quantitative expression of PSMA and PGC in biopsy samples from patients with high risk PCa.
endometrial, ovarian, pancreatic and breast carci-nomas (5,6). In fact, PGC has been associated with a favorable clinical outcome in breast carcinomas (11), however, the exact relevance of this gene to tumors of extragastric origin is unclear (12).
The expression of PGC in the prostate was initially described by Reese et al. (13). Through im-munohistochemical analysis, they observed that, in normal conditions, PGC is found at low levels in the central zone, but not in the peripheral zone. Surprisingly, this condition changes in abnormal glands, with the expression of PGC by peripheral--zone tumors. Diamandis et al. (14) developed mouse monoclonal antibodies (Abs) against the PGC protein using highly purified antigen isolated from the gastric mucosa and employed this assay to measure PGC levels in several organic flui-ds. Interestingly, the highest PGC concentrations were observed in the seminal plasma, followed by breast cyst fluid and amniotic fluid. The resear-chers found no correlation between PSA and PGC concentrations in the serum of PCa patients and concluded that the PGC marker was not useful for either diagnosing or monitoring this malignancy.
Despite these findings, the mechanisms that control PGC expression in the prostate and the functions of the PGC protein have not been thoroughly elucidated. Because of their role in the degradation of the extracellular matrix, proteolytic enzymes are thought to be involved in the process of tumor invasion and metastasis (15). Thus, the lytic properties of PGC may indicate its function in cancer cells, given that other proteinases, such as the matrix metalloproteinase and plasminogen activators, play roles in cancer cells (10). Kohout et al. (16) investigated the proteolytic activity of PGC in normal prostate tissue, in prostate tissue exhibiting BPH and in prostate tissue exhibiting PCa. The PGC activity of the carcinomatous tissue did not differ significantly from the PGC activity observed in the normal prostate. In BPH, the prote-olytic activity of PGC, as assessed by the digestion of hemoglobin, was markedly reduced from that of normal prostate tissue and, when measured by the digestion of synthetic substrates, the proteolytic activity of PGC was practically nonexistent.
Additionally, for unknown reasons, PGC expression seems to be closely associated with
an-drogen receptor expression in the prostate speci-mens of patients with PCa. In a study by Konishi et al. (17), immunohistochemical analysis of tumors obtained from radical prostatectomies demonstra-ted that, while androgen receptors were detecdemonstra-ted in 87% of positive specimens, only 53% of PGC--negative tumors expressed androgen receptors. The authors concluded that PGC might be close-ly related to hormonal alterations associated with the development of prostate tumors. Following this study, the prognostic role of PGC was tested in 28 patients with clinically metastatic PCa. Du-ring follow-up, disease-specific survival was 50% for patients with PGC-negative tumors and 91% for patients whose tumors produced the protein (12). A relationship between PGC and hormonal parame-ters has also been suggested to play a role in breast cancer. The expression of PGC by mammary car-cinomas and cysts, but not by the normal, resting mammary gland, has led to the hypothesis that this gene may be a biochemical marker of the hormonal imbalance underlying these pathologies and may reflect the existence of cancer-associated hormonal receptor pathways (11,18).
Importantly, some characteristics of the pre-sent analysis may explain the differences between the results of this study and those of our previous report. First, in the present series, the additional core retrieved for analysis was not stained with he-matoxylin and eosin for the verification of tumor presence or absence. For this reason, most cores re-trieved from patients with PCa diagnoses may not have exhibited adenocarcinoma within the core, and it is also possible that additional cores retrie-ved from patients without PCa diagnoses contained evidence of adenocarcinoma. However, considering that in our previous analysis the expression pat-terns of PSMA and PGC were maintained in other parts of the gland beyond the tumor area, which suggests a genetic alteration of the entire prostate (9), we did not conduct a pathological analysis of the extra cores.
analyzed the regional distribution of PGC within the prostate through the analysis of sections obtai-ned from the central zones, peripheral zones and seminal vesicles exposed to antibodies against PGC. Specimens were taken from 10 prostates removed during radical prostatectomies or cystectomies. Formalin-fixed tissue from the autopsy-derived prostates of four men in the third decade and from six patients with BPH nodules was also examined. They found that, in 90% of seminal vesicles and 70% of central-zone samples, more than 50% of the cells stained positive for PGC. By contrast, in 90% of peripheral-zone samples, staining was present in 5% or less of the epithelial cells. Similarly, PGC activity in the four autopsy prostates was observed almost entirely within the central zone and ended abruptly at the boundary between the peripheral and central zones. This condition appears to be al-tered in abnormal glands, with the observation of PGC expression by peripheral zone tumors (17). In our study, using the qRT-PCR technology, we de-tected PGC expression even in the peripheral zones of prostates without carcinoma. However, quanti-tative analysis indicated that median PGC expres-sion levels were 2.8 times higher among patients with PCa diagnoses. Finally, the sample size of our present study is relatively small, which might have precluded an accurate analysis of the high-risk and low-risk PCa cases.
Some limitations of the present analysis should be pointed out. Sample size was relatively small and further analysis with a larger number of patients should be performed to confirm the results. Since this was not a randomized study, after patient selection we noted that patients with PCa diagnosis had more biopsy cores taken. Despite a statistically significant result, we don’t believe that this could have influenced the results from the clinical point of view.
Finally, to confirm the actual role of the-se markers in the clinical practice we will perform a prospective study including patients who have a negative prostate biopsy and a rising PSA level to find out if they will have cancer in a second biopsy. Additionally, in the present series, we are going to follow the cases with a negative biopsy in which we know PGC expression to find out who is going to be diagnosed with PCa in the future.
CONCLUSIONS
PGC gene expression is significantly hi-gher in prostatic tissue in men affected by PCa. Further analysis with a larger sample size and with the goal of determining the mechanism of function of PGC in the prostate is necessary to confirm our hypothesis.
ABBREVIATIONS
PCa = Prostate cancer
PSA = Prostate-specific antigen PGC = Pepsinogen C
PSMA = Prostate-specific membrane antigen DRE = Digital rectal examination
TRUS = Transrectal ultrasound
qRT-PCR = Quantitative reverse-transcription polymerase chain reaction
BPH = Benign prostatic hyperplasia RNA = Ribonucleic acid
cDNA = Complementary deoxyribonucleic acid
CONFLICT OF INTEREST
None declared.
REFERENCES
1. Djavan B, Ravery V, Zlotta A, Dobronski P, Dobrovits M, Fakhari M, et al.: Prospective evaluation of prostate cancer de-tected on biopsies 1, 2, 3 and 4: when should we stop? J Urol. 2001; 166: 1679-83.
2. McNeal JE, Redwine EA, Freiha FS, Stamey TA: Zonal distribu-tion of prostatic adenocarcinoma. Correladistribu-tion with histologic pattern and direction of spread. Am J Surg Pathol. 1988; 12: 897-906.
3. Rastinehad AR, Baccala AA Jr, Chung PH, Proano JM, Krueck-er J, Xu S, et al.: D’Amico risk stratification correlates with degree of suspicion of prostate cancer on multiparametric magnetic resonance imaging. J Urol. 2011; 185: 815-20. 4. Aubin SM, Reid J, Sarno MJ, Blase A, Aussie J, Rittenhouse
5. Foltmann B: Gastric proteinases--structure, function, evolu-tion and mechanism of acevolu-tion. Essays Biochem. 1981; 17: 52-84.
6. Merino AM, Vázquez J, Rodríguez JC, Fernández R, Quintela I, González LO, et al.: Pepsinogen C expression in tumors of extragastric origin. Int J Biol Markers. 2000; 15: 165-70. 7. Kinoshita Y, Kuratsukuri K, Landas S, Imaida K, Rovito PM Jr,
Wang CY, et al.: Expression of prostate-specific membrane an-tigen in normal and malignant human tissues. World J Surg. 2006; 30: 628-36.
8. Bander NH, Milowsky MI, Nanus DM, Kostakoglu L, Vallab-hajosula S, Goldsmith SJ: Phase I trial of 177lutetium-labeled J591, a monoclonal antibody to prostate-specific membrane antigen, in patients with androgen-independent prostate can-cer. J Clin Oncol. 2005; 23: 4591-601.
9. Antunes AA, Leite KR, Sousa-Canavez JM, Camara-Lopes LH, Srougi M: The role of prostate specific membrane antigen and pepsinogen C tissue expression as an adjunctive method to prostate cancer diagnosis. J Urol. 2009; 181: 594-600. 10. Dos Reis ST, Pontes J Jr, Villanova FE, Borra PM, Antunes AA,
Dall’oglio MF, et al.: Genetic polymorphisms of matrix metal-loproteinases: susceptibility and prognostic implications for prostate cancer. J Urol. 2009; 181: 2320-5.
11. Vizoso F, Sánchez LM, Díez-Itza I, Merino AM, López-Otín C: Pepsinogen C is a new prognostic marker in primary breast cancer. J Clin Oncol. 1995; 13: 54-61.
12. Díaz M, Rodríguez JC, Sánchez J, Sánchez MT, Martín A, Me-rino AM, et al.: Clinical significance of pepsinogen C tumor expression in patients with stage D2 prostate carcinoma. Int J Biol Markers. 2002; 17: 125-9.
13. Reese JH, McNeal JE, Redwine EA, Samloff IM, Stamey TA: Differential distribution of pepsinogen II between the zones of the human prostate and the seminal vesicle. J Urol. 1986; 136: 1148-52.
14. Diamandis EP, Nadkarni S, Bhaumik B, Abdelrahman A, Me-legos DN, Borchert G, et al.: Immunofluorometric assay of pepsinogen C and preliminary clinical aplications. Clin Chem. 1997; 43: 1365-71.
15. Gottesman M: The role of proteases in cancer. Semin Cancer Biol. 1990; 1: 97-160.
16. Kohout J, Kucerová Z, Korbová L, Simon V, Cypriánová A: Pepsinogen C in the human prostate. Rozhl Chir. 1989; 68: 122-7.
17. Konishi N, Nakaoka S, Matsumoto K, Nakamura M, Kuwashi-ma S, Hiasa Y, et al.: Expression of pepsinogen II with an-drogen and estrogen receptors in human prostate carcinoma. Pathol Int. 1999; 49: 203-7.
18. Diez-Itza I, Merino AM, Tolivia J, Vizoso F, Sánchez LM, López-Otín C: Expression of pepsinogen C in human breast tumours and correlation with clinicopathologic parameters. Br J Can-cer. 1993; 68: 637-40.