Thermal skin reference values in healthy late pregnancy
Ricardo Simoes
a,b,c,d,n, Ricardo Vardasca
a, Cristina Nogueira-Silva
c,d,e aInstitute for Polymers and Composites—IPC/I3N, University of Minho, Campus de Azure´m, 4800-058 Guimar~aes, Portugal bPolytechnic Institute of Ca´vado and Ave, Campus do IPCA, 4750-810 Barcelos, Portugal
cLife and Health Sciences Research Institute (ICVS), School of Health Sciences, University of Minho, Campus de Gualtar, 4710-057 Braga, Portugal dICVS/3B’s
—PT Government Associate Laboratory, Braga/Guimaraes, Portugal~
eDepartment of Obstetrics and Gynecology, Hospital de Braga, Sete Fontes, S. Victor, 4710-243 Braga, Portugal
a r t i c l e
i n f o
Article history:
Received 18 April 2012 Accepted 26 July 2012 Available online 7 August 2012
Keywords:
Obstetrics Pregnancy Thermal imaging Thermal symmetry Thermography
a b s t r a c t
Digital thermal imaging has been employed in medicine for over 50 years. However, its use has been focused on vascular, musculoskeletal and neurological conditions, while other potential applications, such as obstetrics, have been much less explored.
This paper presents a study conducted during 2011 at the Hospital of Braga on a group of healthy pregnant women in the last third of gestation. The analysis focused on characterizing typical pregnant women steady temperature profiles in specific defined regions of interest (ROI), and determining if the thermal symmetry values for late pregnant healthy women are in line with the values for non-pregnant healthy women.
A temperature distribution pattern was found in the defined ROI. The obtained thermal symmetry value had a maximum of 0.370.21C, and there was no evidence for the influence of age (p40.05) in the observed group. The influence of the BMI requires further investigation since one ROI (P2 right) presented ap¼0.059, close to the threshold of statistical evidence in the influence of BMI. The study group presented symmetry values in line with non-pregnant reference values, but the profiles in temperature distribution are different. Assumptions can therefore now be used with higher confidence when assessing abnorm-alities in specific pathologic states during pregnancy using the defined ROI. This work represents a first contribution towards establishing guidelines for future research in this specific field of study.
&2012 Elsevier Ltd. All rights reserved.
1. Introduction
Medical digital thermal imaging (DTI) is a passive, noninva-sive, non-ionizing, complimentary diagnostic and real time monitoring technique that enables visualizing and quantifying changes in skin surface temperature (Gershon-Cohen et al., 1965;
Ring and Ammer, 2000;Ring, 1990). It has the capability to show
in real time physiological changes with high sensitivity to certain pathologies in the vascular, neural and musculoskeletal systems
(Ring and Ammer, 2000;Jones, 1998). The appearance of
equip-ment designed specifically for clinical application, at reasonable cost, the use of standard image capture procedures and computer software for standardized analysis, have facilitated the use of the technique and improved its performance (Jones, 1998).
Labor muscular work and temperature changes in abdomen and cervix have been successfully quantified and monitored by infrared thermography (Yang and Yang, 2001). The technic has also been applied, to a much small degree, to the study of
reproductive disorders (Birnbaum and Kliot, 1964), such as polycystic ovaries, endometriosis, or uterine fibroids.
Subjects presenting a higher Body Mass Index (BMI) have a small metabolic rate and a slow thermoregulation (Houdas and
Ring, 1982). Studies on the effect of BMI in core temperature have
shown that core temperature varies inversely to BMI index value
(Adam, 1989), and that age only had influence after 60 years old
(Varela et al., 2003). Savastano demonstrated with medical DTI that
normal subjects with high BMI presented lower core to skin temperature differences in abdominal regions, but dissipated more heath from the hands (Savastano et al., 2009). The effect of BMI in the temperature distribution is still not clear, and there is a total absence of data for that effect on healthy pregnant females.
The human body usually exhibits a high degree of symmetrical temperature distribution, and the dermal pattern in a healthy individual is fairly consistent and reproducible (Uematsu et al.,
1988;Niu et al., 2001). Medical DTI can register these patterns to
a sensitivity of circa 0.1–0.011C, and deviations from the pattern of symmetry can be identified (Carmeliet and Jain, 2000;Lawson,
1956;Arora et al., 2008). Thermal symmetry of the human body
has been defined and the maximum value accepted with current technology and using a standard procedure is 0.570.31C for two bilateral Regions of Interest (ROI) to be considered symmetrical
Contents lists available atSciVerse ScienceDirect
journal homepage:www.elsevier.com/locate/jtherbio
Journal of Thermal Biology
0306-4565/$ - see front matter&2012 Elsevier Ltd. All rights reserved. http://dx.doi.org/10.1016/j.jtherbio.2012.07.006
n
Corresponding author at: Institute for Polymers and Composites—IPC/I3N, University of Minho, Campus de Azure´m, 4800-058 Guimaraes, Portugal.~
Tel.:þ351 253 510 320; fax:þ351 253 510 339.
contraction, cause abdominal temperature rise (Yang and Yang, 2001), monitored through Laser Doppler or Ultrasonography, slower techniques than medical DTI (Kofinas et al., 1993).
Some of the most common pathologies of pregnancy include hypertensive disease, diagnosed through blood pressure, Laser Doppler and Ultrasonography (Barra et al., 2012), and gestational diabetes, diagnosed with glucose tests (Wei and Yang, 2012;
Gauster et al., 2012). Other complications include venous
insuffi-ciency, diagnosed using Laser Doppler or Ultrasonography, lumbar lordosis, identified using X-ray, and cramps, seen in Electromyo-graphy (Kaaja, 2009;Kelly et al., 2009). Maternal fever can result in intra-uterine hyperthermia and/or inflammation effects on the fetal brain, which may result on premature labor or ultimate fetal death
(Laburn et al., 2003). These complications relate to or influence
blood flow, affecting the skin temperature and are object of being noticed with medical DTI in a fast, safe and inexpensive manner.
The aim of this research was to apply medical DTI in obstetrics, namely to evaluate the skin temperature profile of several ROI in healthy pregnant women and compare them to non-pregnant healthy females, establishing reference values which are missing for healthy pregnant women. This work focused on the last trimester, which exhibits the most significant changes. Based on the reference literature, a significant difference in thermal symmetry of the ROI is not expected, although the temperature is expected to be overall higher in healthy pregnant women.
2. Materials and methods
The study was submitted and subsequently approved by the ethical committee of the Hospital de Braga. The study group included 41 pregnant women in the late gestation period (between 34 and 40 weeks). All volunteers consented to having their vital signals and thermal body image collected. They were recruited at the time of their regular obstetrics appointment at the Department of Obstetrics. All subjects were clinically considered healthy individuals and undergoing a healthy preg-nancy. Informed consent forms have been collected from all subjects. The study group had a gestation time of 36.6571.35 weeks, age of 30.6774.2 years old, and a value of 29.873.9 kg/m2 for the BMI.
For studying the impact of age and BMI, the volunteers were divided in groups:
Age; 18–29 years old (18 subjects) and 30–39 (23 subjects). BMI; normal weight (18.5–24.9, 2 subjects), overweight (25–29.9, 21 subjects), obese type 1 (30–34.9, 14 subjects) and obese type 2 (Z35, 4 subjects).
The FLIRsSC640 (thermal) infrared camera with a resolution of 640480 pixels, a measurement accuracy (bias, offset) of
721C and a precision of70.11C was used to capture the thermal images. For all tests, the camera was placed on a rigid tripod for
statistical tests were used to assure data consistency (Cronbach’s alpha coefficient) and repeatability (Inter-Class Correlation Co-efficient with 95% i.c. interval) in the ROI measurements. In order to run those tests the captured images were analyzed and similar ROIs in that analysis by two experienced researchers in the same set of images that was used as input for the previously outlined statistical tests. The considered set to the results was the set that presented the best thermal symmetry values.
Tests took place between July and December of 2011, at the Hospital of Braga, Portugal. The sampling room had air condition-ing, and was permanently kept at 201C and relative humidity at a value below 50%. Thermal images were recorded with the subjects standing in front of a white wall. The camera remained stationary, and the subject was requested to turn 901 for each subsequent image. In this way, profile images were collected for each perspec-tive quadrant (anterior, left, posterior, and right). Left and right views were collected so that any significant asymmetries in the anterior view could be confirmed in the lateral views; also, as this work included a prospective component, those views were initially collected but the respective data is not in the scope of this publication. This procedure was then repeated with the subjects crossing their palms behind their head, to prevent the upper limbs from obstructing the collected lateral views.
All the subjects on this study had refrained from having a heavy meal, smoke, drinking or use any drug before at least two hours before the appointments. None of them used oil or any ointments, practiced sports, or had physiotherapy in the day of examination. For acclimatization, subjects were in the room for at least 15 min before measurements. They were requested to strip from the waist up and remove any jewelry that could interfere with the experiments.
All collected data was analyzed with the software package provided with the thermal camera, ThermaCAM Researcher Pro-fessional 2.8 SR-2. For the anterior profiles, 6 ROI were defined
(Fig. 1), with A1-left and A1-right concerning the breasts, the
A2-left and A2-right concerning the upper abdomen, and finally the A3-left and A3-right concerning the lower abdomen. In the posterior profiles, 4 ROI were defined, namely P1-left and P1-right concerning the upper back region, and also P2-left and P2-right concerning the lumbar region. The A1 ROI were centered as much as possible on the nipple, and kept within the limit of the breast; the A2 ROI begin above the umbilical region and extend vertically to the end of the upper abdomen; the A3 ROI attempt to capture the shape of the rest of the belly, which in late pregnancy subjects, is relatively easy to trace. The region immediately around the umbilicus was excluded from the anterior ROI.
verify the statistical significance of the relation between age groups and BMI classes with the obtained measurements data per ROI are the non-parametric
w
2and Kruskal–Wallis tests.3. Results
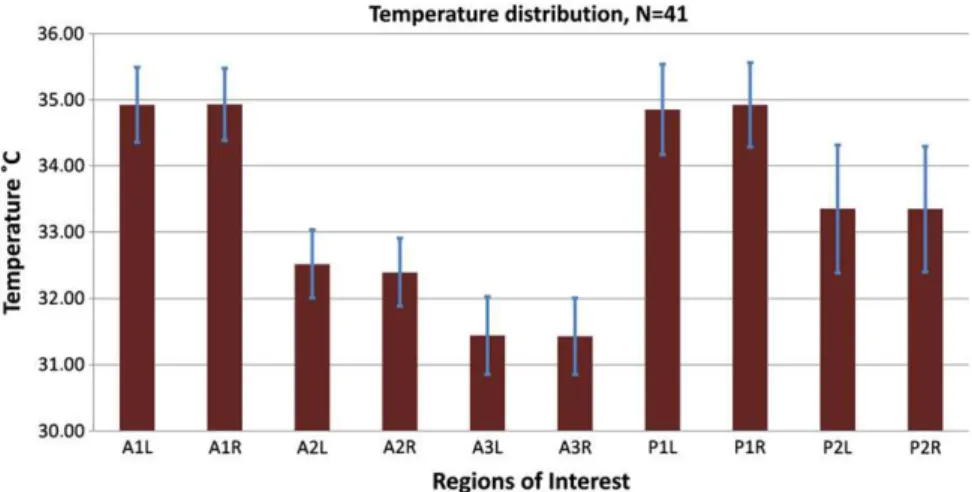
Concerning the posterior view, the majority of the subjects exhibited a temperature profile with similar features to the normal profile of non-pregnant women. The average mean temperature and standard deviation for each ROI for all subjects is presented inFig. 2.
FromFig. 2it can be observed that the highest average mean
temperature in the anterior view is at the A1 ROI and in the posterior view at the P1 ROI. The lowest average mean tempera-ture in the anterior view is at the A3 ROI. The ROI that presented the highest variation in temperature distribution was P2. The similarity between the left and right areas for each ROI is also quite evident from these results; the issue of thermal symmetry is further addressed in a later section.
Thermal gradients have been calculated between the different ROI in the same side and per view. It was found that for both sides the values do not differ much. From ROI A1 to A2 the average gradient value is 2.51C, from A1 to A3 is 3.51C, from A2 to A3 is 11C and on the posterior view from P1 to P2 is 1.51C.
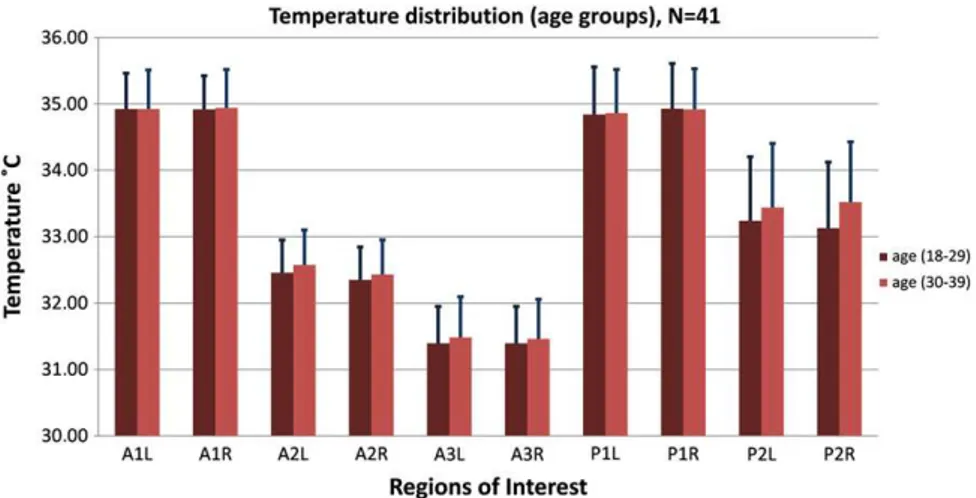
InFig. 3are presented the values of the two defined age groups
for all ROI defined in this research study; it can be observed that both groups present a similar mean temperature values for the ROI.
The distribution of average measured temperature values per the considered BMI classes is shown inFig. 4, where it can be seen that the average mean temperature is affected by the BMI in most ROI, which would be expected due to the effect of fat mass on the human body thermoregulation.
In order to verify the statistical evidence for independence between the defined age groups and also BMI classes in measure-ments of the delineated ROI, the non-parametric
w
2and Kruskal– Wallis tests were run. Concerning age groups, the obtained p values were well above the 0.05 significant independence thresh-old on both tests, meaning there is no statistics to support the hypothesis of discriminating in the sample studied with single measurements subject belonging to the different age groups. Concerning BMI, although none of the ROI had apvalue of less than 0.05, the ROI P2 right was closer to that threshold value (p¼0.059) in thew
2test, which may indicate that, among defined ROI, the lower back region might be the only one to exhibit discrimination between different BMI classes.The internal data measured consistency and the repeatability in the usage of the ROI were assessed statistically and both analyses were performed in the SPSS statistical software package. Results for the coefficients are shown inTable 1, and are very high (40.93), so it can be concluded that the ROI are repeatable and
the data measured has statistical evidence of being internally consistent.
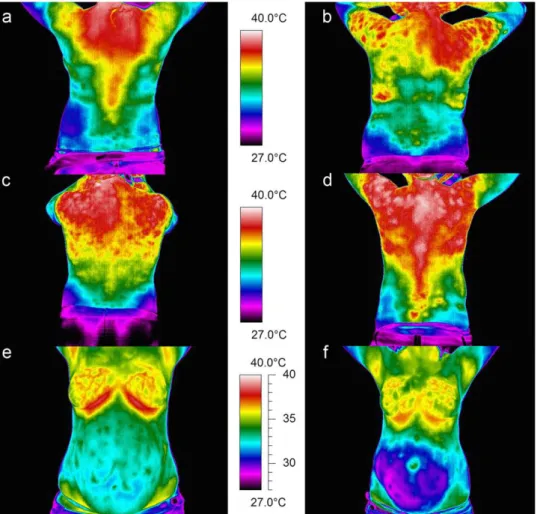
In the tested subjects, profiles very different from the normal for non-pregnant women have been observed. In addition, the majority of subjects has common features in their profile, but some exhibited visually atypical profiles (seeFig. 5).
Fig. 1.Definition of the Regions of Interest (ROI).
The most common posterior profile is that ofFig. 5a, posses-sing several of the characteristics from the normal for non-pregnant women, with the exception of having a higher than expected temperature around the cervical/ higher thoracic region, that may be caused by the posture changes due to the weight of the fetus. Some subjects exhibit a visually asymmetric thoracic profile such as that shown in Fig. 5b. Others have a posterior profile that seems to be divided almost into horizontal bands, with a decreasing temperature gradient from cervical to the sacral regions, as shown inFig. 5c. Finally, some subjects’ profiles are not very different from that inFig. 5a, but with the higher tempera-ture extending considerably in the dorsal region; this is shown in
Fig. 5d.
Of the 41 tested subjects, 28 exhibited a profile similar to
Fig. 5a,4similar toFig. 5b,5similar toFig. 5c, and4similar to
Fig. 5d. It is important to notice that some of these apparently
asymmetric profiles do not actually correspond to quantitatively significant asymmetries; thus the need to evaluate these figures through measurements, and not only from a subjective visual interpretation.
Concerning the anterior view, there are even more significant differences to the normal profile of non-pregnant women, as one could expect in a late gestation period. The vascularization of the breasts is quite obvious in the thermal profiles (seeFig. 5). The profile shown inFig. 5e is quite similar for all tested subjects; one can only distinguish those with most of the chest at approxi-mately the upper abdominal temperature and those where the entire chest region is considerably hotter than the latter. Obviously, the precise breast vascular network varies consider-ably from subject to subject. In the abdominal region, most subjects exhibit the profile of Fig. 5e, but several have visually asymmetric abdominal regions, such as that in Fig. 5f. For all subjects, one clearly notices the significant temperature differ-ences between the chest, breasts and the abdomen.
The values of thermal symmetry were calculated performing an absolute difference between the left and right ROI across the long-itudinal human body main axis. The obtained results are presented
inTable 2. The maximum value obtained was of 0.2670.081C for
the A3 ROI and the minimal was of 0.1770.111C. From these results, the analyzed sample can be considered very symmetrical in thermal symmetry values.
The contralateral difference, calculated as numeric differences (not absolute values), are also represented inTable 2. For ROI A1, A3, and P2, the average thermal differential is near null when the Fig. 3.Mean temperature values per ROI for different age groups.
Fig. 4.Mean temperature values per ROI for different BMI classes.
Table 1
Statistics for the repeatability and data consistency for the different Regions of Interest (ROIs).
ROI Reliability coefficient alpha
Inter-Class correlation coefficient
95% of Confidence interval
A1 0.964 0.931 0.874–0.962
A2 0.969 0.939 0.889–0.967
A3 0.971 0.943 0.897–0.969
P1 0.986 0.973 0.950–0.986
entire sample is considered. However, for the studied subject group, the A2-left ROI was consistently slightly hotter on average than the A2-right. Conversely, the P1-right ROI was consistently slightly hotter than the P1-left. Further investigation is needed to evaluate the causes.
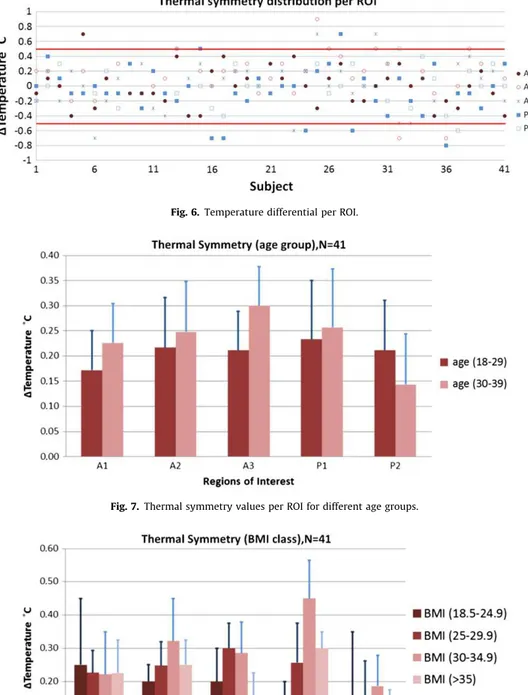
Fig. 6shows a map for the entire study group’s ROI
tempera-ture differences (left–right). From this, it can be observed that the regions where values exceeded thermal symmetry thresholds were in 6 cases in the P1, 4 cases in A3, 3 cases in A2 and 1 case in both A1 and P2 ROI.
Observing the obtained thermal symmetry between age groups, it can be observed in Fig. 7 that for anterior ROI this value is slightly higher for the age group of 30–39 years old.
The thermal symmetry distribution per ROI according to the BMI classes is shown inFig. 8, where there seems to be a strong influence of the BMI on the P1 ROI.
The assessment of statistical evidence of independence between age groups and also between BMI classes, when looking at thermal symmetry values, was performed using the non-parametric
Chi-Square (C-S) and Kruskal–Wallis (K–W) tests. For the age groups, all p values were well above 0.05 in both statistical methods, not showing any statistical reference to relationships between different age groups and the measured value. Concerning the BMI, there is only statistical evidence of discrimination between groups in the P1 ROI in both statistical indicators (respectively withpvalues of 0.026 for C-S and 0.001 for K–W), which might derive from the effect of fetus weight and pressure on the cervical region of the subjects.
4. Discussion
From the obtained results it can be concluded that there is a clear pattern in the temperature distribution in the defined ROI in anterior and posterior views for healthy pregnant subjects. An approximate difference from A1 to A2 of 2.51C, A1 to A3 of 3.51C, A2 to A3 of 11C and P1 to P2 of 1.51C, can be used as a reference in further studies.
In a simplified way, the normal profile for non-pregnant women (Uematsu et al., 1988,Niu et al., 2001) consists of higher temperature in the cervical region, medium temperature along the entire spine, and again higher temperature at the lower lumbar medial region, with a considerably lower temperature at the lateral lumbar regions (lower and upper).
For the study group of healthy pregnant women, the obtained values of thermal symmetry were of 0.270.11C for A1 region, which is in agreement to the values referred in the literature of
0.270.21C (Uematsu et al., 1988) and 0.370.21C (Niu et al.,
2001) for the same area of the human body in healthy Fig. 5.Thermal profiles of the posterior view (a, b, c, and d) and anterior view (e and f).
Table 2
Thermal symmetry values and contralateral differences per ROI.
ROI DMean temperature Ds.d. Mean contralateral difference (left–right)
Contralateral difference s.d.
A1 0.20 0.10 0.01 0.02
A2 0.23 0.09 0.13 0.00
A3 0.26 0.08 0.01 0.00
P1 0.25 0.11 0.07 0.04
non-pregnant subjects. In the A2 and A3 ROI, the values were 0.2570.11C and 0.370.11C respectively, which are in confor-mity with the referenced of 0.270.21C for non-pregnant healthy subjects (Uematsu et al., 1988). In the posterior views the obtained thermal symmetry values were of 0.2570.151C for the P1 and 0.270.151C for the P2 ROI, again in agreement to the literature references of 0.270.21C and 0.370.31C (Niu et al., 2001) or 0.2570.21C and 0.2570.21C (Uematsu et al., 1988) of healthy non-pregnant subjects. The improvement in the obtained results for thermal symmetry could be explained by the improve-ment in the used capture equipimprove-ment, which offered better features than the equipment used between 10 and 20 years ago. Those past examinations occurred in similar environmental
conditions (ambient mean temperature, humidity and absence of air flow), and using an identical protocol for subject, examina-tion room and equipment preparaexamina-tion.
There was no evidence, in this study group, of a correlation between age and thermal symmetry values (p40.05). This can be
explained by the fact that aging issues in temperature distribution and regulation are more evident after 60 years of age, and all subjects were healthy pregnant women aged between 25 and 38 years old. The fact that no significant differences were found matches what is known from the literature for non-pregnant females (Varela et al., 2003).
In the observed sample, even with a considerable amount of overweight subjects, only in the ROI P1 was an effect found from Fig. 7.Thermal symmetry values per ROI for different age groups.
the BMI on the thermal symmetry (po0.05). This might be due to fetal weight and position, and not directly related with the BMI. All other ROIs presented no statistical evidence of influence (p40.05) of this parameter. To clarify this issue and provide a
better understanding of the effect of BMI on the temperature distribution in pregnant women, a more detailed study will be required. In addition to a wider study group, the observation of the temperature of the hands and a dynamic challenge may be considered.
5. Concluding remarks
The typical pregnant women temperature profiles in specific regions of interest (ROI) have been established in this work, through the use of digital thermal imaging. Unfortunately, there is still an absence of an updated software package to aid the record and analysis of medical thermograms in a standardized manner using the most recent thermal image processing techni-ques. Thus, extracting the values for the different ROI and performing a comparative analysis was done manually. This fact is important because the current software is generic or mainly developed for industrial applications that may not need the same aspects in the image analysis. Having a medical oriented applica-tion would facilitate the standardizaapplica-tion of the modality, reducing errors, improving results and enforcing its usage by clinicians.
Thermal symmetry in healthy pregnant subjects between corresponding left and right sides of body was found in this work to have a maximum value of 0.370.21C, which can be used by the majority of clinical practitioners. Having confirmed and improved previous measurements, this benchmark of normal symmetry variance could be of significant value in the assessment of disorders that manifest themselves by unilaterally affecting thermal patterns on the human skin in pregnant women.
Future work will consider the use of dynamic infrared thermo-graphy to underline the sympathetic activity response pattern. The thermographic skin response to cold stimulus and the usage of blood flow modulation is characterized by thermal profiles, which reflect the dynamic balance between heat production and heat loss (Jansky´ et al., 2003). This balance is very important and can provide useful information on thermal physiological aspects of pregnancy. Ongoing work is focused on monitoring pregnancies with associated pathologies in order to establish the influence on the thermal pattern and thus assess the usefulness of the technique in the clinical setting.
Acknowledgments
Foundation for Science and Technology, Lisbon, through the 31
Quadro Comunita´rio de Apoio, the POCTI and FEDER programs, and project PEst-C/CTM/LA0025/2011. Thermal equipment provided through the REEQ/1033/CTM/2005 POCI 2010 program. Project ‘‘Do-IT’’, co-financed by the European Community Fund through COMPETE—Programa Operacional Factores de Competi-tividade. Hospital de Braga for authorizing the study and provid-ing facilities for data collection. We also acknowledge the
collaboration from the entire staff at the Department of Obstetrics and Gynecology of the Hospital de Braga.
References
Adam, K., 1989. Human body temperature is inversely correlated with body mass. Eur. J. Appl. Physiol. 58, 471–475.
Adams, T., Heisey, S.R., Smith, M.C., Steinmetz, M.A., Hartman, J.C., Fry, H.K., 1980. Thermodynamic techniques for the quantification of regional blood flow. Am. J. Physiol. 238, 682–696.
Arora, N., Martins, D., Ruggerio, D., Tousimis, E., Swistel, A.J., Osborne, M.P., Simmons, R.M., 2008. Effectiveness of a noninvasive digital infrared thermal imaging system in the detection of breast cancer. Am.J. Surg. 196, 523–526. Barra, S., Cachulo, M.C., Providˆencia, R., Leitao-Marques, A., 2012. Hypertension in~
pregnancy: the current state of the art. Revista Portuguesa de Cardiologia (English Edition) 31 (6), 425–432.
Birnbaum, S.J., Kliot, D., 1964. Thermography—obstetrical applications. Ann. N.Y. Acad. Sci. 121, 209–222.
Borg-Stein, J., Dugan, S.A., Gruber, J., 2005. Musculoskeletal aspects of pregnancy. Am. J. Phys. Med. Rehabil. 84, 180–192.
Carmeliet, P., Jain, R.K., 2000. Angiogenesis in cancer and other diseases. Nature 407, 249–257.
Gauster, M., Desoye, G., T ¨otsch, M., Hiden, U., 2012. The placenta and gestational diabetes mellitus. Curr. Diab. Rep. 12 (1), 16–23.
Gershon-Cohen, J., Haberman, J.A., Brueschke, E.E., 1965. Medical thermography: a summary of current status. Radiol. Clin. North Am. 3, 403–431.
Houdas, Y., Ring, E.F.J., 1982. Human body temperature—its measurement and regulation. Plenum press, New York.
Jansky´, L., Va´vra, V., Jansky´, P., Kunc, P., Knı´zˇkova´, I., Jandova´, D., Slova´cˇek, K., 2003. Skin temperature changes in humans induced by local peripheral cooling. J. Therm. Biol. 28, 429–437.
Jones, B.F., 1998. A reappraisal of the use of infrared thermal image analysis in medicine. IEEE Trans. Med. Imaging 17, 1019–1027.
Kofinas, A.D., Simon, N.V., Clay, D., King, K., 1993. Functional asymmetry of the human myometrium documented by color and pulsed-wave Doppler ultra-sonographic evaluation of uterine arcuate arteries during Braxton Hicks contractions. Am. J. Obstet. Gynecol. 168, 184–188.
Laburn, H., Faurie, A., Mitchell, D., 2003. The fetus and fever. J. Therm. Biol. 28, 107–116.
Kaaja, R., 2009. Vascular complications in diabetic pregnancy. Thromb. Res. 123 (2), S1–S3.
Kelly, R., Holzman, C., Senagore, P., et al., 2009. Placental vascular pathology findings and pathways to preterm delivery. Am. J. Epidemiol. 170, 148–158. Lawson, R., 1956. Implications of surface temperature in the diagnosis of breast
cancer. Can. Med. Assoc. J. 75, 309–310.
Noonan, T.H., Garrett, W.E., 1999. Muscle strain injury: diagnosis and treatment. J. Am Acad. Orthop. Surg. 7, 262–269.
Niu, H.H., Lui, P.W., Hu, J.S., Ting, C.K., Yin, Y.C., Lo, Y.L., Liu, L., Lee, T.Y., 2001. Thermal symmetry of skin temperature: normative data of normal subjects in Taiwan. Chinese Med. J. (Taipei) 64, 459–468.
Ring, E.F.J., 1990. Quantitative thermal imaging. Clin. Phys. Physiol. Meas. 11(A), 87–95.
Ring, E.F.J., Ammer, K., 2000. The Technique of Infra red Imaging in Medicine. Thermol. Int. 10 (1), 7–14.
Uematsu, S., Edwin, D.H., Jankel, W.R., Kozikowski, J., Trattner, M., 1988. Quanti-fication of thermal asymmetry. Part 1: Normal values and reproducibility. J. Neurosurg. 69, 552–555.
Savastano, D.M., Gorbach, A.M., Eden, H.S., Brady, S.M., Reynolds, J.C., Yanovski, J.A., 2009. Adiposity and human regional body temperature. Am. J. Clin. Nutr. 90, 1124–1131.
Vardasca, R., Ring, E.F.J., Plassmann, P., Jones, C.D., 2012. Thermal Symmetry of the limbs in healthy subjects. Thermol. Int. 22 (2), 53–60.
Varela, M., Jimenez, L., Farina, R., 2003. Complexity analysis of the temperature curve: new information from body temperature. Eur. J. Appl. Physiol. 89, 230–237.
Wei, Y.M., Yang, H.X., 2012. Diagnosis and management of gestational diabetes mellitus in China. Chin. Med. J. 125 (7), 1206–1208.