Article
Printed in Brazil - ©2017 Sociedade Brasileira de Química0103 - 5053 $6.00+0.00*e-mail: yangzhonghua@mail.hzau.edu.cn
Development of Manual Shaking and Ultrasound-Assisted Surfactant-Enhanced
Emulsification Microextraction for Analysis of Organophosphorus Pesticides in
Aqueous Samples
Ya-Bing Xiong, Yue Zhao and Zhong-Hua Yang*
Department of Plant Protection, College of Plant Sciences and Technology, Huazhong Agricultural University, 430070 Wuhan, China
A novel, rapid and efficient manual shaking and ultrasound-assisted surfactant-enhanced emulsification microextraction (M-UASEME) combined with gas chromatography-flame photometric detection (GC-FPD) was developed for the extraction and determination of eight organophosphorus pesticides (OPPs) in tap water and honey samples. The main parameters that affected the extraction efficiency were investigated and optimized. Under the optimum conditions, the relative standard deviation (RSD, n = 6) ranged from 2.4 to 9.3%. Limits of detection (LOD) were varied between 0.005 and 0.05 µg L-1. Good linearity was obtained in a range of 0.5-50.0 µg L-1
for all analytes with the correlation coefficients (r) > 0.9964. Finally, the developed method was successfully applied to determine the eight pesticide residues in real samples. The recoveries of the target analytes in samples were between 82.4 and 96.7%.
Keywords: surfactant, gas chromatography, tap water, honey
Introduction
The traditional liquid-liquid extraction (LLE) method has been in use for many years and taken an important role in the field of sample preparation. However, from the practical point of view, LLE suffered from several inherent drawbacks, such as time consuming, unsatisfactory enrichment factors and the use of large volume of hazardous organic solvents.1
Nowadays, research is focused on environmental, friendly and miniaturized sample pre-treatment technologies. As a result, liquid-phase microextraction (LPME) has been developed as an alternative to conventional LLE method.2,3
The first employment of this method was the single drop microextraction (SDME).4-6 Since its introduction, SDME
was applied in many fields because of using small volume of organic solvent and its safety to operators and environment.7
However, due to the small contact surface between the extraction solvent and the sample, the extraction time required was too long. Meanwhile, low precision and the instability of micro-drop were also problems.8
In 2006, Rezaee et al.9 developed a novel LPME
technique which was termed dispersive liquid-liquid
microextraction (DLLME). In DLLME, the extension of the contact surface between extraction solvent and samples can greatly reduce the extraction time and increase the enrichment factors.10-12 However, it still has a main
drawback, the necessity of using disperser solvent usually decreases the partition of the analytes into the extraction solvent.13
Recently, the use of ultrasound energy to assist the dispersion of the extraction solvent into samples has been reported by Regueiro et al.14 In this method, called
ultrasound-assisted emulsification microextraction (USAEME), the use of a disperser solvent is avoided. However, the extraction time in USAEME is usually prolonged, which indicated low mass-transfer efficiency between sample and extraction solvent.15 Furthermore,
during the long ultrasound process the analytes degradation may occur under some special conditions.16,17 Therefore, the
use of ultrasound alone for extraction of target analytes is not a mild method and is not suitable for all the analytes.
Wu et al.18 developed a novel LPME technique named
ultrasound-assisted surfactant-enhanced emulsification microextraction (UASEME). In this method, the application of a surfactant as emulsifier would take the advantages of both DLLME and USAEME.18 Surfactant will accelerate
the formation of droplets under ultrasound radiations, thus reducing the extraction time. The extraction time in this method18 was about 3 min; a short ultrasound time could
avoid the analytes degradation. Nevertheless, the influence of cloud point effect was one of the main problems. During the ultrasonic and centrifugation process cloud point effect may occur, because both of the processes could increase the sample’s temperature.19-22
In this work, we developed a novel manual shaking and ultrasound-assisted surfactant-enhanced emulsification microextraction (M-UASEME) for the determination of eight organophosphorus pesticides (OPPs) in tap water and honey samples. Various parameters such as the kind and volume of the extraction solvent, the type and concentration of the surfactant, ultrasound time, salt addition and the extraction temperature were evaluated and optimized. The developed M-UASEME method overcomes several drawbacks of the former liquid-phase microextraction methods, while it maintains their advantages.
Experimental
Reagents and materials
All pesticide standards (ethoprophos, fenitrothion, malathion, chlorpyrifos, isocarbophos, methidathion, profenofos, and triazophos) were obtained from Agricultural Environmental Protection Institution (Tianjin, China). The stock standard solutions of each analyte were prepared in acetone at a concentration of 1 g L-1. The standard working
solutions (1 mg L-1) were daily achieved by appropriate
dilution of the stock standard solutions with ultra-high purity water. Both the stock standard solutions and standard working solutions were stored in dark at 4 °C.
All reagents used in this application were of HPLC grade unless otherwise mentioned and all dilutions were carried out using ultra-high purity water (resistivity of 18.2 MΩ cm). Ultra-high purity water was purified by a Milli-Q purification system (Millipore, Bedford, MA, USA). Extraction solvents chlorobenzene, 1,2-dichlorobenzene, and carbon tetrachloride were obtained from Sinopharm Chemical Reagent Co. Ltd (Tianjin, China). Sodium dodecyl sulfate (SDS), cethyltrimethyl ammonium bromide (CTAB), Tween 20, Triton X-100 and Triton X-114 were purchased from Beijing Chemical Reagents Company (Beijing, China).
Instruments
The chromatographic analysis was carried out on an Agilent 6890N gas chromatograph (GC) equipped with a flame photometric detector (FPD) system (Agilent Technologies, Palo Alto, CA, USA). Chromatographic separation was accomplished on an HP-5 (5% phenyl, 95% methylpolysiloxane, 30 m × 0.25 mm i.d. × 0.25 µm) capillary column, obtained from J&W Scientific (Folsom, CA, USA). The injection port was made in the splitless mode at 270 °C with splitless time of 0.5 min. Nitrogen was used as the carrier gas at a flow rate of 1.0 mL min-1.
The detector temperature was set at 250 °C and it was fed with 75 mL min-1 of hydrogen (> 99.999%), 100 mL min-1
of purified compressed air and 25 mL min-1 of nitrogen
(> 99.999%) as auxiliary gas. The temperature-programmed mode was as follows: the initial oven temperature was set at 100 °C and then ascended to 220 °C at the rate of 20 °C min-1, held for 1 min and followed by a 30 °C min-1
ramp to 280 °C, held for 2 min. The total GC run time was 11 min. The identification of the analytes was confirmed by the retention time.
The extractions were performed at 40 kHz of ultrasound frequency and 300 W (KQ 300DB, 300 W, 0-40 kHz, Kunshan Ultrasonic Instrument, Kunshan, China). The centrifugation process was performed at the speed of 3800 rpm for 5 min (RJ-TDL-40B, 0-5000 rpm, Ruijiang Instrument, Wuxi, China). 10.0 µL microsyringe (Gao Ge, Shanghai, China) was used for collecting organic solvent.
Sample preparation
Honey samples
Honey (Bai Hua, 2010) was obtained from the local supermarket. 0.5 g (dry weight) of the honey sample was accurately weighted and diluted with ultra-high purity water to form a 50 g L-1 honey solution.
Tap water samples
Tap water was obtained from Analytical Chemistry Laboratory (China Agriculture University) and the samples were subject to experiment without any pretreatment.
M-UASEME procedure
For the M-UASEME, 5.0 mL aqueous samples were placed in a 10 mL screw cap glass centrifuge tube. 15.0 µL of chlorobenzene as extraction solvent and 5.0 µL of 200 mmol L-1 Triton X-100 as emulsifier (the
was gently shaken three times (about two seconds) by hand, and a cloudy solution was formed. Then the cloudy solution was immersed into an ultrasonic water bath for extraction. The extractions were performed at 40 kHz of ultrasound frequency and 300 W (KQ 300DB, 300 W, 0-40 kHz, Kunshan Ultrasonic Instrument, Kunshan, China) for 10 s at 23 °C. In the whole extraction step, the OPPs were extracted into the fine droplets of chlorobenzene. Then the emulsion was disrupted by centrifugation (RJ-TDL-40B, 0-5000 rpm, Ruijiang Instrument, Wuxi, China). In order to avoid the influence of temperature changes during the centrifugation process, the test tube was wrapped up by absorbent cotton and was stuffed into a 50 mL plastic centrifuge tube. The plastic centrifuge tube was centrifuged at the speed of 3800 rpm for 5 min and the extraction solvent was sedimented at the bottom of the test tube. After that, the sedimented phase was withdrawn by a 10.0 µL microsyringe (Gao Ge, Shanghai, China) and 1.0 µL of collected organic solvent was injected into the GC system for analysis.
Results and Discussion
In order to achieve high extraction recoveries and enrichment factors (EFs), various parameters which could probably influence the extraction were investigated and optimized. The optimization was carried out on an aqueous solution containing 5.0 µg L-1 of each analyte and the
parameters were performed by modifying one at a time while keeping the remaining constant. The enrichment factors (EFs), which were defined as the ratio between the concentration of analyte in the sediment phase and the initial concentration of analyte in the sample, were used to evaluate the extraction efficiency.
Extraction solvent
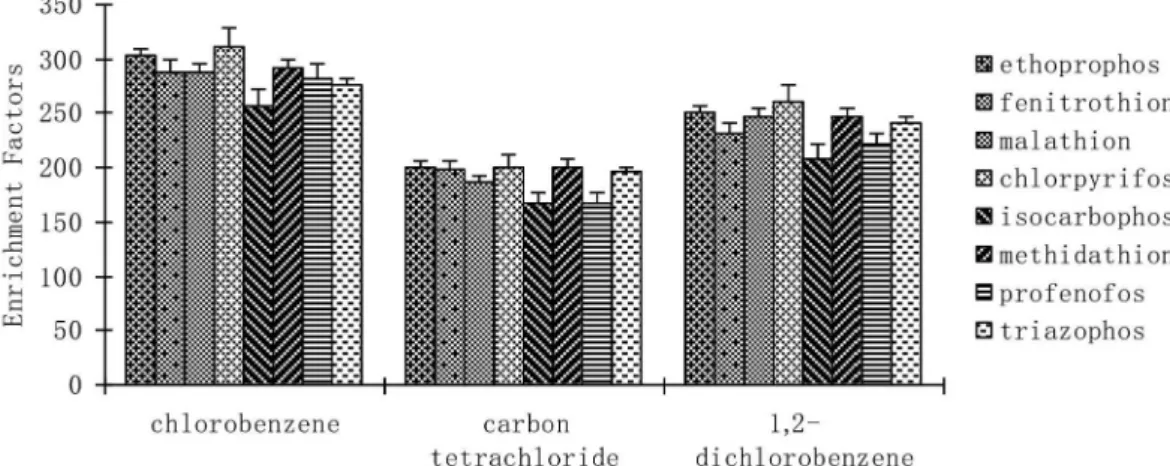
The selection of an appropriate extraction solvent is critical for the establishment of an efficient M-UASEME process. The extraction solvent has to meet the following requirements: it should have a higher density than water, good chromatographic behavior, a low solubility in water, high extraction capability for the target analytes and could form a stable emulsification system under ultrasound energy. Therefore, three organic solvents including chlorobenzene, 1,2-dichlorobenzene, and carbon tetrachloride were examined as possible extraction solvents for M-UASEME. The experiment was performed by using 15.0 µL of each extraction solvent with Triton X-100 as an emulsifier. Figure 1 shows the effect of these extraction solvents on the EFs. As can be seen in Figure 1, when chlorobenzene was used, the highest value of EFs could be achieved. This can be explained by the fact that, chlorobenzene has the closer polarities with the target analytes than the others and these properties could be favorable for the extraction efficiency. Therefore, chlorobenzene was selected.
Extraction solvent volume
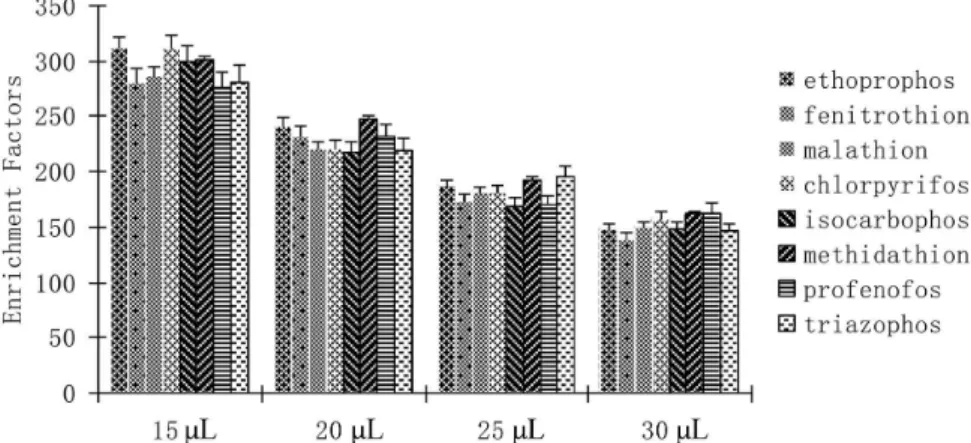
In order to study the effect of extraction solvent volume on the extraction efficiency, a volume range (15.0-30.0 µL) of chlorobenzene was examined. Extraction solvent volume lower than 15.0 µL was not evaluated, because the volume left after phase separation was not enough collected. A series of sample solutions were investigated using different volumes of chlorobenzene. The results (Figure 2) showed that the enrichment factors decreased sharply with the extraction solvent volume ranging from 15.0 to 30.0 µL. The reason for this may be a dilution effect of the analytes
Figure 1. Effect of extraction solvent. Extraction conditions: 15 µL extraction solvent, 0.2 mmol L-1 Triton X-100 used as the surfactant, the extraction
into the resulting organic phase. Therefore, 15.0 µL extraction solvent was selected in the further study (8.0 µL left after extraction).
Type of surfactant
The selection of a surfactant is crucial to the M-UASEME process. In this method, the surfactant, which serves as an emulsifier, could accelerate the emulsification of the extraction solvent into the samples. Different types of surfactant including non-ionic (Triton X-100, Triton X-114, Tween 20), cationic (CTAB) and anionic (SDS) were investigated at 22 °C. Figure 3 shows the variation of the EFs with different surfactants. From Figure 3 we found that, using non-ionic surfactant could get relative high extraction efficiency. The reason for this could be that OPPs have no basic functional groups, so they cannot form ion pair complex with any of the surfactants. Therefore, the enhancement of extraction efficiency was due to the formation of non-ionic intermolecular forces between
analytes and the surfactants. The use of both Triton X-100 and Triton X-114 can get to satisfied results, but the room temperature was 22 ± 1 °C, under which the cloud point effect may occur for Triton X-114 (23 °C). Hence, Triton X-100 was selected as the final surfactant.
Concentration of surfactant
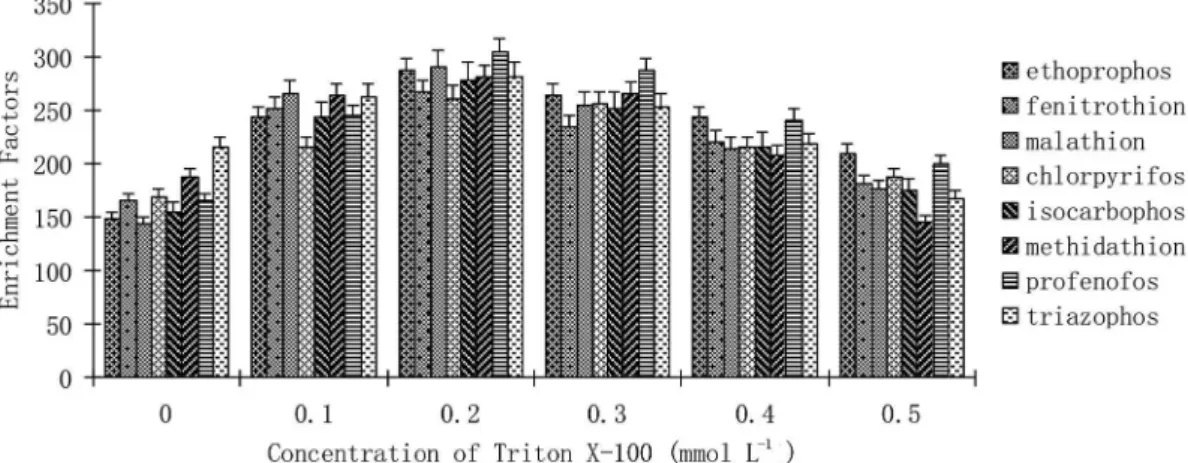
The concentration of the surfactant which begins to form micelles is called the critical micelle concentration (CMC) and the surfactant concentration is also a critical factor in the emulsification and mass-transfer process. Thus, the influence of the concentration of Triton X-100 (0, 0.1, 0.2, 0.3, 0.4, 0.5 mmol L-1) was investigated. The results are
shown in Figure 4 as the surfactant concentration increased from 0 to 0.2 mmol L-1, the EFs also increased. After that,
the EFs began to decrease. The reason for this may be that when the surfactant concentration was lower than the CMC (0.24 mmol L-1), the increase of free surfactant monomer
causes an improved dispersion procedure; whereas, when
Figure 2. Effect of extraction solvent volume. Extraction conditions: chlorobenzene used as extraction solvent, 0.2 mmol L-1 Triton X-100 used as the
surfactant, the extraction time was fixed at 10 s with the ultrasound frequency at 40 kHz and 300 W, no salt (sodium chloride) was added and the extraction process was performed under the room temperature.
Figure 3. Effect of surfactant. Extraction conditions: chlorobenzene used as extraction solvent, 0.2 mmol L-1 surfactant, the extraction time was fixed at
the surfactant concentration was higher than the CMC, a fraction of the analytes can incorporate into the micelles and a low extraction efficiency can be obtained. Therefore, the concentration of Triton X-100 was fixed at 0.2 mmol L-1.
Ionic strength
The addition of salt to aqueous samples generally causes a decrease in solubility of the extraction solvent in samples and has been widely used to enhance the extraction efficiency. To evaluate the influence of ionic strength on the performance of M-UASEME, various concentrations of sodium chloride (NaCl, 0-5%, m/v) were studied. The results revealed that the salt addition of 0-5% (m/v) had no remarkable impact on the EFs. Therefore, based on the experimental result, sodium chloride was not applied for the M-UASEME procedure.
Ultrasound time
In M-UASEME, ultrasound time plays an important role in the emulsification and mass-transfer process and it is defined as the time interval between the addition of both the extraction solvent and surfactant to the sample solution at the end of the sonication stage.12 The dispersion of the extraction
solvent into aqueous samples depended on the ultrasound frequency and time. However, as there is limitation in the ultrasound frequency (40 kHz), the investigation of ultrasound time became more important. Different ultrasound times (0, 10, 20, 30, 60, 120 s) were investigated at ultrasound frequency of 40 kHz. As the extraction time was varied in the range from 10 to 120 s, there was no significant effect on the EFs. It revealed that the addition of shaking process before ultrasound could accelerate the formation of equilibrium state. Short ultrasound time also avoided the
influence of temperature changes during ultrasonic process. Therefore, 10 s was selected for further experiment.
Extraction temperature
Temperature is another important factor that may have an influence on the emulsification phenomenon. The effect of the extraction temperature was evaluated in various temperature ranging from 20 to 35 °C (20, 21, 22, 23, 25, 30, 35 °C, a constant temperature water bath was used). The results indicated that the EFs have no significant change as the temperature increased from 20 to 25 °C (room temperature was 22 ± 1 °C). Under the room temperature the cloud point effect did not happened, so the extraction was conducted at the room temperature.
Quantitative analysis
Under the above optimized experimental conditions, the analytical factors were determined to evaluate the performance of the developed M-UASEME method. The repeatability, expressed as relative standard deviations (RSDs) for six replicate analyses, was tested by spiking samples at a concentration level of 5.0 µg L-1 in ultra-pure
water. The relative standard deviations (n = 6) varied between 2.4 and 9.3%. The limits of detection (LODs), based on signal-to-noise ratio (S/N) of 3 runs, ranged from 0.005 to 0.05 µg L-1. Good linearity was obtained in a
range of 0.5-50.0 µg L-1 for all analytes with the correlation
coefficients (r) > 0.9964. The results are summarized in Table 1.
Real sample analysis
To demonstrate the capability of the proposed method,
Figure 4. Effect of surfactant concentration. Extraction conditions: chlorobenzene used as extraction solvent, Triton X-100 used as the surfactant, the
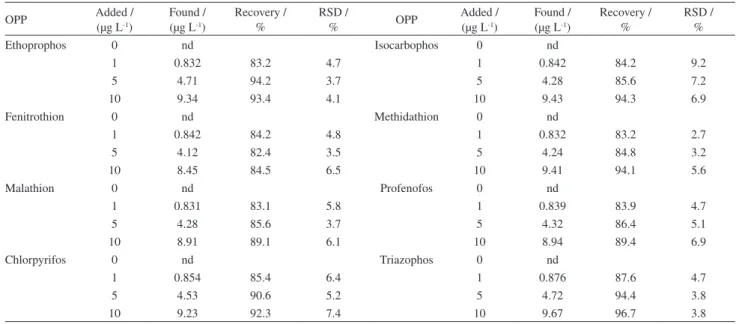
final experiments were carried out to analyze OPPs in tap water and honey samples. The results showed that the tap water and honey samples were free of OPPs. Then the samples were spiked with the analytes at 1.0, 5.0, and 10.0 µg L-1
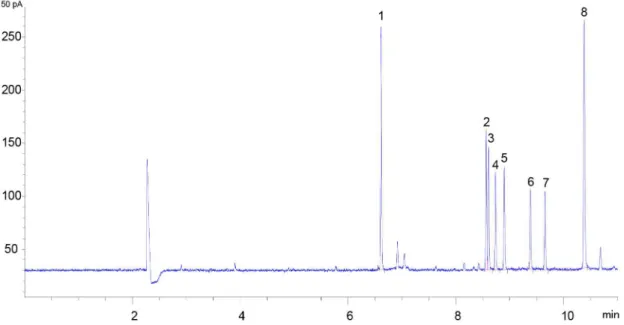
concentration levels to assess the matrix effect. The results are summarized in Tables 2 and 3 and the recoveries, which were expressed as the ratio of the concentration determined in fortified sample and concentration of fortification, ranged from 83.3 to 96.6% for tap water and from 82.4 to 96.7% for honey, with the RSDs (n = 3) varying from 2.8 to 9.1% and from 2.7 to 9.2%, respectively. From the results we can see that matrices of all the samples have no significant effect which indicated that the method was reliable and could be used for the trace analysis of the eight OPPs in tap water and honey samples. Figure 5 showed the GC-FPD chromatogram of OPPs obtained from M-UASEME sample preparation in fortified honey sample.
Comparison of the M-UASEME with other sample preparation technique
The comparisons between the M-UASEME method and other sample preparation techniques such as UASEME,23
DLLME24 and USAEME25 have been performed. The
relative data are shown in Table 4. These results indicated that M-UASEME was a sensitive and reliable method.
Conclusions
A novel and reliable M-UASEME method combined with GC-FPD has been developed. Compared with UASEME, manual shaking before ultrasound-assisted emulsification enhances the extraction efficiency. Moreover, compared to DLLME, the addition of ultrasonic process could enhance the extraction efficiency and the
Table 1. Analytical performance data for OPPs by the M-UASEME method
OPP RSD (n = 6) / % Linearity / (µg L-1) r LOD / (µg L-1) LOQ / (µg L-1)
Ethoprophos 4.5 0.5-50 0.9978 0.005 0.015
Fenitrothion 6.7 0.5-50 0.9965 0.03 0.09
Malathion 5.6 0.5-50 0.9981 0.03 0.09
Chlorpyrifos 7.1 0.5-50 0.9964 0.02 0.06
Isocarbophos 9.3 0.5-50 0.9996 0.05 0.15
Methidathion 4.3 0.5-50 0.9977 0.01 0.03
Profenofos 2.4 0.5-50 0.9973 0.02 0.06
Triazophos 3.5 0.5-50 0.9986 0.05 0.15
OPP: organophosphorus pesticide; RSD: relative standard deviation; r: correlation coefficient; LOD: limit of detection; LOQ: limit of quantification.
Figure 5. GC-FPD chromatogram of OPPs obtained from M-UASEME sample preparation in fortified honey sample. (1) Ethoprophos; (2) fenitrothion;
Table 2. Analytical results in tap water samples (n = 3)
OPP Added /
(µg L-1)
Found / (µg L-1)
Recovery / %
RSD /
% OPP
Added / (µg L-1)
Found / (µg L-1)
Recovery / %
RSD / %
Ethoprophos 0 nd Isocarbophos 0 nd
1 0.845 84.5 3.4 1 0.845 84.5 8.7
5 4.81 96.2 4.3 5 4.31 86.2 7.9
10 9.13 91.3 3.2 10 9.32 93.2 9.1
Fenitrothion 0 nd Methidathion 0 nd
1 0.856 85.6 5.4 1 0.833 83.3 3.5
5 4.31 86.2 5.3 5 4.44 88.8 4.4
10 8.65 86.5 6.5 10 9.32 93.2 2.8
Malathion 0 nd Profenofos 0 nd
1 0.86 86 6.1 1 0.834 83.4 3.1
5 4.65 93 4.6 5 4.35 87 4.5
10 9.02 90.2 7.2 10 9.02 90.2 3.8
Chlorpyrifos 0 nd Triazophos 0 nd
1 0.854 85.4 7.5 1 0.921 92.1 2.8
5 4.32 86.4 6.5 5 4.83 96.6 3.1
10 8.78 87.8 4.8 10 9.53 95.3 4.3
OPP: organophosphorus pesticide; RSD: relative standard deviation; nd: not detected.
Table 3. Analytical results in honey samples (n = 3)
OPP Added /
(µg L-1)
Found / (µg L-1)
Recovery / %
RSD /
% OPP
Added / (µg L-1)
Found / (µg L-1)
Recovery / %
RSD / %
Ethoprophos 0 nd Isocarbophos 0 nd
1 0.832 83.2 4.7 1 0.842 84.2 9.2
5 4.71 94.2 3.7 5 4.28 85.6 7.2
10 9.34 93.4 4.1 10 9.43 94.3 6.9
Fenitrothion 0 nd Methidathion 0 nd
1 0.842 84.2 4.8 1 0.832 83.2 2.7
5 4.12 82.4 3.5 5 4.24 84.8 3.2
10 8.45 84.5 6.5 10 9.41 94.1 5.6
Malathion 0 nd Profenofos 0 nd
1 0.831 83.1 5.8 1 0.839 83.9 4.7
5 4.28 85.6 3.7 5 4.32 86.4 5.1
10 8.91 89.1 6.1 10 8.94 89.4 6.9
Chlorpyrifos 0 nd Triazophos 0 nd
1 0.854 85.4 6.4 1 0.876 87.6 4.7
5 4.53 90.6 5.2 5 4.72 94.4 3.8
10 9.23 92.3 7.4 10 9.67 96.7 3.8
OPP: organophosphorus pesticide; RSD: relative standard deviation; nd: not detected.
Table 4. Comparison of M-UASEME with other methods
Method LOD / (µg L-1) RSD / % Extraction time / min Volume of organic
solvent / µL Reference
UASEME-HPLC-DAD 0.1-0.3 3.3-5.6 3 150 12
DLLME-GC-FPD 0.003-0.02 4.6-6.5 − 1000 + 12a 13
USAEME-GC-FPD 0.0053-0.01 1.6-13 5 50.0 14
M-UASEME-GC-FPD 0.005-0.05 2.4-9.3 0.1667 15.0 this work
a1000 and 12 µL are the amount of dispersant and extractant, respectively. UASEME-HPLC-DAD: ultrasound-assisted surfactant-enhanced emulsification
method repeatability, the use of a surfactant also can be avoided by adding the disperser solvent. In addition, the test tube was wrapped up by absorbent cotton and was stuffed into a 50 mL plastic centrifuge tube, which could avoid the influence of temperature during the centrifugation process. To demonstrate the applicability of the performed method, it has been successfully applied in the analysis of tap water and honey samples and satisfied results can be achieved. Considering all of its advantages, M-UASEME is a promising pretreatment method for the fast analysis of trace components in complicated matrices.
Acknowledgments
The authors greatly appreciate the financial supports by the National Natural Science Foundation of China (No. 21507032) and the Fundamental Research Funds for the Central Universities (No. 2662015QD007).
References
1. Ramos, L.; J. Chromatogr. A2012, 1221, 84.
2. Spietelun, A.; Marcinkowski, Ł.; de la Guardia, M.; Namieśnik, J.; Talanta2014, 119, 34.
3. He, Y.; Chem. Pap.2014, 68, 995.
4. Liu, S.; Dasgupta, P. K.; Anal. Chem.1995, 67, 2042. 5. Liu, S.; Dasgupta, P. K.; Anal. Chem.1996, 68, 1817. 6. Jeannot, M. A.; Cantwell, F. F.; Anal. Chem.1996, 68, 2236. 7. Tao, Y.; Liu, J. F.; Wang, T.; Jiang, G. B.; J. Chromatogr. A
2009, 1216, 756.
8. Jeannot, M. A.; Przyjazny, A.; Kokosa, J. M.; J. Chromatogr. A
2010, 1217, 2326.
9. Rezaee, M.; Assadi, Y.; Milani Hosseini, M. R.; Aghaee, E.; Ahmadi, F.; Berijani, S.; J. Chromatogr. A2006, 1116, 1. 10. Tasi, W. C.; Huang, S. D.; J. Chromatogr. A2009, 1216, 5171. 11. Kokosa, J. M.; Trends Anal. Chem.2013, 43, 2.
12. Chamsaz, M.; Hossein-Poor-Zaryab, M.; Arab-Zavar, M. H.; Darroudi, A.; Iran. J. Chem. Chem. Eng.2014, 33, 59. 13. Yan, H.; Liu, B.; Du, J.; Yang, G.; Row, K. H.; J. Chromatogr. A
2010, 1217, 5152.
14. Regueiro, J.; Llompart, M.; Jares, C.; Garcia-Monteagudo, J. C.; Cela, R.; J. Chromatogr. A2008, 1190, 27. 15. Moradi, M.; Yamini, Y.; Esrafili, A.; Seidi, S.; Talanta2010,
82, 1864.
16. Psillakis, E.; Mantzavinos, D.; Kalogerakis, N.; Chemosphere
2004, 54, 849.
17. Sanchez-Prado, L.; Barro, R.; Garcia-Jares, C.; Llompart, M.; Lores, M.; Petrakis, C.; Kalogerakis, N.; Mantzavinos, D.; Psillakis, E.; Ultrason. Sonochem.2008, 15, 689.
18. Wu, Q.; Chang, Q.; Wu, C.; Rao, H.; Zeng, X.; Wang, C.; Wang, Z.; J. Chromatogr. A2010, 1217, 1773.
19. Filik, H.; Giray, D.; Food Chem.2012, 130, 209. 20. Sun, M.; Wu, Q.; J. Hazard. Mater.2011, 192, 935. 21. Amin, A. S.; Spectrosc. Lett.2011, 44, 424.
22. Paleologos, E. K.; Giokas, D. L.; Karayannis, M. I.; Trends Anal. Chem.2005, 24, 426.
23. Wu, C.; Liu, N.; Wu, Q.; Wang, C.; Wang, Z.; Anal.Chim. Acta
2010, 679, 56.
24. Berijani, S.; Assadi, Y.; Anbia, M.; Milani Hosseini, M. R.; Aghaee, E.; J. Chromatogr. A2006, 1123, 1.
25. Jia, C.; Zhu, X.; Chen, L.; He, M.; Yu, P.; Zhao, E.; J. Sep. Sci.
2010, 33, 244.
Submitted: April 18, 2017
