Article
J. Braz. Chem. Soc., Vol. 26, No. 5, 880-886, 2015. Printed in Brazil - ©2015 Sociedade Brasileira de Química 0103 - 5053 $6.00+0.00
A
*e-mail: [email protected]
Extraction and Separation of Molybdenum by Using Homogeneous Liquid-Liquid
Microextraction via Flotation Assistance
Mohammad Rezaee,*,a Maryam Mozaffari,b Hedayat Haddadi,b
Mohammad R. Pourjavida and Abolfazl Semnanib
aNuclear Fuel Cycle Research School, Nuclear Science & Technology Research Institute, Atomic Energy Organization of Iran, P.O. Box 14395-836, Tehran, Iran
bDepartment of Chemistry, Faculty of Sciences, Shahrekord University, P.O. Box 115, Shahrekord, Iran
Homogeneous liquid-liquid microextraction via flotation assistance (HLLME-FA) was investigated for the extraction of molybdenum from the water samples. Alizarin Red S and cetyl trimethylammonium bromide (CTAB) were used as a complexing ligand and ion-pairing reagent, respectively. The enriched analyte in the floated organic phase was determined by electrothermal atomic absorption spectrometry (ETAAS). In this work, low density organic solvent was used and no centrifugation was required in this procedure. A special extraction cell was designed to facilitate the collection of the low-density extraction solvent. By using air flotation, the organic solvent was collected at the conical part of the designed cell. Under the optimum conditions, the method performance was studied in terms of linear dynamic range (0.5-200 µg L−1), linearity (r2 > 0.991),
precision (repeatability < 10.0 %). Also, the limit of detection (LOD) of 0.1 µg L−1 was obtained
for molybdenum. The proposed method has been successfully applied for the determination of the molybdenum in water samples.
Keywords: homogeneous liquid-liquid microextraction,flotation assistance, molybdenum,
electrothermal atomic absorption spectrometry, water samples
Introduction
Molybdenum (Mo) is an essential trace element for both animals and plants. In terrestrial animals, Mo is present in various organs and tissues, especially in the liver, kidney, adrenal, glands, bone and brain. In plants, this element is necessary for the fixation of atmospheric nitrogen by bacteria to begin the protein synthesis. Deficiency or excess of molybdenum can cause damage to plants, and hence its routine control is highly recommended for healthy plant growth. Molybdenum is added in trace amounts to the fertilizers to stimulate the plant growth. Molybdenum is also used as a component in glass, fertilizer, catalyst, lubricant and alloy of steel.1-4 As a result, industrial effluents contain
excess of molybdenum that causes detrimental effects in animals and human beings. Molybdenum poisoning cause severe gastrointestinal irritation with diarrhea, coma ruminants and death from cardiac failure. Complexes containing molybdenum, such as tetrathiomolybdate
are administered in the treatment of Wilson’s disease.5
Thus, monitoring of molybdenum in environmental sample is necessary in order to know the exposure level of this element. For the determination of trace amount of molybdenum, a separation and a preconcentration step are usually required before its analysis. This is due to its low concentration and matrix effect in environmental samples. The most widely used techniques for the separation and preconcentration of trace molybdenum include liquid-liquid extraction (LLE),6-11 solid-phase extraction (SPE)12-14 and
co-precipitation methods.15,16
Recently, Rezaee et al.17 have introduced a more
at the bottom of conical test tube.17-21 Homogeneous
liquid-liquid extraction (HLLE) is an extraction method that extracts the desired solute existing in the homogeneous aqueous solution into the water-immiscible organic phase by phase separation phenomenon. In HLLE procedures, the initial condition (before phase separation) is homogeneous solution, namely, there is no interface between water phase and water-immiscible organic phase.22-24
Extraction solvents often used in DLLME and HLLE are chlorobenzene, carbon tetrachloride and chloroform with higher density than water and all of which are potentially toxic to human and the environment. So, the micro droplets of extraction solvents were settled from the aqueous bulk usually by centrifuging the emulsion. The instrumental analysis of the sediment was then carried out after centrifugation. However, many of common liquid-liquid extraction solvents including alkanes, alcohols, ethers, ketones and acetates possess lower density than water. Therefore, the application of these solvents in dispersion-based microextraction methods like DLLME will be problematic. In recent years, to overcome this limitation, in several studies, application of low density solvents in solvent microextraction methods has been reported.25-30
Recently, Hosseini et al.31,32 have introduced a novel
modality of liquid-liquid microextraction, referred as homogeneous liquid-liquid microextraction via flotation assistance (HLLME-FA) method. HLLME-FA is similar to the DLLME and HLLE methods. A mixture of extraction and homogeneous solvents is injected into an aqueous sample. In the initial state of injection, a homogeneous solution was formed and then, with the continuation of injection, an emulsion consisting of the fine droplets of the extraction solvent were formed. Homogeneous solvent causes increase in the solubility of extraction solvent in water. The separation of the two phases happened by adding salt. In this method, a special extraction cell was designed to facilitate collection of the low-density extraction solvent. No centrifugation was required in this procedure. By using air flotation, the organic solvent was collected at the upper conical part of the designed cell. The purpose of this paper is to demonstrate the usefulness of HLLME-FA combined with electrothermal atomic absorption spectrometry (ETAAS) for the determination of molybdenum in the water samples. For the first time, HLLME-FA in combination with ETAAS for the preconcentration and determination of molybdenum inwater samples was used. The effect of various experimental parameters such as type and volume of extraction solvent, type and volume of homogeneous solvent, sample pH, ligand concentration, cetyl trimethylammonium bromide (CTAB) concentration and ionic strength was studied.
Experimental
Chemicals and reagents
A stock standard solution of Mo at the concentration
level of 1000 mg L−1 was prepared from pure ammonium
molybdate (VI) (E. Merck, Darmstadt, Germany). Working standard solutions were prepared in doubly distilled water. All the standard solutions were stored in a fridge at −4 °C and brought to ambient temperature just prior to use. 1-Undecanol, n-heptane, toluene, methanol, ethanol, acetone and acetonitrile were obtained from Merck. A solution of Alizarin Red S (0.01 mol L−1) was prepared by dissolving the
appropriate amounts of this reagent in distilled water. CTAB (0.1 mol L−1) was prepared by dissolving the appropriate
amounts of this reagent in distilled water. Youngling ultra pure water purification system (Aqua MaxTM-ultra, Korea)
was used for the purification of water. The pH of solutions was adjusted by dissolving proper amount of ammonium acetate in distilled water (2.5 × 10⁻³ mol L−1) and dropwise
addition of nitric acid (0.5 mol L−1) and/or sodium hydroxide
solutions (0.5 mol L−1). Certified reference materials, rain
water TMRAIN-95 and sea water NAAS-5 were obtained from National Research Council, Canada.
Instrumentation
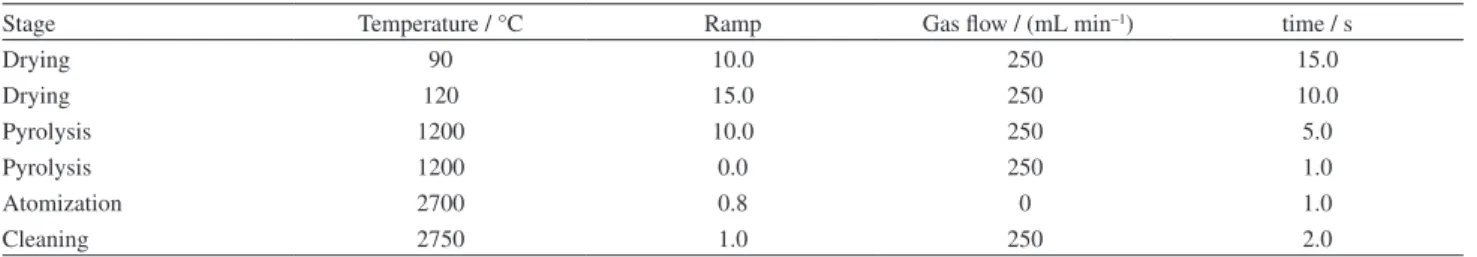
In this work, an atomic absorption spectrometer model PG-990, equipped with a graphite furnace atomizer and deuterium background correction was used. A molybdenum hallow cathode lamp with a wavelength of 313.3 nm, a current of 7.0 mA, and a slit of 0.2 nm was used as radiation source. The temperature program for the graphite furnace atomic absorption is given in Table 1.
HLLME-FA procedure
Figure 1 shows the schematic procedure of the proposed method. A mixture of 1.0 mL methanol (homogeneous solvent) and 200 µL toluene (extraction solvent) were added to the home-designed extraction cell (Figure 1a). A volume of 136 µL Alizarin Red S (0.01 mol L−1), as a ligand, and
70 µL CTAB (0.1 mol L−1), as an ion-pairing reagent, were
added into the 22 mL saline aqueous solution containing
molybdenum at the concentration level of 200 µg L−1,
organic solvent was collected on the top of the solution by air flotation (Figure 1d). After separation of the two phases, a few volumes of distilled water were added into the glass tube through the side of the cell (Figure 1e). The floated organic solvent was raised into the conical part of the cell. The collected organic solvent was injected into the ETAAS instrument using a microsyringe.
Results and Discussion
HLLME-FA combined with ETAAS was developed for the determination of molybdenum in water samples. In order to obtain a high recovery and high enrichment factor, effects of different parameters such as the type and volume of the extraction and homogeneous solvents, sample pH, ligand concentration, ion-pairing reagent concentration, salt amount and extraction time were studied and optimized using one variable at a time method.
Selection of extraction solvent
In order to obtain efficient extraction, the selection of an extraction solvent is of great importance in solvent microextraction methods. In the selection of extraction solvent, factors should be considered once it is limited by several characteristics, must have low water solubility and lower density than water. The extraction solvent should also be able to extract the analyte of interest and should be compatible with the analytical instrument. In the current study, to investigate the applicability of the proposed method for determination of the target analyte, some
solvents including toluene, 1-undecanol and n-heptane
were selected and optimized.For comparison study, it is necessary to add an excess amount of extraction solvent to recover an equal volume in the upper layer for different extraction solvents. As shown in Figure 2, toluene presented the highest extraction efficiency. The presence of benzene group in the ligand and its interaction with benzene group in toluene causes better extraction efficiency. Thus, toluene was selected for the subsequent experiments.
Selection of homogeneous solvent
Acetone, acetonitrile, ethanol and methanol, which are miscible with both water and toluene, were selected as the
Table 1. Temperature program of graphite furnace for metal ion determination
Stage Temperature / °C Ramp Gas flow / (mL min−1) time / s
Drying 90 10.0 250 15.0
Drying 120 15.0 250 10.0
Pyrolysis 1200 10.0 250 5.0
Pyrolysis 1200 0.0 250 1.0
Atomization 2700 0.8 0 1.0
Cleaning 2750 1.0 250 2.0
Figure 1. Schematic HLLME-FA procedure. (a) A mixture of 1.0 mL methanol containing 200.0 µL toluene was added to the home-designed extraction cell; (b) 22.0 mL of the saline aqueous solution was added into the extraction cell; (c) a homogeneous solution was formed in the cell; (d) using air flotation, organic solvent was moved to the top of the solution; (e) a small volume of distilled water was added into the glass tube on the side of the cell.
0 0.1 0.2 0.3 0.4 0.5 0.6 0.7 0.8
Toluene 1-Undecanol n-Heptane
Type of extraction solvent
Absorbance
Figure 2. Effect of type of extraction solvent on the determination of molybdenum using the proposed procedure. Extraction conditions: homogeneous solvent (acetone) volume, 1.0 mL; extraction solvent, toluene, 1-undecanol and n-heptane; concentration of NaCl, 1.5 mol L−1;
extraction time, 5 min; volume of Alizarin Red S (0.01 mol L−1), 70 µL;
homogeneous solvents. A series of the sample solutions was studied by using 1.0 mL of each homogeneous solvent containing 200.0 µL toluene (as the extraction solvent). The results showed that methanol has the highest extraction efficiency compared to the other tested solvents. Therefore, methanol was selected as the homogeneous solvent in the further experiments.
Selection of extraction and homogeneous solvent volumes
To examine the effect of extraction solvent volume, solutions containing different volumes of toluene were subjected to the same HLLME-FA procedures. The experimental conditions were fixed and included the use of 1.0 mL methanol containing different volumes of toluene (200.0, 250.0, 300.0 and 350.0 µL). By increasing the volume of toluene, the absorption of the analyte decreased, owing to the increase in the volume of the collected organic solvent. Based on the experimental results, 200.0 µL toluene was adopted for the further experiments.
In order to study the influence of the volume of homogeneous solvent on the extraction efficiency, different volumes of methanol (0.5, 1.0, 1.5 and 2.0 mL) were used. The results showed that increasing the volume of methanol led to a raise in absorption up to 1.0 mL and then a decrease of analytical signal was observed. It seems that at a low volume of methanol, cloudy state is not formed well, thereby, the absorption decreases. The solubility of the complex in water containing high amount of the homogeneous solvent is increased, therefore, the absorption decreases. Therefore, 1.0 mL was selected as the optimum volume of methanol.
Effect of pH
In procedure involving HLLME-FA, the pH of the aqueous solution is a very important factor for the extraction of metal ion, as it controls the interactions between the analyte and the chelating reagent. Thus, the hydrogen ion concentration of the medium was studied for the extraction of molybdenum using buffer solutions with pH values ranging from 2-10. The results are shown in Figure 3. It was observed that the best results are obtained when the pH value is 3.5. Therefore, a buffer solution of pH 3.5 was used in all additional experiments.
Concentration of the chelating reagent
The chelating reagent used in this HLLME-FA procedure was Alizarin Red S, which was studied in the volume of 30.0 to 800.0 µL at the concentration level of 0.01 mol L−1. The effect of Alizarin Red S on the absorbance
of molybdenum is shown in Figure 4. It can be observed that the absorption of the analytical signal reached a maximum at the volume of 136 µL. It seems that slight reduction of extraction in the high concentration of Alizarin Red S is due to the extraction of Alizarin Red S itself, which can easily saturate the small volume of the extraction solvent. Also, at the high concentration of Alizarin Red S, the background absorbance was increased. Thus, for the further studies, volume of 136 µL of Alizarin Red S at the concentration of 0.01 mol L−1 was used.
Effect of the concentration of the ion-pairing reagent
The complex formed between molybdenum and Alizarin Red S is ionic. CTAB was used as ion-pairing reagent, which produced ion-paired complex with molybdenum in the presence of Alizarin Red S. The effect of concentration of CTAB was studied using different volumes (0.0, 70.0 and 150.0 µL) of a 0.1 mol L−1 solution. As can be seen
in Figure 5, the best analytical signal was obtained with 0
0.1 0.2 0.3 0.4 0.5 0.6 0.7 0.8 0.9 1
1 2 3 4 5 6 7 8 9 10 11
pH
Absorbance
Figure 3. Effect of pH on the determination of molybdenum using the proposed procedure. Extraction conditions: homogeneous solvent (methanol) volume, 1.0 mL; extraction solvent (toluene) volume, 200.0 µL; concentration of NaCl, 1.5 mol L−1; extraction time, 5 min;
volume of Alizarin Red S (0.01 mol L−1), 70 µL; volume of CTAB
(0.1 mol L−1), 70.0 µL; pH, 2, 3.5, 5, 8, 10.
0 0.2 0.4 0.6 0.8 1 1.2
0 200 400 600 800 1000
Volume of ligand / µL
Absorbance
Figure 4. Effect of concentration of the chelating reagent on the determination of molybdenum using the proposed procedure. Extraction conditions: homogeneous solvent (methanol) volume, 1.0 mL; extraction solvent (toluene) volume, 200.0 µL; concentration of NaCl, 1.5 mol L−1;
extraction time, 5 min; volume of Alizarin Red S (0.01 mol L-1), 30, 70,
70.0 µL.Thus, 70.0 µL CTAB solution (0.1 mol L−1) was
selected as an optimum volume.
Effect of salt addition
Effect of salt addition on the extraction efficiency was studied by changing NaCl concentration from 0.5 to 5 mol L−1. By increasing the NaCl concentration up to
3.0 mol L−1, the extraction efficiency of the analyte increases,
because of salting-out effect (Figure 6). Using higher salt concentration resulted in decreasing extraction efficiency, due to raising solution viscosity that reduces dispersion phenomenon. Therefore, 3.0 mol L−1 was selected as the
optimal salt concentration for subsequent analysis.
Effect of extraction time
In this experiment, extraction time is the interval time between the beginning and the end of the dispersion, just before air flotation. Effect of extraction time was examined in
the time range of 1-20 min. The results show that extraction time has no significant effect on the extraction efficiency of the analyte, because the surface area between the extraction solvent and the aqueous phase is very large. Thereby, transition of the complex from the aqueous phase to the extraction solvent is fast and equilibrium state is achieved quickly. Hence, the extraction time of 1 min was adopted to achieve maximal extraction efficiency of the analyte.
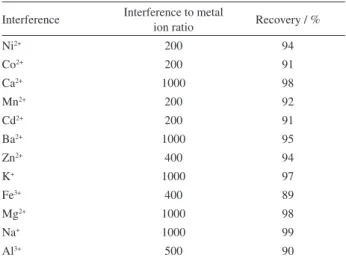
Interferences
The potential interferences of some ions on the preconcentration and determination of metal ion were examined. In these experiments, solutions of 100 µg L−1
of the analyte containing the interfering ions were treated according to the optimized procedures. Table 2 shows tolerance limits of the interfering ions. In addition, a number of common anions like Cl−, SO
4 2−, NO
3−, I− and F−
were tested. The results showed that they did not interfere at the concentration up to 100 mg L−1.
Quantitative analysis
The characteristics of analytical curve were obtained under the optimized conditions (Table 3). Linearity was observed in the range of 0.5 to 200 µg L−1 for molybdenum
with coefficient of determination (r2) of 0.9923. The relative
standard deviation (RSD, n = 6) was 9.7%. The limit of detection (LOD), (S/N = 3) was 0.1 µg L–1. The limit of
quantification (LOQ) was calculated as 10 Sb/m, where Sb
is the standard deviation of ten measurements of blank and m is the slope of the calibration graph and the LOQ was 0.6 µg L−1. The enhancement factor, calculated from the
slope ratio of calibration curves obtained after and before 0
0.1 0.2 0.3 0.4 0.5 0.6 0.7 0.8 0.9 1
0 20 40 60 80 100 120 140 160
Volume of CTAB / µL
Absorbance
Figure 5. Effect of concentration of the ion-pairing reagent on the determination of molybdenum using the proposed procedure. Extraction conditions: homogeneous solvent (methanol) volume, 1.0 mL; extraction solvent (toluene) volume, 200.0 µL; concentration of NaCl, 1.5 mol L−1;
extraction time, 5 min; volume of Alizarin Red S (0.01 mol L−1), 136 µL;
volume of CTAB (0.1 mol L−1), 0, 70, 150 µL; pH, 3.5.
0 0.2 0.4 0.6 0.8 1 1.2
0 1 2 3 4 5 6
Concentration of NaCl / (mol L )–1
Absorbance
Figure 6. Effect of NaCl concentration on the determination of molybdenum using the proposed procedure. Extraction conditions: homogeneous solvent (methanol) volume, 1.0 mL; extraction solvent (toluene) volume, 200.0 µL; NaCl concentration, 0.5, 1.5, 3.0, 5.0 mol L−1;
extraction time, 5 min; volume of Alizarin Red S (0.01 mol L−1), 136 µL;
volume of CTAB (0.1 mol L−1), 70.0 µL; pH, 3.5.
Table 2. Effect of interference on preconcentration and determination of metal ion
Interference Interference to metal
ion ratio Recovery / %
Ni2+ 200 94
Co2+ 200 91
Ca2+ 1000 98
Mn2+ 200 92
Cd2+ 200 91
Ba2+ 1000 95
Zn2+ 400 94
K+ 1000 97
Fe3+ 400 89
Mg2+ 1000 98
Na+ 1000 99
HLLME-FA, was found to be 660 for this preconcentration method. The sensitivity was evaluated by calculating the characteristic mass (9.0 pg).
Table 4 compares the proposed method with the other extraction methods for the determination of molybdenum. Comparison of the proposed method with cloud point extraction (CPE),33 for the extraction and determination
of the analyte indicates that this novel method has a short extraction time for the determination of the analyte. Quantitative results of the proposed method such as detection limit and linear range are better than those of solid-phase extraction,34 ionic liquid-based dispersive
liquid-liquid microextraction35 and HLLE36 methods.
Comparing the proposed method with cathodic stripping voltammetric method37 shows that the presented work is
simple and cheap. Also, the proposed method does not need centrifugation to separate the organic phase and it is possible to use low-density extraction solvents. Finally, it can be concluded that the proposed method is an efficient, rapid, simple and cheap microextraction method that can be a complement for DLLME and HLLE methods that have been used with organic solvents more dense than water for the determination of molybdenum in water samples.
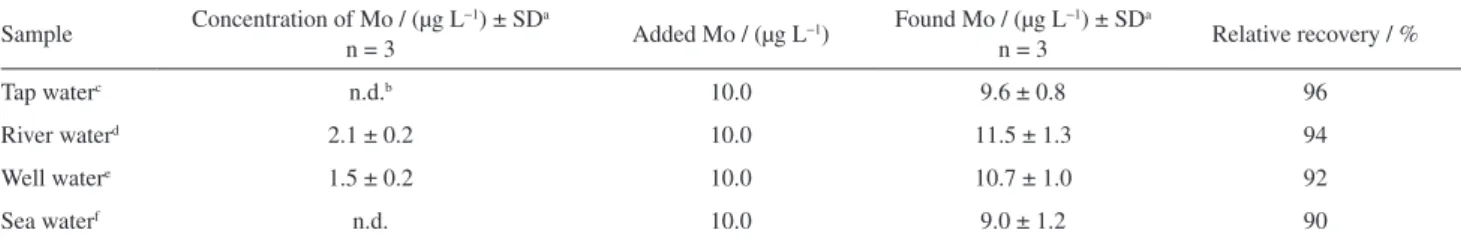
Real water analysis
The practical suitability of the HLLME-FA method was investigated by the determination of molybdenum in four types of water samples. To determine the relative recoveries of the method, the water samples were spiked with molybdenum. The results (Table 5) demonstrate that the different water matrices had little effect on the HLLME-FA method, indicating the good performance of the proposed method for the determination of molybdenum in water samples. The proposed method was also applied to the determination of molybdenum in certified reference materials: NASS-5 (seawater) and TMRAIN-95 (rain water). The obtained results (Table 6) for certified reference materials are in agreement with those certified. Based on these results, it can be stated that the proposed method has good accuracy for the determination of molybdenum in water samples.
Conclusions
This paper outlined the successful development and application of the HLLME-FA method combined with
Table 3. Quantitative results of HLLME-FA method for molybdenum
Analyte Linear range / (µg L−1) LODa / (µg L−1) LOQb / (µg L−1) RSD / %c r2d
Mo 0.5-200 0.1 0.6 9.7 0.9923
aLOD, limit of detection for S/N = 3; bLOQ, limit of quantification; cRSD, relative standard deviation (n = 6); dcoefficient of determination.
Table 4. Comparison of the proposed method with the other extraction methods for the determination of molybdenum in water samples
Method RSD / % Dynamic linear
range / (µg L−1)
Limit of detection / (µg L−1)
Extraction time / min
Enhancement
factor Ref.
CPE-spectrophotometry 1.1 0.3-320 0.1 10 20 33
Cathodic stripping voltammetric 3.9 0.02-0.5 0.09 − − 34
SPE-reflection spectroscopy < 6 50-2500 2 − − 35
HLLE-spectrophotometry 2.4 200-2000 − − 125 36
Ionic liquid-based DLLME 2.7 5-100 1.43 < 7 72 37
HLLME-FA-ETAAS 9.7 0.5-200 0.1 1 660 This work
Table 5. Determination of molybdenum in tap, well, sea and river water and relative recovery of spiked molybdenum
Sample Concentration of Mo / (µg L
−1) ± SDa
n = 3 Added Mo / (µg L−1)
Found Mo / (µg L−1) ± SDa
n = 3 Relative recovery / %
Tap waterc n.d.b 10.0 9.6 ± 0.8 96
River waterd 2.1 ± 0.2 10.0 11.5 ± 1.3 94
Well watere 1.5 ± 0.2 10.0 10.7 ± 1.0 92
Sea waterf n.d. 10.0 9.0 ± 1.2 90
aStandard deviation; bnot detected; ctaken from our laboratory (Tehran. Iran); dtaken from Anzali River (Gilan, Iran); etaken from Mazandaran area (Sari,
ETAAS for the quantitative analysis of molybdenum in water samples. The developed method was sensitive, reproducible and linear over a wide concentration range. The developed method was convenient for the usage of low-density extraction solvents. Air flotation was used to break up organic solvent in water emulsion and to finish the extraction process. The performance of this procedure in molybdenum extraction from different water samples with various matrices was satisfactory and no matrix effect was observed. The main characteristics of the proposed method are simplicity, low cost, short analysis time and low consumption of toxic organic solvents.
Acknowledgements
Financial support by Nuclear Fuel Cycle Research School, Nuclear Science & TechnologyResearch Institute (Tehran, Iran) for the support during the period of this research is gratefully acknowledged.
References
1. Brewer, G. J.; Askari, F. K.; J. Hepatol. 2005, 42, S13-S21. 2. Almeida, A. M.; Aleixo, L. M.; Andrade, J. C.; Coscione, A. R.;
Quim. Nova 2006, 29, 153.
3. Ferreira, S. L. C.; Santos, H. C.; Costa, A. C. S.; Guardia, M.; Appl. Spectrosc. Rev. 2004, 39, 457.
4. Garg, R.; Saini, M. K.; Fahmi, N.; Singh, R. V.; Transition Met. Chem. 2006, 31, 363.
5. Goldberg, S.; Lesch, S. M.; Suarez, D. L.; Soil Sci. Soc. Am. J. 2002, 66, 1836.
6. de Andrade, J. C.; Cuelbas, C. J.; Eiras, S. P.; Talanta 1998, 47, 719.
7. Goguel, R.; Fresenius’ J. Anal. Chem. 1992, 344, 326. 8. Shijo, Y.; Suzuki, M.; Shimizu, T.; Aratake, S.; Uehara, N.;
Anal. Sci. 1996, 12, 953.
9. Comitre, A. L.; Reis, B. F.; Anal. Chim. Acta 2003, 479, 185. 10. Sastre, A. M.; Alguacil, F. J.; Chem. Eng. J. 2001, 81, 109. 11. Sawant, S. S.; Anuse, M. A.; Chavan, M. B.; J. Radioanal. Nucl.
Chem. 1997, 218, 147.
12. Pereira, M. G.; Arruda, M. A. Z.; Microchim. Acta 2003, 141, 115.
13. Camel, V.; Spectrochim. Acta, Part B 2003, 58, 1177. 14. Li, Q.; Zhao, X.; Guan, X.; Liu, G.; Anal. Chim. Acta 2006,
562, 44.
15. Liawruangrath, S.; Som-Aum, W.; Thownshend, A.; Talanta 2002, 58, 1177.
16. Burguera, J. L.; Burguera, M.; Rondon, C.; Talanta 2002, 58, 1167.
17. Rezaee, M.; Assadi, Y.; Hosseini, M. R. M.; Aghaee, E.; Ahmadi, F.; Berijani, S.; J. Chromatogr. A 2006, 1116, 1. 18. Rezaee, M.; Yamini, Y.; Faraji, M.; J. Chromatogr. A 2010, 1217,
2342.
19. Mashayekhi, H. A.; Abroomand-Azar, P.; Saber-Tehrani, M.; Waqif, S. H.; Chromatographia 2010,71, 517.
20. Mashayekhi, H. A.; Abroomand-Azar, P.; Saber-Tehrani, M.; Waqif, S. H.; Int. J. Environ. Anal. Chem. 2011, 91, 516. 21. Mashayekhi, H. A.; Rezaee, M.; Garmaroudi, S. S.;
Montazeri, N.; Ahmadi, S. J.; Anal. Sci. 2011, 27, 865. 22. Oshite, S.; Furukawa, M.; Igarashi, S.; Analyst 2001, 126, 703. 23. Takagai, Y.; Igarashi, S.; Analyst 2001, 126, 551.
24. Igarashi, S.; Takahashi, A.; Ueki, Y.; Yamaguchi, H.; Analyst 2000, 125, 797.
25. Farajzadeh, M. A.; Seyedi, S. E.; Shalamzari, M. S.; Bamorowat, M.; J. Sep. Sci. 2009, 32, 3191.
26. Saleh, A.; Yamini, Y.; Faraji, M.; Rezaee, M.; Ghambarian, M.; J. Chromatogr. A 2009, 1216, 6673.
27. Leong, M.; Huang, S. D.; J. Chromatogr. A 2008, 1211, 8. 28. Chen, H.; Chen, R. W.; Li, S. Q.; J Chromatogr. A 2010, 1217,
1244.
29. Dadfarnia, S.; Shabani, A. M. H.; Abadi, M. N. A.; J. Iran. Chem. Soc. 2013, 10, 289.
30. Moghadam, M. R.; Dadfarnia, S.; Shabani, A. M. H.; J. Hazard. Mater. 2011, 186, 169.
31. Hosseini, M. H.; Rezaee, M.; Mashayekhi, H. A.; Akbarian, S.; Mizani, F.; Pourjavid, M. R.; J. Chromatogr. A 2012, 1265, 52. 32. Hosseini, M. H.; Rezaee, M.; Akbarian, S.; Mizani, F.;
Pourjavid, M. R.; Arabieh, M.; Anal. Chim. Acta 2013, 762, 54. 33. Madrakian, T.; Ghazizadeh, F.; J. Hazard. Mater. 2008, 153,
695.
34. Tyszczuk, K.; Korolczuk, M.; Anal. Chim. Acta 2008, 624, 232. 35 Gharehbaghi, M.; Shemirani, F.; Food Chem. Toxicol. 2011, 49,
423.
36. Ghiasvand, A. R.; Shadabi, S.; Mohagheghzadeh, E.; Hashemi, P.; Talanta 2005, 66, 912.
37. Kononova, O. N.; Kachin, S. V.; Chaikovskaya, A. E.; Kholmogorov, A. G.; Kalyakina, O. P.; Turk. J. Chem. 2004, 28, 193.
Submitted: November 5, 2014
Published online: February 27, 2015 Table 6. Results of Mo determination in certified reference materials
Certified reference material Mo concentration / (µg L
−1)