Ana Luísa Gonçalves Neves Gomes
Licenciatura em Engenharia BiomédicaHuman Activity Recognition with
Accelerometry: Novel Time and Frequency
Features
Dissertação para obtenção do Grau de Mestre em Biomedical Engineering
Orientador :
Dr. Hugo Gamboa, Faculty of Sciences and
Tech-nology, New University of Lisbon
Co-orientador :
Dr. Vítor Paixão, Champalimaud Neuroscience
Programme, Champalimaud Centre for the
Un-known
Júri:
Presidente: Prof. Dr. Mário Secca
iii
Human Activity Recognition with Accelerometry: Novel Time and Frequency Features
Copyright cAna Luísa Gonçalves Neves Gomes, Faculdade de Ciências e Tecnologia,
Universidade Nova de Lisboa
Acknowledgements
First of all, I acknowledge Professor Hugo Gamboa, who always supported me and saw potential in my abilities even at the beginning of this thesis. I appreciate the opportunity he gave me to work with him in an interesting area which allowed me to develop my programming skills and to create an out-of-the-box approach over the whole research. I’m also grateful for his constant sharing of knowledge through rigorous orientation and dedicated effort for the success of this research. I also thank to Ricardo Gomes and to the rest of the staff from Plux for their availability and support.
I acknowledge my co-supervisor, Dr. Vítor Paixão, from Champalimaud Foundation for his constant availability, enthusiasm and excellent guidance and advices. I am also grate-ful for the support and good mood of the researchers from the Rui Costa group lab and all the volunteers of the Foundation.
I acknowledge Inês Machado for her willingness and support at the beginning of my the-sis. Her work was very important to get a better and deeper understanding of what was previously performed and the most important topics to develop.
Moreover, I acknowledge Professor Ricardo Matias, from the Politécnico de Setúbal, who gave new insights on the developed work with great enthusiasm and interest and for his availability to apply the achieved knowledge in the clinical environment.
Finally, I acknowledge my boyfriend, Patrizio Di Censi, for his daily understanding, pa-tience and unconditional support. To my friends, Rita Alhandra, Ricardo Silva, M. Marta Santos, Inês Vale, Maria Inês Silva, David Branha and Catarina Cavaco, for these last years full of remarkable and fun moments. Thank you all for supporting me when I needed and to call me to reason when I deserved.
I am especially grateful to my parents and my sister Gabriela, for their support and for always believing in me as a person and professional. I thank them for their understand-ing, trust and for giving me everything without demanding anything in return.
Abstract
Human Activity Recognition systems require objective and reliable methods that can be used in the daily routine and must offer consistent results according with the per-formed activities. These systems are under development and offer objective and person-alized support for several applications such as the healthcare area.
This thesis aims to create a framework for human activities recognition based on ac-celerometry signals. Some new features and techniques inspired in the audio recognition methodology are introduced in this work, namely Log Scale Power Bandwidth and the Markov Models application.
The Forward Feature Selection was adopted as the feature selection algorithm in order to improve the clustering performances and limit the computational demands. This method selects the most suitable set of features for activities recognition in accelerometry from a 423thdimensional feature vector.
Several Machine Learning algorithms were applied to the used accelerometry databases – FCHA and PAMAP databases - and these showed promising results in activities recog-nition.
The developed algorithm set constitutes a mighty contribution for the development of reliable evaluation methods of movement disorders for diagnosis and treatment applica-tions.
Keywords: Human Activity Recognition, Forward Feature Selection, Log Scale Power
Resumo
Os sistemas de Reconhecimento de Actividade Humana requerem métodos fiáveis e objectivos que possam ser aplicados em diferentes actividades do dia-a-dia e devem oferecer resultados consistentes de acordo com as actividades realizadas. Estes sistemas encontram-se em desenvolvimento e permitem a obtenção de dados objectivos e perso-nalizados, direccionados para diferentes aplicações tais como as áreas do bem-estar e da saúde.
Esta tese teve como objectivo criar um sistema de reconhecimento de actividades huma-nas baseado em sinais de acelerometria. Novas features e métodos inspirados no reco-nhecimento áudio são introduzidos neste trabalho, nomeadamente a feature Log Scale Power Bandwidth e a aplicação de Modelos de Markov Escondidos.
O Forward Feature Selection foi adoptado como algoritmo de selecção de features de forma a melhorar a performance dos métodos de clustering e limitar as exigências com-putacionais. Este método selecciona o conjunto de features mais adequado para o reco-nhecimento de actividades por acelerometria a partir de um vector de features de 423 dimensões.
Vários métodos de Machine Learning foram aplicados às duas bases de dados adoptadas - base de dados FCHA e PAMAP – e estes apresentaram resultados promissores na iden-tificação das actividades realizadas.
O conjunto de algoritmos desenvolvidos nesta tese poderá contribuir para o desenvolvi-mento de métodos de avaliação fiáveis para o diagnóstico e tratadesenvolvi-mento de deficiências motoras.
Palavras-chave: Reconhecimento de Actividade Humana, Forward Feature Selection,
Contents
1 Introduction 1
1.1 Motivation . . . 1
1.2 State of the Art: Brief Historical Perspective . . . 2
1.3 Objectives and Thesis Structure . . . 5
1.4 Thesis Overview . . . 5
2 Theoretical Background 7 2.1 Accelerometry and Accelerometer . . . 7
2.1.1 The Accelerometer System Function . . . 7
2.1.2 The Accelerometer Signal . . . 8
2.1.3 The Accelerometer Functioning Criteria for Human Activity Analysis 8 2.1.4 Advantages of Accelerometer System . . . 9
2.1.5 Applications of the Accelerometer Technology . . . 10
2.2 Accelerometry Signal Processing . . . 10
2.2.1 Characteristics of the Signal . . . 10
2.2.2 Filtering and Segmentation Process . . . 11
2.3 Machine Learning . . . 11
2.3.1 Machine Learning Techniques . . . 12
2.3.2 Unsupervised Learning Methods . . . 13
2.3.3 Procedures for K-value Estimation . . . 15
2.3.4 Clustering Performance Evaluation . . . 17
3 Acquisition Systems and Procedures 19 3.1 Foundation Champalimaud Human Activity database . . . 19
3.2 PAMAP database . . . 22
3.3 Clinical database . . . 22
xiv CONTENTS
4.1.1 Basic Features and Wavelets Application . . . 26
4.1.2 CUIDADO Features and Log Scale Power Bandwidth Implementa-tion . . . 26
4.1.3 Filtering and Window-Length Influence . . . 28
4.1.4 Free Parameters . . . 30
4.1.5 Normalization and Forward Feature Selection . . . 30
4.2 Meta Clustering . . . 32
4.2.1 Signal Annotation . . . 32
4.2.2 Hidden Markov Model . . . 33
4.2.3 Hungarian Accuracy . . . 33
5 Evaluation of the Performance 35 5.1 Window length Influence . . . 35
5.2 Selection of Unsupervised Learning Methods . . . 37
5.3 Wavelet Level Decomposition Influence . . . 38
5.4 Filtering Influence. . . 40
5.5 Hidden Markov Model Application . . . 41
5.6 Feature Selection . . . 43
5.7 Clustering Evaluation for Activity Recognition . . . 46
5.7.1 Human Activity Recognition with a controlled approach . . . 46
5.7.2 Human Activity Recognition with a non-controlled approach . . . 47
5.7.3 Clinical State Recognition with Asymptomatic and Symptomatic cases . . . 50
6 Conclusion 53 6.1 Contributions and Take Home Message . . . 53
6.2 Future Work . . . 55
A Affinity Propagation Method 62 A.1 Parameters . . . 62
A.2 Algorithm . . . 63
B Evaluation of the Performance - Additional Results 64 B.1 Window Length Influence . . . 65
B.2 Selection of Clustering Methods . . . 66
B.3 Wavelet Level Decomposition Influence . . . 67
B.4 Filtering Influence. . . 68
B.5 Hidden Markov Models Application . . . 69
B.6 Features Selection . . . 70
B.7 Human Activity Recognition with controlled approach . . . 73
CONTENTS xv
C 8th International Joint Conference on Biomedical Engineering Systems and
List of Figures
1.1 ACC signal analysis with clustering approaches: after setting an investiga-tion aim, data is collected (accelerometry signals) followed by signal pro-cessing (separation of the gravitational component from the body acceler-ation and conversion). After feature extraction from the signal and cluster-ing, it is possible to obtain the PA recognition. This acquisition knowledge can contribute for the development of several pathologic condition treat-ments such as OCD, PD and CVA. . . 2
1.2 Accelerometry signal in X-axis, located in the pelvic region [50], which presents a clear distinction between the physical activities: walking, run-ning, walking, climbing up and climbing down stairs, vacuuming, brush-ing teeth and sit-ups. . . 3
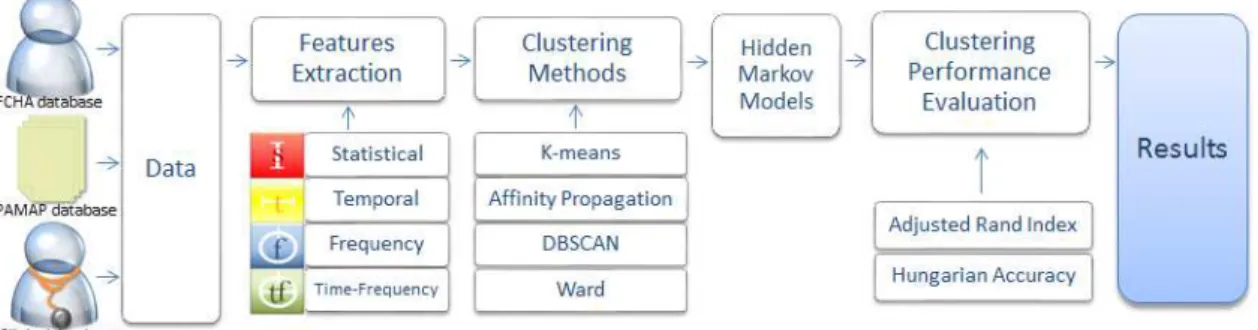
1.3 Overall structure of the framework developed in the present work for Hu-man Activity Recognition (HAR) systems. The first stage was related to the acquisition of ACC data from three databases: Foundation Champal-imaud Human Activity (FCHA) database, PAMAP database and clinical database (vide chapter 3). All databases were used in all stages of the framework: feature extraction, clustering and HMM application. Feature extraction was computed with features from all four domains (statistical, time, frequency and time-frequency) whose output was used as input of the unsupervised learning methods (K-means, Affinity Propagation, DB-SCAN and Ward). The Hidden Markov Model was applied to the clus-tering results and this process is evaluated according to two performance evaluation methods: Adjust Rand Index (ARI) and HA (vide chapter 5). . 6
xviii LIST OF FIGURES
2.2 Representation of a 1D accelerometer on the wrist and respective sensing axis (in blue) accordingly to the subject’s movement. The orange arrows represent the gravitational acceleration. In (b) the output of the sensing axis is aligned with the global horizontal and the gravitational component is null. In (a) and (c) the sensing axis is no longer perpendicular to the gravitational vector (unlike in b) and will show not just the body accelera-tion but a part of the gravitaaccelera-tional component (from 0 to 1g). . . 9
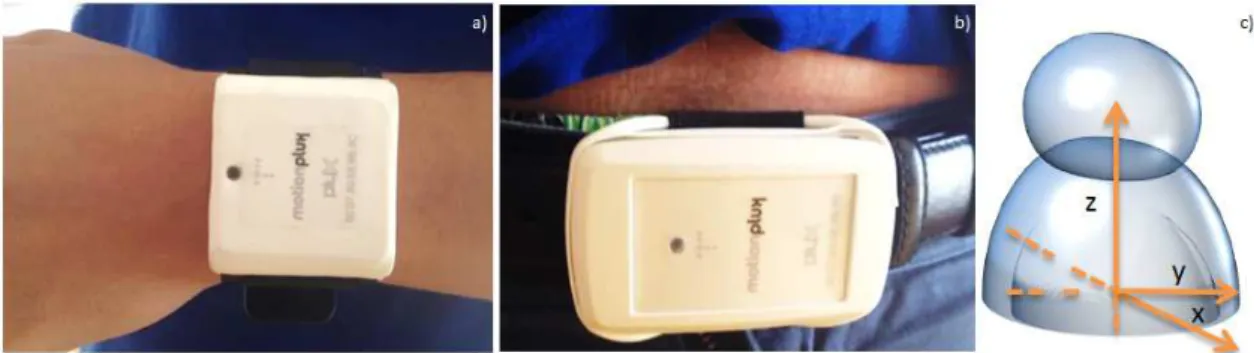
3.1 a) Wrist tri-axial accelerometer; b) waist tri-axial accelerometer and respec-tive acceleration components’ directions; c) Axis orientation of the waist sensor relative to the volunteer’s body. . . 20
3.2 Recorded Movements and respective labels and time duration for each protocol. The set of signals acquired from this protocol is called FCHA (carried out in the Champalimaud Foundation) database. . . 21
3.3 Representation of all three components (x,y and z) of the acquired ac-celerometry signals in the first stage of the protocol, the controlled envi-ronment, in the OpenSignals software [51]. The accelerometer signals refer to the subject01s’ activities execution. . . 21
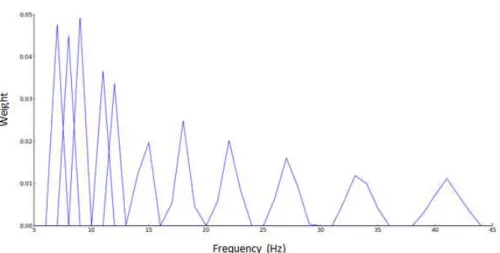
4.1 Representation of 11 triangular filters belonging to the filter bank used in the Log Scale Power Bandwidth algorithm. . . 28
4.2 Overall structure of the Forward Feature Selection algorithm. All features from all four domains (statistical, time, frequency and time-frequency) are used in this algorithm. The set A is formed by all features with a corre-lation value lower than 0.98. The set B is formed by 20 features with the highest ARI values. The set C is formed by N features resulting from the combination process between the feature with the highest ARI value and other features from set B. In each iteration, the best combination will be collected by C until N=10. . . 31
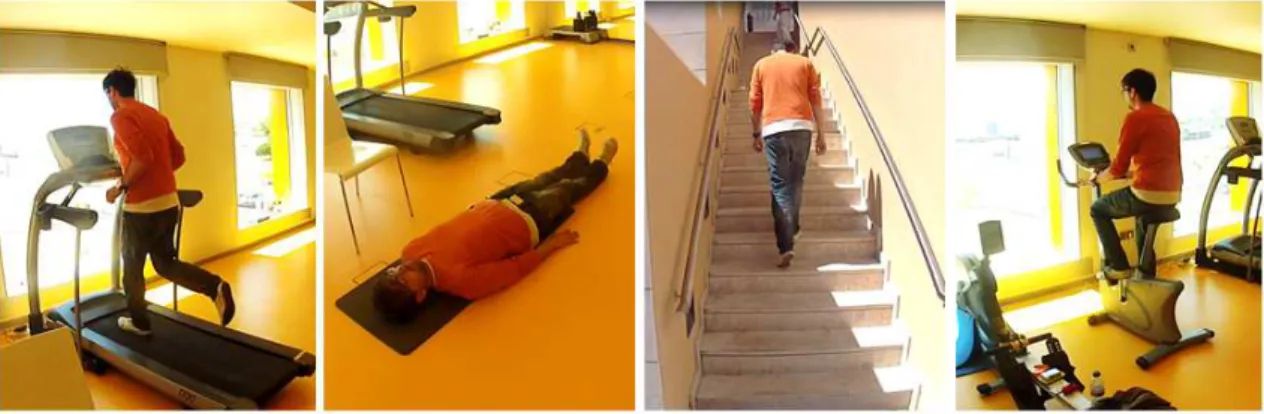
4.3 Frames of the subject08’s videotape, performing four tasks from the proto-col: running, lying down, climbing stairs and cycling. . . 32
4.4 Overall structure of the Hungarian accuracy algorithm. The first and sec-ond stages referred to the confusion matrix (A) and the cost matrix com-putation (B), respectively. Then, the lower cost method and normalization were applied to matrix B. The Hungarian Accuracy value was achieved through the average calculation of the resultant matrix diagonal. . . 34
LIST OF FIGURES xix
5.1 ARI accuracy with K-means application according to five segmentation lengths from 800 to 4000 samples. Each point corresponds to the results from the table shown in table 5.1. . . 36
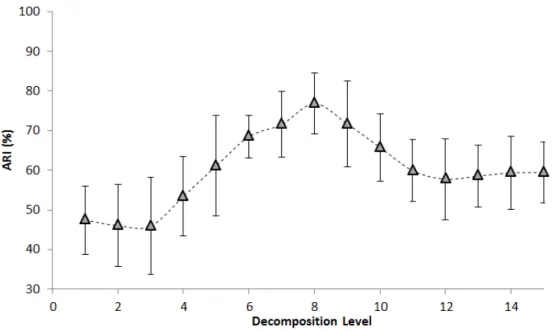
5.2 Colormap of the ground truth and the predicted labels from each wavelet decomposition level studied, from level 1 to 15. A colormap shows the same color for similar values which means that samples belonging to the same physical activity must show the same color. The most suitable range of decomposition levels for activities recognition is formed by the 7th, 8th and 9thlevels. . . . . 39
5.3 Representation of the clustering performances with ARI accuracy accord-ing to each wavelet level decomposition applied from 1 to 15. Each point corresponds to the average of the results lodged in the annex B.3. . . 39
5.4 Clustering accuracy with ARI algorithm with and without the filtering stage (%) and its improvement (%) in bars shown in table 5.3 . . . 41
5.5 Clustering performances through ARI with and without the HMM appli-cation (%) and its performance’s improvement (%) in bars shown in table 5.4. . . 42
5.6 ARI accuracy (%) as a function of the number of features used. Each sym-bol corresponds to a single clustering technique (K-means, Affinity Prop-agation, DBSCAN and Ward). Each point corresponds to the average and the respective standard deviation of the results from 9 subjects shown in appendix B.6. . . 43
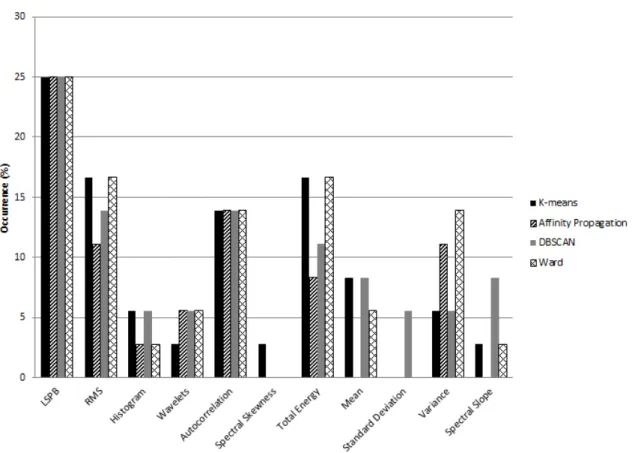
5.7 Representation of the Forward Feature Selection results. The algorithm outputted the set of the best 10 features for each clustering method. Each column corresponds to all occurrences of each feature type in all resulting sets for each clustering method. The LSPB initials refer to Log Scale Power Bandwidth and RMS to Root Mean Square. . . 45
xx LIST OF FIGURES
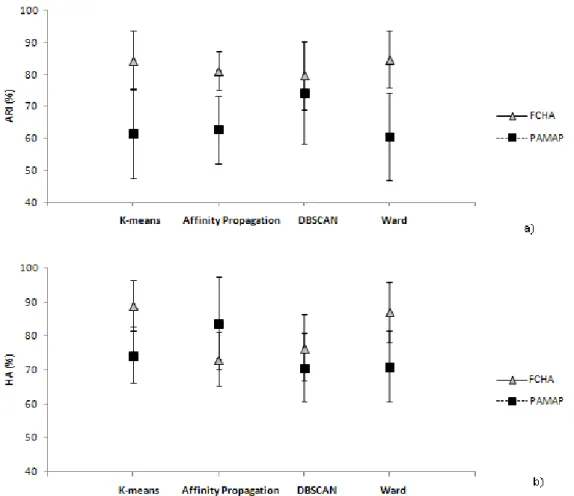
5.9 Clustering evaluation with a)the ARI and b)the Hungarian methodologies (in %) for K-means, Affinity Propagation, DBSCAN and Ward. Each point corresponds to the average and standard deviation of the results shown in the annex B.7. . . 48
5.10 Classification methodology (in %) with Nearest Neighbors, Random Forest and LDA methods. Each point corresponds to the average and standard deviation of the results shown in the annex B.7.. . . 48
List of Tables
3.1 Set of activities performed by 9 volunteers in order to collect its ACC data and to create the FCHA database. . . 20
3.2 Movements and respective labels and time duration from PAMAP database. 22
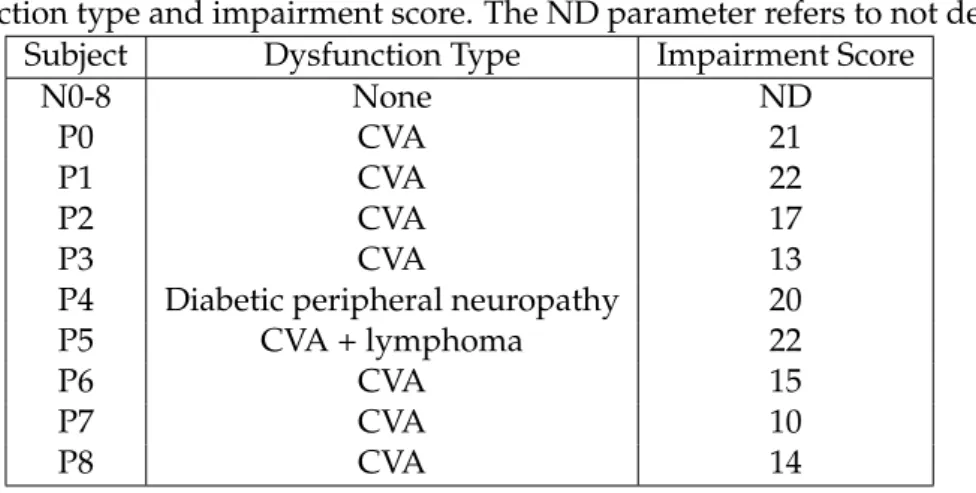
3.3 Nine asymptomatic (N0-8) and nine symptomatic (P0-8) volunteers and re-spective dysfunction type and impairment score. The ND parameter refers to not defined. . . 23
4.1 List of all features used in the present work and respective domains and number of output coefficients for each acceleration component: x, y, z, and total acceleration (p2
x2+y2+z2 );1 Refers to all traditional features al-ready applied in accelerometry [35]; 2 Refers to the CUIDADO features used in audio recognition; 3 Refers to new features created and imple-mented in this work. . . 29
5.1 K-means performance with ARI algorithm according to each chosen win-dow length. Each result corresponds to the average and standard devia-tion of the results of 9 individuals, shown in the table in the annex B.1. . . 36
5.2 ARI accuracy (%) and time response (in seconds) as a function of differ-ent clustering techniques used. Each ARI result shown is the average and standard deviation of the results of 9 individuals, presented in the annex B.2. 37
5.3 Clustering performance with the ARI algorithm with and without filter-ing stage. Each clusterfilter-ing method result corresponds to the average and standard deviation of the results of 9 subjects, presented in appendix B.4. 40
xxii LIST OF TABLES
5.5 ARI accuracy for all features (first column) and for the best set of features (set A-second, set B-third, set C-fourth and set D-fifth columns). The last row refers to the time interval used to compute the clustering for each set of features. Each ARI result corresponds to the average and standard deviation of the values from appendix B.6. . . 44
5.6 Clustering evaluation with the ARI and the Hungarian methodologies (in %) for K-means, Affinity Propagation, DBSCAN and Ward. Each result corresponds to the average and standard deviation of the results shown in the annex B.7. . . 47
5.7 Classification accuracy (in %) with Nearest Neighbors, Random Forest and LDA methods. Each result corresponds to the average and standard devi-ation of the results shown in the annex B.7. . . 47
5.8 ARI accuracy results according to each clustering method and adopted ap-proach (controlled or non-controlled acquisition). The first and the second tables refer to window duration of 3 and 5 seconds, respectively. Each re-sult corresponds to the average and standard deviation of the values pre-sented in appendix B.8. . . 49
5.9 Nine asymptomatic (N0-9) and nine symptomatic (P0-9) volunteers are presented with the respective dysfunction type and impairment score. The clinical data was organized according to the K-means method and its out-put is shown in the last column. The ND parameter refers to not defined.. 51
B.1 ARI accuracy (%) with K-means method according to different window sizes (in samples) and each ACC file. . . 65
B.2 ARI accuracy (%) according to different clustering methods and each ACC file. . . 66
B.3 ARI accuracy (%) with the K-means method according to different wavelets levels decomposition (from 1 to 15) and to each ACC file. . . 67
B.4 ARI accuracy (%) with K-means, Affinity Propagation, DBSCAN and Ward for signal processing with and without the filtering stage, BA and BA+GA components, respectively. . . 68
B.5 ARI accuracy (%) for K-means, Affinity Propagation, DBSCAN and Ward with and without the HMM application. . . 69
B.6 ARI accuracy (%) with K-means, Affinity Propagation, DBSCAN and Ward using all implemented features. . . 70
B.7 ARI accuracy (%) with K-means, Affinity Propagation, DBSCAN and Ward using only the best 4 feature types. . . 71
B.8 ARI accuracy (%) with K-means, Affinity Propagation, DBSCAN and Ward using only the best 5 feature types. . . 71
LIST OF TABLES xxiii
B.10 ARI accuracy (%) with K-means, Affinity Propagation, DBSCAN and Ward using only the best 7 feature types. . . 72
B.11 ARI accuracy (%) with K-means, Affinity Propagation, DBSCAN and Ward for the FCHA database application.. . . 73
B.12 HA accuracy (%) with K-means, Affinity Propagation, DBSCAN and Ward for the FCHA database application.. . . 74
B.13 ARI accuracy (%) with K-means, Affinity Propagation, DBSCAN and Ward for the PAMAP database application.. . . 74
B.14 HA accuracy (%) with K-means, Affinity Propagation, DBSCAN and Ward for the PAMAP database application.. . . 75
B.15 Classification with Cross-validation(%) with Nearest Neighbors, Random Forest and LDA for FCHA database application. . . 75
B.16 Classification with Cross-validation(%) with Nearest Neighbors, Random Forest and LDA for PAMAP database application. . . 75
B.17 ARI accuracy (%) with K-means, Affinity Propagation, DBSCAN and Ward and with window sizes of 3 seconds for the FCHA signals application ac-quired in a non-controlled environment. . . 76
B.18 ARI accuracy (%) with K-means, Affinity Propagation, DBSCAN and Ward and with window sizes of 3 seconds for the FCHA signals application ac-quired in a controlled environment. . . 77
B.19 ARI accuracy (%) with K-means, Affinity Propagation, DBSCAN and Ward and with window sizes of 5 seconds for the FCHA signals application ac-quired in a non-controlled environment. . . 77
Acronyms
ACC Accelerometry
ARI Adjusted Rand Index
BIC Bayesian Information Criterion
CoM Center of Mass
CVA Cerebrovascular Accident
ECG Electrocardiogram
EMG Electromyogram
FFT Fast Fourier Transform
FCHA Foundation Champalimaud Human Activity
HA Hungarian Accuracy
HAR Human Activity Recognition
HMM Hidden Markov Model
LSPB Log Scale Power Bandwidth
MEMs Micro-Electro-Mechanical-Systems
MFCC Mel-frequency Cepstrum Coefficients
MS Multiple Sclerosis
OCD Obsessive Compulsive Disorder
PA Physical Activity
PD Parkinson’s Disease
SE Spectral Entropy
SMA Signal Magnitude Area
jhg20There is a third database used in this work in order to study the framework application in a clinical environment. This database was provided by the Human Movement Analysis Lab from the Politécnico de Setúbal with 120 as sampling fre-quency. The ACC signals present in this clinical database correspond to the walking task from 9 asymptomatic and to 9 symptomatic volunteers. During this protocol, the sensor was placed in the CoM. Symptomatic patients who participated in the study showed different degrees of neurological dysfunction as a consequence of
1
Introduction
1.1
Motivation
Over time, the increasingly demand for objectivity in clinical diagnosis and the continu-ous pursuit for human wellbeing led to the development of software and hardware for healthcare. The combined efforts of medicine and engineering created and developed techniques that provide large amounts of information and simultaneously allow to inter-pret the generated data. The acquired information can be in the form of biosignals (sig-nals measured and monitored from biological events), such as Electromyogram (EMG), Electrocardiogram (ECG) or an Accelerometry (ACC) signal. Biosignal processing re-quires an acquisition stage and a transformation stage with conversion (from digital into acceleration units - g - in the accelerometry case), filtering and extraction of the useful features, which will depend on the aim of the investigation. The feature extraction step becomes very important for activity recognition because it defines what information we will cluster with. The last step is the clustering stage, applied through the obtained fea-tures, and the final evaluation of the final results for a proper interpretation of the results. Due to its importance, the clustering development for Physical Activity (PA) recognition is the central focus of this thesis and it is a main task in exploratory data mining to or-ganize datasets into different groups, which is used in many fields, including in pattern identification.
1. INTRODUCTION 1.2. State of the Art: Brief Historical Perspective
able to distinguish between normal movement patterns and those of certain pathologies. The accelerometer research in human medicine aims to help in the diagnosis and pre-vention of various diseases in which changes of the PA can be detected, such as Obses-sive CompulObses-sive Disorder (OCD), Pakinson’s Disease (PD), Multiple Sclerosis (MS) and Cerebrovascular Accident (CVA) [35]. Pathologies such as OCD present difficulties in diagnosis because it requires time-consuming and subjective monitorization techniques. Thus, objective clinical support becomes imperative in this type of pathologies, not only for diagnosis but also for treatment and evaluation by monitorization and measurement of critical information that the signal may present.
Figure 1.1 presents the protocol used in clustering and PA recognition study with an ACC signal as it was discussed earlier. Chapter 2 presents the same organization described in the scheme for an easier understanding of the adopted methodology.
Figure 1.1: ACC signal analysis with clustering approaches: after setting an investigation aim, data is collected (accelerometry signals) followed by signal processing (separation of the gravitational component from the body acceleration and conversion). After feature extraction from the signal and clustering, it is possible to obtain the PA recognition. This acquisition knowledge can contribute for the development of several pathologic condi-tion treatments such as OCD, PD and CVA.
1.2
State of the Art: Brief Historical Perspective
Several techniques for data acquisition and processing have been developed to improve the early diagnosis and clinical treatment of various diseases, such as MS and PD. MS is a neurological and progressive disorder where the subject shows disturbances associated with spasticity, weakness, speed and cadence of his movements. Such physical problems contribute for the Center of Mass (CoM) displacement and thus motion sensors, such as accelerometry, can provide objective and valid information about PA which contributes for the objective diagnosis of [5] .
1. INTRODUCTION 1.2. State of the Art: Brief Historical Perspective
More recently, Fazio and co-workers [13] concluded that it is possible to compare parkin-sonian patients with healthy individuals through the accelerometry signals and it is pos-sible to evaluate the disease and its progression with the acquired information. In this research, 24 healthy subjects, 24 with ataxic gait and 17 patients affected by PD were studied. It was observed a significant reduction of acceleration parameters in neuro-logical patients when compared with healthy subjects. The mean acceleration was 0.74 ms2 for parkinsonian, 1.07 ms2 for ataxic and 1.38 ms2 for healthy patients. The root-mean square of the acceleration was also used to quantify the attenuations of acceler-ation, which reflected the importance of the feature extraction and the research of new ones from the accelerometry signal to obtain new information.
In [50] authors applied a PA recognition methodology using different features extracted from the raw accelerometer data. Several activities were analyzed (figure 1.2) using win-dows of one second (segmentation) with 50% overlap. The usefulness of four features to study specific characteristics of the accelerometer signal has been shown as well in this study: the mean, standard deviation, energy and signal correlation. U. Maurer and co-workers [50] achieved high accuracy results with decision trees: 92%.
Figure 1.2: Accelerometry signal in X-axis, located in the pelvic region [50], which presents a clear distinction between the physical activities: walking, running, walking, climbing up and climbing down stairs, vacuuming, brushing teeth and sit-ups.
Similarly to [50], I. Machado [35] concluded that four features from time and fre-quency domains can achieve high recognition accuracy (about 99%). The used features were mean, autocorrelation, root mean square and Mel Frequency Cepstral Coefficients (MFCC). In [35], the author contributed to the PA recognition in accelerometry with the K-means technique and also inferred that one waist-worn accelerometer can identify the physical activities in an adequate manner.
1. INTRODUCTION 1.2. State of the Art: Brief Historical Perspective
outside the laboratory. For each second of the accelerometry data, Spectral Entropy (SE), the Autoregressive Coefficients and the Signal Magnitude Area (SMA) were calculated. These features illustrated the effectiveness of the method, with an average accuracy of 95%.
The referred features were used in a clustering stage for human activity recognition with K-means algorithm, an unsupervised and iterative clustering method which produces very effective results. On the other hand, this clustering technique shows a long running time for its computation complexity. Therefore, the authors from [42] suggest an im-proved k-means algorithm retrieving similar clustering results as the standard k-means but with the advantage of having a shorter running time by improving its speed.
Furthermore, in [2] it is shown not only k-means clustering presents a good performance, but also spectral clustering and affinity propagation approaches show high accuracy re-sults.
Moreover, in another article [33], where k-means is exploited and also gives good accu-racy rates, a comparison between different similarity measures is made. K-means cluster-ing results, as in other clustercluster-ing methods, depends on similarity measurements, which are values which translate the distance between two data points to be compared.
Euclidean and Manhattan distance functions were compared and R. Loohach and col-leagues [33] concluded that k-means clustering performance increases when Manhattan distance function is used, except for k=4, 5, 7. For these last k-values, Euclidean distance shows a better efficiency. Furthermore, Manhattan distance function requires less com-putation than the Euclidean one, which improves the time complexity of the clustering technique.
1. INTRODUCTION 1.3. Objectives and Thesis Structure
1.3
Objectives and Thesis Structure
The developed work present in this thesis aims to create and develop a framework to recognize different human activities and positions by their accelerometry signals using advanced algorithms, such as machine learning techniques and Markov Models. All rel-evant stages of this framework are represented in the scheme shown in Figure 1.3. The implemented algorithms are design to identify relevant parameters from data and to sup-port movement disorders diagnosis and physiotherapy.
As an introduction, the thesis presents a state-of-the-art with the respective literature re-view in order to contextualize the experimental obtained data. The topics of this thesis cover features and clustering techniques investigation, accelerometry signals, Markov Models study and the literature revision that provides the motivation for this thesis. For signals acquisition, a protocol formed by several physical activities was adopted and an ACC system was placed on the waist (near of the CoM) and to monitor individuals for data collection. The protocol for data acquisition was composed by several activities, such as lying down, walking, sitting, running, standing, ascending and descending stairs and allowing the possibility to add jumping and riding a bicycle. Then, it is possible to add or even create new features that may lead to an improvement of PA recognition in several domains and develop algorithms to extract relevant information from the ACC data. The evaluation of the clustering application is a crucial stage of the thesis develop-ment to report the effectiveness of the framework and data interpretation. Therefore, it is important to study the influence of features and other parameters on the performance of different clustering algorithms. The Hungarian Accuracy (HA) is also implemented as a metric to evaluate the output labels.
Finally, the framework evaluation in daily routine settings and the knowledge applica-tion to a real life case acquired over this work could also be an interesting step to follow, such as the progression of a certain disease or the locomotion impairment as a conse-quence of a CVA.
1.4
Thesis Overview
This thesis is divided into six chapters.
The first two chapters concern to the state-of-art that supports all the research required for the data processing presented in this study. Chapter 1 shows a brief historical per-spective, the objectives and motivation of the present thesis. Chapter 2 presents the re-quired theoretical background for the field of research, including basic operation of the accelerometer, its advantages and operating criteria, the composition of the acquired sig-nals and the existing machine learning techniques to be used.
1. INTRODUCTION 1.4. Thesis Overview
Chapter 4 and 5 correspond to the results obtained in this work. In particular, chapter 4 presents a set of features similar to those used in [35] (time, statistical and spectral do-mains) and a new set of implemented features inspired on audio recognition methods, including features from the time-frequency domain.
The choice of features is a fundamental step to apply machine learning methodologies to sensor data and it influences the outcome of any approach. The proposed methodology for feature selection and the influence of several parameters such as window size and HMM application are also described.
Chapter 5 carries out all results achieved from all studies referred before in chapter 4 with clustering performance evaluation methods.
Chapter 6 the main conclusions of the present work are drawn.
Appendix B presents additional results and appendix C consists on two papers: one re-cently submitted to the 8th International Joint Conference on Biomedical Engineering Systems and Technologies (BIOSTEC 2015), held in Lisbon in January 2015, and other published in Elsevier - Procedia Computer Science.
2
Theoretical Background
2.1
Accelerometry and Accelerometer
Recently, the use of systems based on accelerometers to quantify and characterize human movement has increased significantly. These systems are becoming indispensable in the field of diagnosis, treatment and research by providing qualitative and quantitative data [27].
Overall, there are several types of accelerometers such as fluid, magnetic, strain gauge, piezoresistive, capacitive and piezoelectric [27], [58]. These latter three classes are more commonly applied in the classification and study of the human movement. The general and basic mechanism of the Micro-Electro-Mechanical-Systems (MEMs) will be described in the following section 2.1.1 [27].
2.1.1 The Accelerometer System Function
2. THEORETICALBACKGROUND 2.1. Accelerometry and Accelerometer
Figure 2.1: Representation of the operating principle of MEMs accelerometer where k is the spring constant, x is the displacement of the system with mass m and a is the acceleration of the mass-spring system, calculated from the equations 1 and 2.
2.1.2 The Accelerometer Signal
The accelerometer signal is composed of a static component, known as the gravitational acceleration (ing), which is always present (Fig. 2.2) and qualifies the accelerometer as an inclinometer. In these conditions, an horizontal sensing axis detects acceleration around 0 g and a vertical sensing axis (aligned with the center of the Earth) can detect an accel-eration value around 1 g [27]. Therefore, the gravitational acceleration offers information concerning space orientation of the accelerometer and thus, the subject’s posture.
In addition to the gravitational component, accelerometer-based systems show inertial components, in a local coordinate system in the 3D accelerometer case. Each component or plane responds to the frequency and intensity of the movement of the subject [19], [27]. There are uniaxial, biaxial and triaxial devices, for 1D, 2D or 3D accelerometers respec-tively, and its selection depends on many factors such as the aim of the investigation and its budget.
Due to the characteristics of the accelerometer signal, calibration is an important pro-cedure and it is performed by placing the accelerometer in a known static orientation position relative to the given body under study [23]. The reference point is taken as 0 g in a free-fall situation. The acquired data from the accelerometer depends on several conditions and criteria, which will be further discussed in section 2.1.3.
2.1.3 The Accelerometer Functioning Criteria for Human Activity Analysis
2. THEORETICALBACKGROUND 2.1. Accelerometry and Accelerometer
studied in order to ensure the patients’ comfort and to assure that the study is performed as planned [35]. In some situations, where the goal is to study ‘whole body’ movements, the most used placement is close to the center of mass of the human body, for instance the sternum [28], waist [19] or lower back, in the lumbar region [41].
The task performed by the subject will produce variations in the detected accelerations. If the subject is at rest, acceleration is determined by its position according to the grav-itational direction and it is possible to determine the posture of the subject. It is also important to consider the orientation of the accelerometer relatively to the body location for better understanding and analysis of the output data.
Figure 2.2: Representation of a 1D accelerometer on the wrist and respective sensing axis (in blue) accordingly to the subject’s movement. The orange arrows represent the gravitational acceleration. In (b) the output of the sensing axis is aligned with the global horizontal and the gravitational component is null. In (a) and (c) the sensing axis is no longer perpendicular to the gravitational vector (unlike in b) and will show not just the body acceleration but a part of the gravitational component (from 0 to 1g).
2.1.4 Advantages of Accelerometer System
The MEMs technology presents several advantages over more traditional and subjective analysis, such as:
• Relative low cost and simple to operate compared with traditional optical gait anal-ysis such as optical markers [13], [18], [19], [27]. It can be applied in real life situa-tions such as to backup rehabilitation;
• Portability [54], [58]. It can be used in different environments and infrastructures, not just in a laboratory [10], [13], [23], [27];
• Small size of the accelerometry apparatus allowing the possibility of more test movements without restrictions [13], [19], [27], [58];
• Allows direct measurement of acceleration in three dimensions, reducing error due
2. THEORETICALBACKGROUND 2.2. Accelerometry Signal Processing
• The ability to record data for longer periods [19];
• Few requirements for energy, memory and processing power [35].
2.1.5 Applications of the Accelerometer Technology
Based on the accelerometers’ operation method and its several advantages, this type of device presents a wide range of applications, such as military, automotive, industrial or science and medical fields [10], [18]. In the two latter areas, accelerometry is especially important due to its several applications and its importance in the clinical diagnosis and treatment. The following list presents some applications of the accelerometry signal in the medical investigation field:
• Understand the stability in walking pattern [27] and evaluate walking impairment, which is a prevalent feature of MS [19], [53];
• Evaluation of PA pattern analysis in many situations, such as skiing [41], control
of the elderly [3], [58], fall prediction [3], [27], [58] and neurodegenerative diseases diagnosis, such as PD;
• Sleep-control studies as well as in autism [19] and conditions with mobility-impairment,
such as obesity or stroke.
2.2
Accelerometry Signal Processing
For the signal processing step the knowledge of the particular characteristics of the signal as well as specific filtering and conversion techniques are mandatory. This process allows a better analysis of the critical information and the higher reliability of results. In this section, the characteristics of accelerometry signals and a short approach of the necessary conversion, filtering and segmentation techniques applied to ACC signals are described.
2.2.1 Characteristics of the Signal
As mentioned in section 2.1.2, the ACC signal is constituted essentially by the gravi-tational acceleration and the linear or body acceleration due to the human movement. There is also a third component related with the intrinsic noise of the electronic system and measurement conditions [14], [35].
2. THEORETICALBACKGROUND 2.3. Machine Learning
2.2.2 Filtering and Segmentation Process
The raw data generated by the accelerometric device can be recorded or wirelessly trans-mitted, which is then followed by data conversion and filtering techniques [23], [35], [54]. Data can be converted to acceleration units, ms2or g [41], according to the device speci-fications and acquisition type.
Afterwards, an high-pass filter is applied to the raw data signal with a cutting frequency (with different frequency values according to the literature). While F. Foerste and co-workers [14] applied a 0.5 Hz cut-off high-pass filter frequency to all the signals, [35] used a 0.25 Hz cut-off frequency on a second order Butterworth high-pass to separate both accelerations, body and gravitational components.
Segmentation can be applied throughout several approaches, which help to clearly iden-tify the most relevant properties of the signal and the most important information ob-tained from the dataset to use in the feature extraction and selection.
Timing and sliding windows may be considered as segmentation methods and the most important questions about these techniques are: What is the most suitable length of each window? Is an overlap percentage required? All these questions should be answered in order to maximize the information and high resolution is obtained from the signal [32], [35], [39], [50].
2.3
Machine Learning
Machine Learning is considered a subarea of Artificial Intelligence since those algorithms make computers learn how to behave more intelligently by somehow generalizing rather than just storing and recovering data items. This field offers a wide variety of methods for PA recognition and many of them may be based on the feature representation of ac-celerometry signal. There are essentially two types of machine learning algorithms:
• Unsupervised learning or clustering – where the system receives unlabeled dataset with no information about the class to which each point belongs to [44]. In this method, data points are grouped into clusters based on similarity of some metric [12], [17], [25], [35]. The goal of clustering is to determine well-separated and ho-mogeneous groups. In other words, the system must have simultaneously similar entities belonging to the same cluster and different entities belonging to different clusters [4], [42];
• Supervised learning or classification – is a process which identifies unknown and
2. THEORETICALBACKGROUND 2.3. Machine Learning
There is a hybrid machine learning type named semi-supervised learning, where only a portion of the training dataset are available and the unlabeled data part is also used in the learning process [24], [25].
2.3.1 Machine Learning Techniques
Generally clustering methods aim to identify and organize a dataset into different la-beled groups, through their similarity in order to provide meaningful information from the original dataset. These groups are called clusters and they can differ in shape, size and density [25]. Values that belong to the same cluster show a higher similarity between them than to different clusters [25], [31], [35], [44]. The collected data can be analyzed with clustering methods for PA recognition through different extracted features [50]. Clustering is essential when an identification of unlabeled data is required and it can be applied to different types of data, such as binary, categorical, numeral, ordinal, textual, spatial, and temporal, among others [31], [32]. The quality of the final results depends on both the implemented clustering method and the adopted approach [25], [44].
Dataset can be named static if its features do not change with time and the majority of clustering methods have been implemented on static data [31].
Clustering itself is not a specific algorithm but rather a general task that comprises differ-ent algorithms and methods. In the following sections, general-purpose clustering algo-rithms used in time series clustering studies will be briefly addressed and measurements to study the similarity between data points, such as the requested criteria for performance evaluation of the final results [25], [31].
On the other hand, for supervised learning and for an in-depth study of PA recogni-tion, it would also be interesting to use the Markov model applicarecogni-tion, which aims to present results from the present outcomes through probabilities. This model is used for modelling conditions of the occasions that may happen repeatedly over time or for mod-elling predictable events that take place over time [15].
The main steps for application of the Markov Model are essentially: enumerate the states (in this case, states are all the activities performed by the subject in the accelerometry study) and define admissible state transitions; identify the probabilities and associate them with the transitions; identify the outcome values and determine the expected re-sults.
2. THEORETICALBACKGROUND 2.3. Machine Learning
analysis and for credible PA recognition results [16], [17], [43], [55].
2.3.2 Unsupervised Learning Methods
Unlike static data, feature time series contain values which change over time [31]. Time series clustering may be divided into two groups: “whole clustering” and “subse-quence clustering”, which is performed on several individual time series or on sliding window extractions of a single time series, respectively [35]. Moreover, time series clus-tering requires a clusclus-tering algorithm which divides the dataset into different clusters. The choice of algorithm depends on the type of dataset available and the goal of the re-search. It is used initially to convert time series into static data format in order to use the static data algorithms [28], [37]. In the existing literature based on PA recognition with accelerometry data, clustering methods vary according to the intended approach [28].In agreement with [22], clustering methods are classified into five classes: partitioning class; hierarchical class; model-based class; density base class and grid-based class.
Each of these classes is summarized below as well as some of the most important clus-tering algorithms belonging to the Scikit-learn library. The latter is a machine learning algorithm collection for supervised and unsupervised environments with an useful in-terface strongly integrated within the Python language [46].
Partitioning Class Initially, the unlabeled data is divided into k partitions (clusters) and
each partition contains at least one data object. A cluster has a crisp partition when each data object belongs to just one cluster and this type of partition is present for instance in the k-means algorithm. On the other hand, a fuzzy partition allows one data point to exist in more than one cluster with a different degree [25], [31], [44].
• K-Means - The k value (number of clusters) is defined and k points are
cho-sen at random as cluster centers. All data points are assigned to their closest cluster center according to some metric and the centroid of each cluster is cal-culated. This process is repeated and for each iteration the centroid position will change due to re-calculation by averaging all the points in the cluster. The relocation of the data points and the computation of each clusters’ centroid is stopped when almost no change is observed or when the process is below a defined threshold [12], [17], [31]. Advantages: simplicity, efficiency and high computing velocity for large datasets [24]–[26], [33], [35], [42]. Limitations: The final clusters are sensitive to the initial cluster centers [24] and this method requires the knowledge of the k-value (number of clusters) [4], [25].
• Mini Batch k-means - It is a variant of K-means method and uses mini-batches,
2. THEORETICALBACKGROUND 2.3. Machine Learning
centroid. Advantages: minimize time complexity compared to the original method. Limitations: This algorithm outputs less accurate results than the original k-means method.
• Affinity Propagation - This method clusters a dataset by sending messages be-tween pairs of samples until they converge. These messages are scalar values and represent the suitability for one data point to be the exemplar (representa-tive) of the other, which is updated in response to the values from other pairs. This update procedure continues until convergence and the final clustering is obtained. Annex A of this document includes more information for a detailed analysis of this clustering method, such as all parameters and python code used in this work. Advantages: for small or medium sized datasets, choosing the number of clusters based on the dataset provided [56].
Hierarchical Class Is based on dataset division into a hierarchical decomposition,
cre-ating a tree shaped structure. This hierarchical division can be performed in an agglomerative (“bottom up”) or in a divisive method (“top down”). The agglomer-ative technique classifies data objects in individual clusters and then merges clus-ters into wider groups based on criteria defined by the user. This approach ends when all data objects are in the same cluster or when certain conditions are satis-fied. The divisive method is the opposite of the latter because all data objects are defined as a single cluster and then they are separated into different groups, based on specific criteria [25], [31], [44].
• Spectral Clustering - This method involves complex calculations where the first step consists in the similarity matrix construction based on the data ob-jects, followed by the associated Laplacian matrix computation. The eigenval-ues calculated from the Laplacian matrix will be finally clustered with k-means [9], [31]. Limitations: Requires the K-value initially and it is appropriated for only few clusters. Advantages: Very efficient for sparse datasets up to sev-eral thousands and analyses data as a graph partitioning problem without any supposition on the shape of the clusters.
• Ward - Clusters the dataset with an agglomerative approach. The Ward
tech-nique is based on the minimal variance criterion and two clusters will be ag-glomerated into one when a defined value is not reached. Otherwise, those clusters will be apart [31]. Limitations: Requires the K-value initially.
Model-based Class Defines a model to assign to each cluster and tries to fit all data
ob-jects to the specified model [31].
Density-based Class In this method, a cluster grows up until its neighborhood density
2. THEORETICALBACKGROUND 2.3. Machine Learning
objects [31].
• DBSCAN - Clusters are areas of high density and are separated by regions of
low density and therefore can express any shape in opposition to the k-means algorithm output. A core data point belongs to the regions of high density and therefore each cluster is a set of core data points. Every non-core data point that presents a large distance from any core sample is defined as an outlier. Advantages: It finds the number of clusters automatically.
• Mean Shift - It is a versatile algorithm which estimates the global density re-ducing computational complexity. This approach studies the feature’s space as a probability density function in which the local maximum corresponds to the formed clusters. For each data sample, a window around this maximum point is defined and the sample mean is computed. For each iteration the win-dow is shifted to the mean and this procedure is repeated until a defined value is reached [6]. Advantages: This procedure defines the number of clusters au-tomatically and does not constrain to the clusters shape.
Grid-based Class This method divides the space object into a number of cells. This
di-vision forms a structure in a grid shape where clustering techniques can be applied [31].
The clustering distance metric it is also an important component for clustering algo-rithms. Several distance measurements may be applied, which will influence the final results [31], [44] such as the Minkowski Distance, expressed by:
d[k, l] = (Pd
i=1(|xik−xil|)s)1/s(eq. 3)
where s represents the order of the function and depending on its value different names for Minkowski distance arise: for s=1, it is called Manhattan or City-Block distance, in which the distance between two data points equals the sum of the difference of their co-ordinates (for a horizontal or vertical move in adjacent cells it is 1 unit and for crossed move, it will be 2 units [33]). On the other hand, for s=2, the distance is called Euclidean and it is the minimum sum of squares of its coordinates [20].
All clustering methods referred above will be used in this thesis with the Euclidean dis-tance to find the most suitable techniques for PA recognition.
2.3.3 Procedures for K-value Estimation
2. THEORETICALBACKGROUND 2.3. Machine Learning
the total squared distance of all points to their cluster center [24], [25]. The following list is a small approach of the most used K-identifying procedures.
Gap statistic- The Gap statistic performs a comparison between the resultant value from
the square error criterion, Wk, and a reference distribution with no obvious clustering
(E∗
nlog(WKb)) such as an uniform distribution. Gap statistic computation is represented
as:
Gap(K) =E∗
nlog(WKb)−log(WK)(eq. 4)
where:
WK = K P k=1
1
2nKDK(eq. 5) and
DK = P xi∈CK
P xj∈CK
||xi−xj||2(eq. 6),
which represents the sum of intra-cluster distances between points in the clusterCK
containingnKsamples.
To computeE∗
nlog(WKb), the average of B copies is computed. Each of these copies is
generated by the reference distribution and will show a certain standard deviation,sdk,
used in:
sK=sdK q
1 +B1 (eq. 7)
Finally, the k-value is defined for the smallest K found, such that
Gap(K)≥Gap(K+ 1)−sk+1(eq. 8) [7], [38]
Elbow method- The “elbow” method offers a solution based on intra-cluster variance.
The elbow method shows the percentage of variance explained by the ratio of clusters and its number. Initially, this curve increases sharply, reaching a plateau, which corre-sponds to the percentual difference between different k-values. This value correcorre-sponds to k-value [52].
Bayesian Information Criterion -The Bayesian Information Criterion (BIC) is a
statisti-cal criterion for model selection, which may also be used to unravel clustering problems for finding the number of clusters [49] . The authors from [49] have proposed a method to identify the number of clusters through the knee point detection of the resulting BIC curve, represented by:
BIC =L(θ)−12mlog(n)(eq. 9)
2. THEORETICALBACKGROUND 2.3. Machine Learning
2.3.4 Clustering Performance Evaluation
The final and most important goal of clustering is to obtain new information, knowledge, from the original dataset and it is crucial a judicious and careful assessment of the final results. For clustering validation it is important to be aware that different parameters or approaches may result in different clustering results, even with the same algorithm and initial dataset. So, it is important to adopt initially certain criteria to get the results as objective as possible [31].
There are two different evaluation types: known and unknown ground truth, with and without knowledge about the clusters’ number, respectively [31]. In the first, after a clustering performance evaluation, it is possible to assess if the separation of the data is similar to the available ground truth set. In this situation it is important to create a data annotation as a ground truth, such as manual annotation in each activity performed in a given moment. With an unsupervised learning, a data annotation is required to evaluate the performance of the adopted algorithm and to verify the labeled results [28], [35], [44]. For clustering performance evaluation two methods were used in the present work:
Hungarian Assignment- With two solution sets, the predicted labels and the ground
truth set, it is possible to measure the distance between both for label vector comparison. Unlike the supervised learning process, the labeling of the predicted clusters on the data set must correspond to the ground truth available only up to an unknown permutation of the indices. If two partitions of the data set are equivalent but its labelings are repre-sented in a different form (for instance, for k=2, in the first partition the cluster labeled 1 is labeled 2 in the second one and vice-versa), there is an ambiguity. This problem is inherent to the unsupervised learning due to lack of information about data labeling. To overcome this ambiguity the labelled indices in one predicted solution are permuted in order to increase the agreement between the two solution sets under comparison. This ambiguity can be minimized through the Hungarian method with a matrix construction based on the labels and the ground truth similarity. This evaluation method measures the fraction of differently labeled points through the diagonal of the resulting matrix [29].
Adjust Rand Index - No conjecture is performed on the cluster arrangement and this
technique can be used in an unsupervised environment, ignoring permutations. With a ground truth class assignment as C and with k as the number of clusters, we have:
RI = a+b
C2nsamples (eq. 10) andARI =
RI−E[RI]
max(RI)−E[RI](eq. 11)
where a is the number of pairs of data points that are in the same cluster in C and in the same cluster in k and b is the number of pairs of data points that are in different clusters in C and in different clusters in k.C(nsamples)
2 in expression (eq. 10) is the number of
2. THEORETICALBACKGROUND 2.3. Machine Learning
3
Acquisition Systems and Procedures
The HAR systems developed and studied in the present work with a dependent subject approach are based on the processing of several ACC datasets. The analyzed data is formed by three databases: the online available PAMAP database, the FCHA database acquired from 9 volunteers in the Champalimaud Foundation and the clinical database.
3.1
Foundation Champalimaud Human Activity database
Daily routine activities require many complex movements and positions and this com-plexity diverge according to each subject, namely in terms of velocity and time duration. This complexity makes signal acquisition from ACC sensors even more challenging if these physical activities are carried out in a non-controlled environment.
The algorithm created in this thesis aims to recognize and distinguish all activities present in the protocol, which is formed by 3 types of postures of static nature, and 6 movements, of cyclic nature, listed on table 3.1.
3. ACQUISITIONSYSTEMS ANDPROCEDURES 3.1. Foundation Champalimaud Human Activity database
Table 3.1: Set of activities performed by 9 volunteers in order to collect its ACC data and to create the FCHA database.
Postures Movements
Walking
Standing Running
Sitting Ascending Stairs
Lying Down Descending Stairs Cycling Jumping
Figure 3.1: a) Wrist tri-axial accelerometer; b) waist tri-axial accelerometer and respective acceleration components’ directions; c) Axis orientation of the waist sensor relative to the volunteer’s body.
The adopted protocol is composed of two approaches, a controlled and a non-controlled environment stage, in order to test and exploit the algorithm’s performance in different acquisition conditions (Figure 3.2). In the first part, several activities such as standing, sitting, walking, running and lying down were performed with a pre-defined order and time, excluding the ascending and descending stairs tasks. The walking and running activities were carried out in a crosswalk with pre-defined velocities (of 4 km/h and 10 km/h respectively). In the non-controlled environment, a list of activities is defined and the volunteers could choose the activities from the list and the order which they wanted to perform them. Task repetitions were also allowed. In this approach the speed and duration time were chosen by the volunteers in order to create as much as possible a real-istic acquisition environment, similar to a daily routine. The activities are listed in Figure 3.2.
3. ACQUISITIONSYSTEMS ANDPROCEDURES 3.1. Foundation Champalimaud Human Activity database
Figure 3.2: Recorded Movements and respective labels and time duration for each pro-tocol. The set of signals acquired from this protocol is called FCHA (carried out in the Champalimaud Foundation) database.
3. ACQUISITIONSYSTEMS ANDPROCEDURES 3.2. PAMAP database
3.2
PAMAP database
The ACC signals database of this study also included the PAMAP database, available at [45] in order to verify the created HAR system performance with acceleration data at different resolutions and sensor locations. The PAMAP signals were acquired with a sam-pling frequency of 100Hzand a resolution of 13bits. The same 9 activities were selected from those presented in the PAMAP data, listed in the table 3.2. The data was acquired from 8 volunteers with an age range 24-32 years and the 3D-accelerometric sensor used was placed on the chest. All movement tasks were performed at each subject’s pace, in order to acquire data on the most realistic condition as possible [45]. However, task du-ration was defined as presented on table 3.2 and for this reason the PAMAP database is classified as data acquired in a controlled environment.
Table 3.2: Movements and respective labels and time duration from PAMAP database. PAMAP Database
Label Movement Time (seconds)
0 Standing 180
1 Sitting 180
2 Walking 180
3 Running 180
4 Lying Down 180
5 Ascending Stairs 60 (twice)
6 Descending Stairs 60 (twice)
7 Cycling 180
8 Jumping 120
The ACC data from the FCHA database corresponds to data acquired in two dif-ferent environments: a controlled and a non-controlled environment as referred before. Furthermore, ACC data presents different resolutions with the PAMAP inclusion. This data variability allows analysis and adaptability of the developed framework in different situations.
3.3
Clinical database
3. ACQUISITIONSYSTEMS ANDPROCEDURES 3.3. Clinical database
diabetic peripheral neuropathy and lymphoma. The dysfunction score presented in Table 3.3 did not reflect just the walking ability but also other parameters such as: the reaction speed, the impairment of reasoning, speech and of other body parts. Therefore, this score was not be used as ground truth.
This third database was used by the framework developed in the present work as first potential clinical application showing its usefulness to evaluate the quality of motion.
Table 3.3: Nine asymptomatic (N0-8) and nine symptomatic (P0-8) volunteers and respec-tive dysfunction type and impairment score. The ND parameter refers to not defined.
Subject Dysfunction Type Impairment Score
N0-8 None ND
P0 CVA 21
P1 CVA 22
P2 CVA 17
P3 CVA 13
P4 Diabetic peripheral neuropathy 20
P5 CVA + lymphoma 22
P6 CVA 15
P7 CVA 10
P8 CVA 14
3. ACQUISITIONSYSTEMS ANDPROCEDURES 3.3. Clinical database
4
Framework for HAR systems
In this section two distinct stages related to the clustering step in the proposed frame-work for activity recognition are described, namely: base clustering and meta clustering corresponding to procedures to be carried out before and after the clustering application, respectively.
Several parameters were studied in order to improve as much as possible the clustering results, such as: filtering and window-length and feature free parameters. This study also includes the most relevant feature identification for activity recognition to reject those that reflect irrelevant or even redundant information and to reduce computational de-mands. These studies are important for feature extraction reflecting the signal’s charac-teristics and information transmission to the clustering algorithm composing ACC data. All these studies are explained in detail in the section 4.1.
Finally, the last section (vide section 4.2) highlights the importance of a ground truth availability to compute several algorithms, such as the Hungarian Assignment and the Hidden Markov Models application.
4.1
Base Clustering
4. FRAMEWORK FORHARSYSTEMS 4.1. Base Clustering
Feature Selection is also an important step to implement after feature extraction because it influences the final outcome. This stage is essential when there is a massive amount of information with a vast quantity of features, where some of which are not completely essential for the clustering step or provide redundant information [32], [44]. Therefore, with feature selection procedure the time and computational complexity are reduced and the accuracy of clustering performance increases. Features must be selected according to the acquired data and the aim of the investigation. An ideal feature type presents a large variation between different clusters and a small one between data belonging to the same cluster [35], [36], [44].
4.1.1 Basic Features and Wavelets Application
It is possible to group features according to different parameters, such as time, statisti-cal and frequency domains. In the temporal domain, there are several known features, already used in accelerometry, such as zero crossing rate, autocorrelation and variance. Other features such as mean, standard deviation, histogram and root mean square are some examples computed from the statistical domain, that do not depend on the fre-quency or the time variation of the signal [23], [28], [35], [50], [57]. In the frequency domain, it is possible to compute the maximum and median frequencies, the fundamen-tal frequency, the power bandwidth and the Fast Fourier Transform (FFT) coefficients, through the FFT of the original signal.
In the frequency spectrum analysis through FFT the original data is compared to a fam-ily of sine functions at harmonically related frequencies. Nevertheless, the FFT does not provide information about the time at which these frequency components occur, which leads to the need for a tool that allows us to analyze the signal on both domains.
A wavelet is a specific technique for the time-frequency domain and it is an irregular waveform of limited duration with zero average value on the time domain. A wavelet analysis decomposes the original signal into elements. It allows a visualization of the frequency content over time and consequently a better transient event description in an accelerometry signal [16], [19], [39]. The decomposition process may be computed at different levels. A single level decomposition applies two complementary low-pass and high-pass filters to the input signal, which outputs the approximation and the detail co-efficients, respectively. The approximation coefficients reflect the main characteristics of the signal and these values are used as feature coefficients in this work [30].
4.1.2 CUIDADO Features and Log Scale Power Bandwidth Implementation
4. FRAMEWORK FORHARSYSTEMS 4.1. Base Clustering
to the temporal domain applied in the present work. The variance computes the signal’s variance over time and the temporal centroid corresponds to the time averaged over the signal’s energy wave.
On the other hand, in the spectral domain, there are several features such as: the total energy which estimates the signal power at a given time; the spectral centroid that may be described as the barycenter of the distribution of frequencies and their probabilities to occur; the spectral spread and skewness which are the variance and the measure of the asymmetry of the distribution defined above, respectively; the spectral kurtosis which measures the distribution’s flatness around the mean value; the spectral slope and the spectral decrease, related to the decrease of the spectral distribution through its linear regression computation; the spectral roll-off point which is the frequency where 95% of the signal energy is contained below of this value; and the spectral variation, computed from the normalized cross-correlation between two consecutive amplitude spectra (rep-resented as spectrum variation) [47].
The MFCC belongs also to the CUIDADO set and is widely used for speaker recognition. For a more accurate analysis of all accelerometry signals a meticulous analysis in the quency and amplitude domains would be mandatory. In the present work, the lower fre-quencies were studied in more detail than higher frefre-quencies through logarithmic scales. This study was inspired by the audio spectrum and the mel-scale which ultimately lead to the Log Scale Power Bandwidth (LSPB) feature creation. The inputs for the LSPB are the motion data (Algorithm 1).
Algorithm 1: Log Scale Power Bandwidth
Input Accelerometry Signal
Output Log Scale Power Bandwidth coefficients
This algorithm concerned five stages:
1. The first stage was the preemphasis of the signal in time domain. This stage filters a data sequence (the input segment signal) through a digital filter that increases the magnitude of the signal at high frequencies, thereby improving the signal-to-noise ratio and using with a pre-emphasis factor of 0.97;
2. The second step referred to the framing which divides the input data into a set of 3 (M) frames, each of these with 256 (N) samples;
![Figure 3.3: Representation of all three components (x,y and z) of the acquired ac- ac-celerometry signals in the first stage of the protocol, the controlled environment, in the OpenSignals software [51]](https://thumb-eu.123doks.com/thumbv2/123dok_br/16541893.736775/47.892.149.788.566.989/representation-components-acquired-celerometry-protocol-controlled-environment-opensignals.webp)