Article
Printed in Brazil - ©2014 Sociedade Brasileira de Química0103 - 5053 $6.00+0.00A
*e-mail: [email protected]
A Novel, Donor-Active Solvent-Assisted Liquid-Phase Microextraction Procedure
for Spectrometric Determination of Zinc
Lívia Kocúrová,*,a Ioseph S. Balogh,b Martina Fatľová,a Yaroslav Bazeľ,a András Simon,c Rastislav Serbin,a Miroslav Badida,d Radoslav Rusnákd and Vasil Andrucha
aDepartment of Analytical Chemistry, University of P. J. Šafárik, SK-04154 Košice, Slovakia
bDepartment of Chemistry, College of Nyíregyháza, HU-4400 Nyíregyháza, Hungary
cDepartment of General and Analytical Chemistry, Budapest University of Technology and
Economics, HU-1111 Budapest, Hungary
dDepartment of Environmentalistics, Faculty of Mechanical Engineering,
Technical University of Košice, Park Komenského 5, SK-04154 Košice, Slovakia
O presente trabalho descreve o uso de microextração em fase líquida com um solvente doador-ativo para a determinação espectrofotométrica de zinco, em 570 nm, usando a reação com tiocianato e com o reagente brometo de 2-[2-(5-dimetilamino-2-tiofenil)-vinil]-1,3,3-trimetil-3H-indolium (DTVTI). As condições experimentais ótimas foram estabelecidas usando NH4SCN 0,02 mol L–1 e
DTVTI 4 × 10⁻⁵ mol L–1. Estudaram-se ainda vários solventes extratores, separados e em misturas,
com diferentes promotores, sendo selecionada a mistura de tolueno como solvente de extração e tributilfosfato como solvente doador-ativo na razão de 4:1 v/v. O sistema mostrou resposta linear até a concentração de 2,62 mg L–1 de zinco com um limite de detecção de 0,09 mg L–1. O método
desenvolvido foi aplicado na determinação de zinco em suplementos dietéticos.
Based on the reaction of Zn(II), thiocyanate and 2-[2-(5-dimethylamino-thiophen-2-yl)-vinyl]-1,3,3-trimethyl-3H-indolium bromide (DTVTI), a donor-active solvent-assisted liquid-phase microextraction procedure followed by spectrophotometric determination of zinc at 570 nm was developed. The optimum experimental conditions were investigated and found to be as follows: concentration of NH4SCN 0.02 mol L−1, concentration of DTVTI 4 × 10⁻⁵ mol L−1. Various extraction
solvents were studied alone as well as in mixtures with different improvers, and a mixture of toluene as the extraction solvent and tributylphosphate as the donor-active solvent in a 4:1 v/v ratio was selected. The calibration plot was linear up to 2.62 mg L−1 of zinc with limit of detection
0.09 mg L–1. The developed procedure was applied for zinc determination in dietary supplements.
Keywords: zinc, donor-active solvent-assisted liquid-phase microextraction (DAS-LPME),
dietary supplements, spectrophotometry
Introduction
Zinc is among the most commonly used metals and has a number of applications in industry. Zinc and its compounds are frequently used for galvanising, for the production of alloys such as brass and bronze, and as pigments in paints, among other uses. Zinc is also an essential trace element and is indispensable for the functioning of numerous enzymes.1-3 It is naturally present in some foods and also
available in dietary supplements.4
Currently we can see several trends in analytical chemistry, including miniaturization, development of novel methods that comply with the requirements of green chemistry, as well as automation. Liquid-liquid extraction, one of the oldest sample pre-treatment techniques, is no exception to these trends.5,6 Liquid-phase microextraction
has now been coupled with the majority of analytical instrumentation,7-10 however, the use of spectrophotometry
as a detection technique is sometimes difficult,11,12 primarily
other hand, traditional molecular spectrophotometry is not old-fashioned;13 it is still one of the most commonly
employed detection techniques14-15 in analytical chemistry
and is frequently used for the determination of metals after a complex-formation step.16
One can find only a limited number of papers devoted to microextraction procedures for the determination of zinc, and the majority of these coupled with flame atomic absorption spectrometry or inductively coupled plasma-optical emission spectrometry.17-19 Therefore, in a
continuation of our previous endeavors in the development of novel sample pre-treatment techniques,20-24 we herein
offer a microextraction procedure coupled with the UV-Vis spectrometric determination of zinc. The method is based on the formation of an ion associate between Zn(II), thiocyanate and 2-[2-(5-dimethylamino-thiophen-2-yl)-vinyl]-1,3,3-trimethyl-3H-indolium bromide (DTVTI) that is extractable by a mixture of solvents.
Experimental
Reagents
All chemicals and solvents used were of analytical reagent grade. ZnSO4 × 7H2O and NH4SCN were purchased from
Sigma-Aldrich. The DTVTI reagent was a kind gift from Dr. Ioseph S.Balogh. Distilled water with conductivity of 2.5 µS cm–1 was used throughout the work. A stock solution of
1 × 10⁻³ mol L–1 Zn2+ was prepared by dissolving 0.0289 g
ZnSO4 × 7H2O in water (to avoid hydrolysis, a few drops of 0.5 mol L–1 H
2SO4 were added) and filling it up to 100 mL.
The working solution of 1 × 10⁻⁴ mol L–1 was prepared by
dilution of the stock solution. The 0.5 mol L–1 SCN– solution
was prepared by dissolving 3.8055 g of NH4SCN in water and filling it up to 100 mL. The 1 × 10⁻³ mol L–1 solution
of DTVTI prepared by its dissolving 0.0391 g in water and filling it up to 100 mL. The acidity of the aqueous phase was adjusted by addition of 0.5 mol L–1 H
2SO4 or 0.2 mol L–1
HOAc-NH4OH buffer solutions.
Apparatus
Spectrophotometric measurements were carried out using a Lightwave II UV/Vis spectrophotometer (Biochrom Ltd., United Kingdom) equipped with quartz cell of appropriate path length. An ORION 720A+ pH meter
with a glass electrode was used for pH measurements. Centrifugation was performed using a CN-2060 LED & Multi-function type centrifuge (MRC Ltd., Israel). NMR spectra were recorded in methanol-d4 at room temperature with a Bruker Avance DRX-500 spectrometer. The
structure of DTVTI was determined by the comprehensive one- and two-dimensional NMR method. Chemical shifts were given on the δ-scale and were referenced to
the solvent (methanol-d4: δ
C = 49.15 and δH = 3.31). In
the 1D measurement (1H, APT), 64 K data points were
used for the FID. The pulse programs for all experiments [gs-COSY, gs-HMQC and gs-HMBC) were taken from the Bruker software library.
Microextraction procedure
Various volumes of Zn(II) working solution (0; 0.3; 0.5; 0.8; 1.0; 1.5; 2.0) were placed into conical centrifugal tubes and followed by the addition of 0.2 mL of 0.5 mol L–1
SCN– and 0.2 mL of 1 × 10⁻³ mol L–1 DTVTI and water
up to 5 mL. After each reagent was added, the mixture was gently shaken. Then 0.5 mL of a mixture of toluene (acting as extraction solvent) and tributylphosphate (acting as donor-active solvent) in a 4:1 (v/v) ratio was rapidly injected into the aqueous phase using a microsyringe; the mixture was then shaken gently a few times. Afterwards, centrifugation was carried out at 3000 rpm for 2 min, and the organic phase at the top of the aqueous phase (approx. 250 µL) was withdrawn using a microsyringe and placed into a quartz cell with optical path of 1 mm for the absorbance measurement at 570 nm.
Sample preparation
The samples of dietary supplements were bought in a local supermarket. The content of samples (except for zinc) was: Sample 1: vitamin C; Sample 2: Ca, Mg; Sample 3: proteins, sugars, fats, vit. B5, vit. B6, vit. B9, vit. D3, biotin, L-cysteine, L-metionine. One or two tablets containing Zn(II) were crushed in a mortar, dissolved in water, exposed to ultrasonication (10-20 min) to obtain a clear solution and filled up to 100 mL in a volumetric flask. The aliquots of the sample were placed to the test tube and determination took place as described inMicroextraction procedure section.
Results and discussion
Investigation of experimental conditions
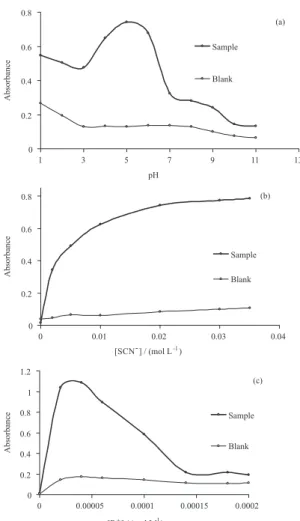
Figure 1a shows the effect of pH on the extraction of the ion pair. The highest absorbance of the extracted ion pair, and simultaneously the lowest absorbance of the blank is observed at pH 5-6. The obvious decrease at lower pH values can be ascribed probably to the formation of HSCN when Zn(NCS)3– is not able to form. On the other side,
decrease in the absorbance values above pH 6 is probably due to the hydrolysis of Zn(NCS)3– and formation of
[Zn(NCS)2(OH)]–, which, due to the loss of SCN– is not
able to form an extractable form with the dye, and thus can not be extracted.
Apart from pH, another important parameter is the optimization of ligand concentration. For this reason, the effect of SCN– concentration up to 0.035 mol L–1 was
investigated. Figure 1b shows that higher concentrations of SCN– ions lead to higher absorbance values up to
0.03 mol L–1. Further addition results in lower absorbance
values, what can be attributed to the formation of complexes of zinc with higher ligand number ([Zn(NCS)4]2–) that are
non extractable. Thus, the concentration of 0.02 mol L–1
of NH4SCNwas chosen.
The effect of the dye reagent was also investigated up to 2 × 10⁻⁴ mol L–1 and absorbance increased to the
concentration 4 × 10⁻⁵-6 × 10⁻⁵ mol L–1. Further addition
of the dye resulted in the association of the molecule of the dye as the effect of SCN– ions, thus the concentration of
the dimer form of the dye increases, what in consequence, leads to the decrease in concentration of the reactive form of the dye as Figure 1c shows. Thus, a concentration of the dye reagent as high as 4 × 10⁻⁵ mol L–1 were selected for
further experiments.
Effect of the organic solvent
Besides the above-mentioned variables, the nature of the organic solvent used can also significantly influence the extraction efficiency. The nature of the analyte has an equally important influence. Some metal ions (M), zinc among them, are able to form coordinatively saturated complexes only in the presence of a relatively high concentration of ligand, such as, for example, SCN– when
the [M(NCS)4]2– complex is formed. These complexes
cannot be extracted in the form of ion associates with dye reagents by using organic solvents. In contrast, at lower concentrations of ligand, only a hydrated coordinatively unsaturated complex [M(NCS)3 × H2O]– is formed which
can not be extracted by inert solvents due to the presence of water. Nevertheless, such an extraction can be done easily with the use of donor-active solvents that have the ability to block or push water away from the ion associate, like, for example, tributylphosphate or cyclohexanone.
These solvents must fulfill certain requirements, namely a low dielectric constant and better solubility in inert solvent than in water (tributylphospate with its Gutmann’s donor-activity is 23.7 kcal mol–1 and dielectric constant
6.8). Unfortunately, application of donor-active solvent itself causes an unfavorable increase in the absorbance of the blank test, and there is no difference between the blank and the sample absorbance. This means that both inert and active solvents are themselves inapplicable for the extraction of ion associates formed by coordinatively unsaturated complex and dye reagents. In this case, a mixture of inert (toluene, benzene, hexane, carbon tetrachloride) and active (esters-butylacetate, amylacetate, tributylphosphate, and ketones-cyclohexanone, methyl isobutyl ketone) solvents is commonly employed. The addition of only small amount of donor-active solvent to an inert solvent can act synergistically by increasing the extraction efficiency while at the same time not affecting the value of blank test. Synergism is well known and often applied in extractive spectrophotometric methods and can
Figure 1. Effect of pH (a), thiocyanate (b) and DTVTI (c). 4 × 10⁻⁵ mol L-1 Zn; toluene-tributylphosphate 4:1 (v/v); Vaq = 5 mL, Vorg = 500 µL; λ = 570 nm; l = 0.1 cm; (a) 0.02 mol L–1 NH
4SCN and 8 × 10⁻⁵ mol L–1 DTVTI; (b) 8 × 10⁻⁵ mol L–1 DTVTI; (c) 0.02 mol L–1 NH
be achieved, for example, by the addition of another ligand or reagent23,24 as well as by the addition of another solvent.25
Therefore, besides the solvent itself (carbon tetrachloride, benzene, toluene, xylene, amyl acetate, butyl acetate), mixtures of various extraction solvents with tributylphosphate and mixtures of toluene with various improvers (ethanol, methanol, acetonitrile, tetrahydrofuran, cyclohexanone, tributylphosphate) were tested (Figure 2). As could be expected, the extraction solvent by itself is only capable of extracting the ion associate slightly. The best result (the highest value of the analytical signal and simultaneous lowest value of the blank) was obtained using a mixture of toluene and tributylphosphate in a 4:1 v/v ratio (Figure 2). Therefore, this mixture was chosen for further experiments. Tributylphosphate serves as a donor-active solvent since it is able to push the molecules of water away from the coordination sphere of the complex (see Reaction chemistry Section and reference 26), thus enhancing the extraction efficiency. Tributylphosphate participates in the solvation of the unsaturated anionic complex typical for an extraction based on the hydration-solvation mechanism.27
Reaction chemistry
On the basis of 1H NMR, APT, HMQC and COSY
spectra, we were able to identify the N-methyl, geminal
C-methyls, geminal N-methyls 1,2-disubstituted benzene ring, the thienyl ring and the –CH=CH– group of the molecule of DTVTI reagent (Figure 3). We used the HMBC spectrum to confirm the connection of the sub-units of the DTVTI compound.
The N-methyl signal (δ
H = 3.655 ppm) and the geminal
methyl signal (δ
H = 1.72 ppm) show cross-peaks with the
signal at δ
C = 176.3 ppm, proving the indole-2 position of the
quaternary carbon atom. The signal at δ
C = 50.9 ppm (C-3) is
marked out by the signals at δ
H = 7.50 ppm and 6.125 ppm,
thus verifying the connection of the 1,2-disubstituted benzene ring and the –CH=CH– group. The 8.305 ppm/149.4 ppm, 6.62 ppm/175.6 ppm and 3.38 ppm/175.6 ppm HMBC correlation justify the existence of the dimethylaminothienyl group in the molecule.
One of the fundamental steps in the extraction of zinc ion associate is the formation of a complex between the Zn2+ and NCS–. It is well known that thiocyanate and
isothiocyanate ions are linear in structure, which is why the distribution of the negative charge on them is approximately equal between the S and the N atoms (QS = –0.48, QN = –0.51).28 It is also well known that with Pearson’s
“hard acid” metal ions, the ambidentate SCN– anion binds
at the N atom of the thiocyanate to form the complex, while in the case of Pearson’s “soft acid” metal ions it binds at the S atom. Zn(II) is a borderline case as a Pearson’s borderline Lewis acid,29,30 but according to Klopman’s
hardness scale for complex compounds, it belongs among the “hard acid” metal ions (for example Zn(II) is –0.60 and Hg(II) is –4.40).30,31 This has also been confirmed by a
large number of spectrochemical measurements28 in which
complex formation of Zn2+ with NCS– in aqueous solution
takes place with binding at the N atom.
Therefore, in our opinion, the formation and extraction of the ion associate may be expressed by the following scheme:
Zn2+
(aq) + 3NCS– (aq) + H2O [Zn(NCS)3 × H2O]– (aq)
[Zn(NCS)3 × H2O]–(aq) + R+(aq) + TBP(org) + nT(org)
[Zn(NCS)3 × TBP]–R+ × nT
(org) + H2O
where aq and org mean the aqueous and organic phases, respectively, and R is DTVTI reagent, TBP is tributylphosphate, and T stands for toluene.
Matrix effect
The matrix effect was studied by spiking commercially available mineral waters and juices with Zn(II) at different
Figure 2. Effect of the solvents. 4 × 10⁻⁵ mol L–1 Zn; 0.02 mol L–1
NH4SCN; 4 × 10⁻⁵ mol L–1 DTVTI; Vaq = 5 mL, Vorg = 500 µL; λ = 570 nm;
l = 0.1 cm; B: benzene; T: toluene; X: xylene; AA: amyl acetate; BA: butyl acetate; TBP: tributylphosphate; EtOH: ethanol; MeOH: methanol; ACN: acetonitrile; THF: tetrahydrofuran; CHN: cyclohexanone.
Figure 3. The structure and 1H and 13C NMR signal assignments of
concentration levels and analysing them using the suggested procedure. The results obtained showed good precision and accuracy of the determination, with no matrix interference (RSD values ranging from 1.5 to 4.2% and recoveries ranging from 98 to 102%).
Analytical performance
Applying the optimized experimental conditions, a calibration plot was constructed using five concentration levels up to 2.62 mg L–1 Zn. For each level, three
replicate extractions and determinations were carried out. The regression equation for the calibration curve was A = 0.422C + 0.0934, where A is the absorbance and C is the concentration of Zn(II) in mg L–1 . The experimental results
showed a good linear relationship between absorbance and the zinc concentration, with a correlation coefficient (R2) of
0.9944. The limit of detection calculated from the regression equation according to the International Conference on Harmonization,32 using the standard deviation of the blank
samples was found to be 0.099 mg L–1. The suggested
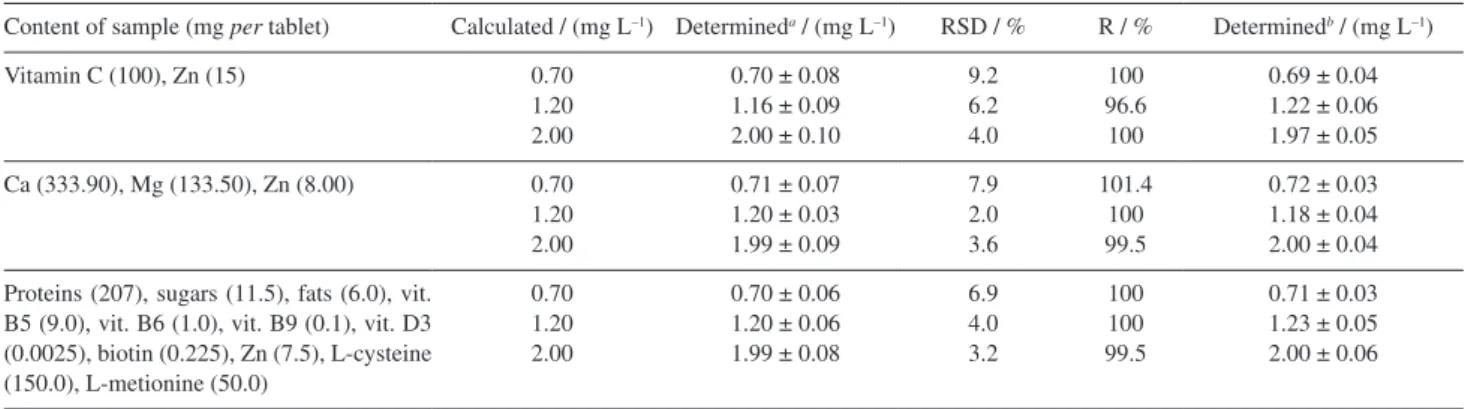
method was applied to the analysis of dietary supplements and results were compared with the reference method (ICP-OES, 213.856 nm). Five replicate analyses were performed for each sample. Satisfactory results were obtained, with recoveries ranging from 96.6 to 101.4%, therefore, indicating that the sample matrix does not significantly influence the determination. The relative standard deviation (RSD) values range from 2.0 to 9.2% (Table 1).
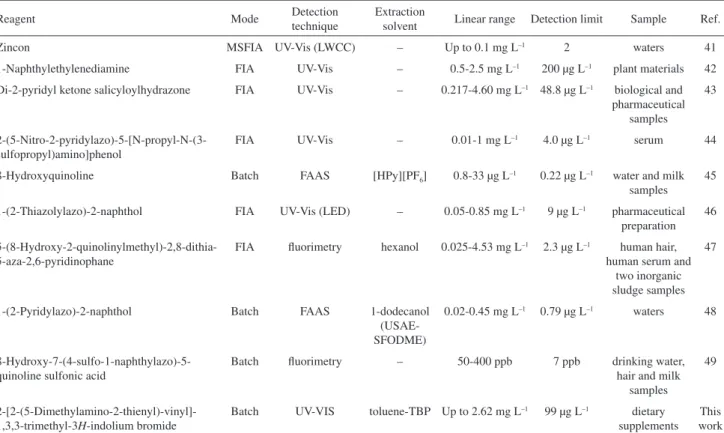
The efficiency of the presented method was compared with those of other reported methods (Table 2), and it can be observed that the analytical performance of the developed donor-active solvent-assisted liquid-phase microextraction (DAS-LPME) method is comparable with the other reported methods based on spectrophotometric detection. It should be noted that in some of the techniques mentioned, detection systems such as flame atomic absorption spectrometry, long liquid waveguide capillary cell and spectrofluorimetry were used which are essentially more sensitive than spectrophotometry.
Table 2. A comparison of the suggested method with other methods reported in literature for determination of zinc
Reagent Mode Detection
technique
Extraction
solvent Linear range Detection limit Sample Ref.
Zincon FIA UV-Vis – 0.2-9.7 mg L–1 60 µg L–1 vitamin
formulations 33
Zincon FIA UV-Vis – 0.2-9.7 mg L–1 60 µg L–1 pharmaceutical
preparations 34
4-(2-Thiazolylazo) resorcinol Batch UV-Vis – 0.10-1.31 mg L–1 – water samples 35
2,6-bis(1-Hydroxy-2-naphthylazo)pyridine Batch UV-Vis – 0.19-1.0 mg L–1 – food and milk samples
36
N -ethyl-3-carbazolecarboxaldehyde-3-thiosemicarbazone
Batch UV-Vis Benzene 0.4-6.0 mg L–1 – foods 37
1-(2-Pyridylazo)2-naphthol Batch UV-Vis (HPSAM) – 0.2-25 mg L–1 – alloys 38 2,4-Dihydroxybenzaldehyde isonicotinoyl
hydrazone
Batch UV-Vis (DS) – 0.10-1.50 mg L–1 – waters and pharmaceuticals
39
Zincon Sensor UV-Vis – 0.76-30.6 µmol L–1 10.5 µg L–1 powdered milk and hair samples
40
Table 1. Determination of zinc in dietary supplements by the proposed methodaand by the reference methodb (n = 5)
Content of sample (mg per tablet) Calculated / (mg L–1) Determineda / (mg L–1) RSD / % R / % Determinedb / (mg L–1) Vitamin C (100), Zn (15) 0.70
1.20 2.00
0.70 ± 0.08 1.16 ± 0.09 2.00 ± 0.10
9.2 6.2 4.0
100 96.6 100
0.69 ± 0.04 1.22 ± 0.06 1.97 ± 0.05
Ca (333.90), Mg (133.50), Zn (8.00) 0.70 1.20 2.00
0.71 ± 0.07 1.20 ± 0.03 1.99 ± 0.09
7.9 2.0 3.6
101.4 100 99.5
0.72 ± 0.03 1.18 ± 0.04 2.00 ± 0.04
Proteins (207), sugars (11.5), fats (6.0), vit. B5 (9.0), vit. B6 (1.0), vit. B9 (0.1), vit. D3 (0.0025), biotin (0.225), Zn (7.5), L-cysteine (150.0), L-metionine (50.0)
0.70 1.20 2.00
0.70 ± 0.06 1.20 ± 0.06 1.99 ± 0.08
6.9 4.0 3.2
100 100 99.5
Conclusions
A donor-active solvent-assisted liquid-phase microextraction procedure followed by spectrophotometric determination of zinc was developed. The method is based on the ion associate formation between Zn(II), thiocyanate and 2-[2-(5-dimethylamino-thiophen-2-yl)-vinyl]-1,3,3-trimethyl-3H-indolium bromide (DTVTI) reagent which is extractable by the mixtures of toluene and tributylphosphate. Considering the results, the developed procedure proved to be rapid, sensitive, efficient, reliable and easy to use for the determination of zinc.
Supplementary information
Supplementary spectrum (1H NMR spectrum of
DTVTI) is available free of charge at http://jbcs.sbq.org.br as PDF file.
Acknowledgements
This work has been supported by the Scientific Grant Agency of the Ministry of Education of the Slovak
Republic and the Slovak Academy of Sciences (Grant No. 1/1096/12).
References
1. Roberts, E. A.; Gastroenterology2011, 140, 1132.
2. Auld, D. S.; BioMetals2001, 14, 271.
3. Garole, D. J.; Garole, V. J.; Int. J. Chem. Tech. Res.2012, 4, 377.
4. García-Rico, L.; Leyva-Perez, J.; Jara-Marini, M. E.; Food Chem. Toxicol.2007, 45, 1599.
5. Anthemidis, A. N.; Ioannou, K. I. G.; Talanta 2009, 80, 413. 6. Rezaee, M.; Yamini, Y.; Faraji, M.; J. Chromatogr. A.2010,
1217, 2342.
7. Ojeda, C. B.; Rojas, F. S.; Chromatographia2009, 69, 1149.
8. Ojeda, C. B.; Rojas, F. S.; Chromatographia2011, 74, 651. 9. Andruch, V.; Balogh, I. S.; Kocúrová, L.; Šandrejová, J.; Appl.
Spectrosc. Rev.2013, 48, 161.
10. Andruch, V.; Balogh, I. S.; Kocúrová, L.; Šandrejová, J.; J. Anal. At. Spectrom.2013, 28, 19.
11. Andruch, V., Kocúrová, L.; Balogh, I. S.; Škrlíková, J.;
Microchem. J.2012, 102, 1.
12. Maya, F.; Horstkotte, B.; Estela, J. M.; Cerda, V.; Anal. Bioanal. Chem. 2012, 404, 909.
Reagent Mode Detection technique Extraction solvent Linear range Detection limit Sample Ref.
Zincon MSFIA UV-Vis (LWCC) – Up to 0.1 mg L–1 2 waters 41
1-Naphthylethylenediamine FIA UV-Vis – 0.5-2.5 mg L–1 200 µg L–1 plant materials 42 Di-2-pyridyl ketone salicyloylhydrazone FIA UV-Vis – 0.217-4.60 mg L–1 48.8 µg L–1 biological and
pharmaceutical samples
43
2-(5-Nitro-2-pyridylazo)-5-[N-propyl-N-(3-sulfopropyl)amino]phenol
FIA UV-Vis – 0.01-1 mg L–1 4.0 µg L–1 serum 44
8-Hydroxyquinoline Batch FAAS [HPy][PF6] 0.8-33 µg L–1 0.22 µg L–1 water and milk samples
45
1-(2-Thiazolylazo)-2-naphthol FIA UV-Vis (LED) – 0.05-0.85 mg L–1 9 µg L–1 pharmaceutical preparation
46
5-(8-Hydroxy-2-quinolinylmethyl)-2,8-dithia-5-aza-2,6-pyridinophane
FIA fluorimetry hexanol 0.025-4.53 mg L–1 2.3 µg L–1 human hair, human serum and
two inorganic sludge samples
47
1-(2-Pyridylazo)-2-naphthol Batch FAAS 1-dodecanol (USAE-SFODME)
0.02-0.45 mg L–1 0.79 µg L–1 waters 48
8-Hydroxy-7-(4-sulfo-1-naphthylazo)-5-quinoline sulfonic acid
Batch fluorimetry – 50-400 ppb 7 ppb drinking water, hair and milk
samples 49
2-[2-(5-Dimethylamino-2-thienyl)-vinyl]-1,3,3-trimethyl-3H-indolium bromide
Batch UV-VIS toluene-TBP Up to 2.62 mg L–1 99 µg L–1 dietary supplements
This work DS: derivative spectrophotometry; FAAS: flame atomic absorption spectrometry; FIA: flow injection analysis; HPSAM: H-point standard addition method; [HPy][PF6]: 1-Hexylpyridinium hexafluorophosphate; LED: light-emitting diode based photometer for solid phase photometry; LWCC: long liquid waveguide capillary cell; MSFIA: multi-syringe flow injection analysis; USAE-SFODME: ultrasound-assisted emulsification solidified floating organic drop microextraction.
13. Vidotti, E. C.; Almeida, V. C.; Oliveira, C. C.; Talanta2004,
64, 993.
14. Páscoa, R. N. M. J.; Tóth, I. V.; Rangel, A. O. S. S.; Anal. Chim. Acta2012, 739, 1.
15. Pinto, J. J.; García-Vargas, M.; Moreno, C.; Anal. Meth.2012,
4, 147.
16. Prasad, R. T.; Reddy, M. L. P.; Pillai, R. A.; Talanta1998, 46,
765.
17. Abdolmohammad-Zadeh, H.; Sadeghi, G. H.; Anal. Chim. Acta 2009, 649, 211.
18. Ranjbar, L.; Yamini, Y.; Saleh, A.; Seidi, S.; Faraji, M.;
Microchim. Acta2012, 1, 1.
19. Zeeb, M.; Sadeghi, M.; Microchim. Acta2011, 175, 159. 20. Kocúrová, L.; Balogh, I. S.; Škrlíková, J.; Posta, J.; Andruch, V.;
Talanta2010, 82, 1958.
21. Škrlíková, J.; Andruch, V.; Balogh, I. S.; Kocúrová, L.; Nagy, L.; Bazeľ, Y.; Microchem. J.2011, 99, 40.
22. Burger, K.; Solvation, Ionic and Complex Formation Reactions in Non-Aqueous Solvents. Experimental Methods for Their Investigation, Akadémiai Kiadó: Budapest, 1983.
23. Kamble, G. S.; Kolekar, S. S.; Anuse, M. A.; Spectrochim. Acta A2011, 78, 1466.
24. Kamble, G. S.; Kolekar, S. S.; Han, S. H.; Anuse, M. A.; Talanta 2010, 81, 1088.
25. Shkumbatiuk, R.; Bazel, Y. R.; Andruch, V.; Torok, M.; Anal. Bioanal. Chem.2005, 382, 1431.
26. Kish, P. P.; Balogh, I. S.; Spivakov, B. Y.; Zolotov, Y. A.; J. Anal. Chem.1976, 31,1114.
27. Zolotov, Y. A.; Iofa, B. Z.; Chuchalin, L. K.; Extraction of Metal Halide Complexes, Nauka: Moscow, 1973.
28. Golub, A. M.; Kohler, H.; Skopenko, V. V. In Chemistry of Pseudohalides; Golub, A. M.; Kohler, H.; Skopenko, V. V., eds.; Elsevier: Amsterdam, 1986.
29. Pearson, R. G.; J. Am. Chem. Soc.1963, 85, 3533.
30. Alimarin, I. P.; Bagrejev, V. V. In Theory and Practice of Extraction Methods;Nauka: Moscow, 1985.
31. Klopman, G.; J. Am. Chem. Soc.1968, 90, 223.
32. International Conference on Harmonization (ICH); Validation of Analytical Procedures: Methodology. Q2 (R1); (1997). 33. Shpigun, L. K.; Shushenachev, Ya. V.; Kamilova, P. M.; Anal.
Chim. Acta2006, 573-574, 360.
34. Shpigun, L. K.; Shushenachev, Ya. V.; Kamilova, P. M.; J. Anal. Chem.2007, 62, 623.
35. Ghasemi, J. B.; Hashemi, B.; Environ. Monit. Assess.2011,
183, 57.
36. Sharma, A. K.; Singh, I.; Food Anal. Meth.2009, 2, 311. 37. Reddy, K. J.; Kumar, J. R.; Ramachandraiah, C.; Thriveni, T.;
Reddy, A. V.; Food Chem.2007, 101, 585.
38. Arvand, M.; Abolghasemi, S.; Zanjanchi, M. A.; J. Anal. Chem. 2007, 62, 342.
39. Sivaramaiah, S.; Reddy, P. R.; J. Anal. Chem.2005, 60, 828.
40. Rastegarzadeh, S.; Rezaei, V.; Sens. Actuators, B.2008, 129, 327.
41. Páscoa, R. N. M. J.; Tóth, I. V.; Rangel, A. O. S. S.; Talanta 2011, 84, 1267.
42. Dias, A. C. B.; Carneiro, J. M. T.; Zagatto, E. A. G.; Talanta 2004, 63, 245.
43. Gaubeur, I.; Ávila-Terra, L. H. S.; Masini, J. C.; Suárez-Iha, M. E. V.; Anal. Sci. 2007, 23 1227.
44. Teshima, N.; Gotoh, S.; Ida, K.; Sakai, T.; Anal. Chim. Acta 2006, 55, 387.
45. Abdolmohammad-Zadeh, H.; Sadeghi, G. H.; Anal. Chim. Acta 2009, 649, 211.
46. Dias, T. R.; Reis, B. F.; J. Braz. Chem. Soc. 2012, 23, 1514. 47. Shamsipur, M.; Zahedi, M. M.; De Filippo, D.; Lippolis, V.;
Talanta 2011, 85, 687.
48. Ma, J.; Zhang, J.; Du, X.; Lei, X.; Li, J.; Microchim. Acta 2010, 168, 153.
49. Al-Kindy, S. M. Z.; Al-Bulushi, S. T.; Suliman, F. E. O.;
Spectrochim. Acta A2008, 71, 676.