Artigo
*e-mail: faria@ iq.ufrj.br
PHASE DIAGRAM AND COMPLEX PATTERNS IN THE MODELING OF THE BROMATE–OXALIC ACID–Ce– ACETONE OSCILLATING REACTION
Janaina A. M. Pereira e Roberto B. Faria*
Departamento de Química Inorgânica, Instituto de Química, Universidade Federal do Rio de Janeiro, CP 68563, 21945-970 Rio de Janeiro – RJ, Brasil
Recebido em 23/1/06; aceito em 3/7/06; publicado na web em 7/2/07
Simulations have been carried out on the bromate – oxalic acid – Ce(IV) – acetone oscillating reaction, under flow conditions, using Field and Boyd’s model (J. Phys. Chem.1985, 89, 3707). Many different complex dynamic behaviors were found, including simple periodic oscillations, complex periodic oscillations, quasiperiodicity and chaos. Some of these complex oscillations can be understood as belonging to a Farey sequence. The many different behaviors were systematized in a phase diagram which shows that some regions of complex patterns were nested with one inside the other. The existence of almost all known dynamic behavior for this system allows the suggestion that it can be used as a model for some very complex phenomena that occur in biological systems.
Keywords: oscillating reactions; Farey sequences; mixed-mode oscillations.
INTRODUCTION
Particularly after the 1968 Prague conference on Biological and Biochemical Oscillators1, chemical oscillating systems have attracted
much attention. Although the first homogeneous chemical oscillating system had been discovered as early as 19212, it was the
discovery of metabolic oscillations, the knowledge of circadian rhythms, as well as their theoretical foundation by thermodynamics3-5,
which led to an increased interest in this field. The systems far from equilibrium, such as dissipative structures, chemical oscillations or those exhibiting non-equilibrium phase transitions and other non-linear phenomena, represent interesting and fascinating analogies to biological systems.
Among the various chemical oscillating systems, the Belousov– Zhabotinsky (BZ) reaction is one of the most thoroughly investigated6,7. The classical BZ reaction is the metal ion catalyzed
oxidation and bromination of an organic substrate by bromate ion in acidic solutions8-14. This reaction has attracted researches for
more than three decades, and even in closed systems, a variety of unusual complex behaviors can be observed, that are normally expected to be found in biological systems15-17. Such behaviors
include concentration oscillations of reaction intermediates18,
traveling waves19-22, excitability23,24, and concentration oscillation
of biologically significant ions25. Chemical chaos26 was first
observed in BZ systems running in CSTRs27-29, and the phenomenon
is now widely studied by a variety of groups employing many different chemical systems30.
The bromate–oxalic acid–Ce–sulfuric acid system is one of the Belousov–Zhabotinsky (BZ)6,7 type oscillators. The oscillatory
behavior of this system was observed, under batch conditions, when the bubbling of an inert gas or the presence of a ketone was used to remove bromine produced during the reaction course31-41. This can
be accomplished also by using a CSTR arrangement as the liquid flow can remove the produced bromine42.
Several mechanistic models have been proposed in an attempt to explain the dynamic behavior of the oscillating reactions. The theoretical analysis practically started with Lotka43, in 1910, with
a very simple model, constituted by three reactions being one of them autocatalytic. Specifically in the BZ system case, Field, Körös and Noyes (FKN)44 proposed, in 1972, a detailed mechanism for
the BZ reaction with malonic acid as the organic substrate. The FKN mechanism has been successful in rationalizing10,45 many
observed behaviors of the BZ reaction and of various bromate-ion-driven oscillators46,47 derived from it. More recently Györgyi,
Turányi and Field48 developed a mechanism composed of 80
elementary reactions and 26 intermediates also for the BZ system with malonic acid. Mechanistic proposals considering the oxygen effect on the same system were described in the Treindl, Ruoff and Kvernberg49 and Petrascu, Koch and Försterling’s50 works.
For the BZ system with oxalic acid, a radical mechanism, involving Br2, was suggested by Noszticzius and Bódiss32 to explain
the experimental results obtained in the system bromate – Ce(IV) – oxalic acid – sulfuric acid, under batch conditions. Hlaváčová and Ševčík51 produced a mechanism for the system with manganese as
catalyst. A detailed simulation work was carried out by Zhang and Field52 for the heterogeneous oscillating system BrO
3– – Mn(III)/
Mn(II) – H3PO2– H2SO4, in which ionic and radical mechanisms were proposed. More recently Pelle et al.53 produced a completely
revised mechanism for the system bromate – Ce(IV) – oxalic acid – sulfuric acid based on several new experimental results. A detailed mechanistic model for the system bromate – Ce(IV) – oxalic acid – acetone – sulfuric acid, based on the FKN mechanism44, was
developed by Field and Boyd31. This model is composed of 23
elementary reactions, 9 of which reversible, 15 independent species and is until now the most complete mechanism for a BZ system containing oxalic acid as organic substrate in presence of acetone.
Some oscillating reactions, in addition to the oscillating behavior which give them their name, can show complex oscillations. These complex oscillations were shown to exist for the BZ reaction by Mase³ko and Swinney54. These complex oscillations combine low
and high amplitude oscillations in repetitive sequences which are called mixed-mode oscillations (MMO) which can be rationalized using Farey aritmetic. Since then several experimental and modeling works have shown MMO in different systems as, for example, the modeling work of Kim, Shin, and Lee55for the Briggs-Rauscher
In this work we present extensive modeling results for the title system using the Field and Boyd31 model. Our results show that this
model presents different kind of complex oscillations depending on the region of the phase diagram acetone × bromate. The richness found in this system put it between the most promising to be employed to mimic complex biological dynamics phenomena.
SIMULATION METHOD
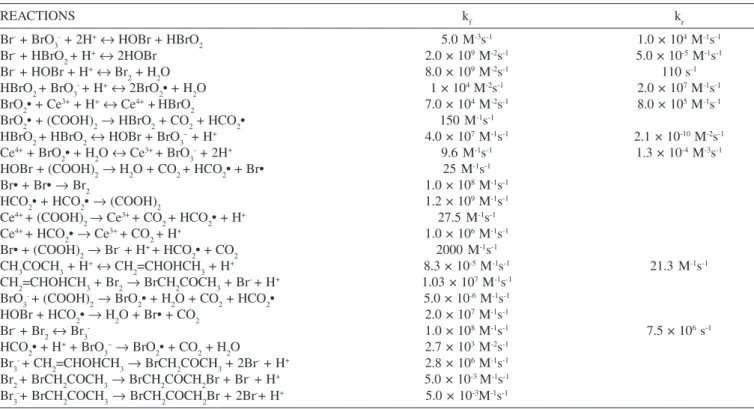
To model the bromate-oxalic acid-Ce-acetone-sulfuric acid oscillating reaction, we employed the Field and Boyd model31,
eliminating the reaction 19 which does not contribute for the results (see Table 1). The open-flow conditions were established by the addition of flow terms to the differential equations. All calculations were performed using a Pentium 200 MHz and a AMD K6-III 450 MHz PC compatible computers and a program written by Dr. István Lengyel in Turbo Pascal 6.0 to solve autonomous ordinary differential equation systems by a semiimplicit Runge-Kutta method56. To obtain
the patterns shown in this work the tolerance of the integrator have to be adjusted to a low value, typically 1 × 10⁻³, and the parameter
set GRK4A was used56. If a higher tolerance value was used, for
example 1 × 10⁻², some patterns were missed and other modified.
Tolerance lower than 1 × 10⁻³ did not produced new patterns but
only slowed down the calculations. Changing the parameter set to GRK4T affected by small quantities the concentrations of bromate and acetone were each pattern appear but did not change the patterns themselves nor the sequence in which they appear. As this set makes the calculations slower we used the first one.
To obtain the detailed phase diagram and the different pattern of oscillations presented here we used the same strategy used by Kim, Shin, and Lee55, i.e., inspecting the time series looking for
transitions from steady states to oscillations and from one pattern of oscillation to another. This is because a mechanism as big as the one we investigate here does not allow the use of an analytical continuation methods as the AUTO program used by Olsen and Epstein57, for example.
Following the HOBr, Br-, Br
3-, Br2 and Ce(IV) concentrations,
different oscillation regions were mapped, which allowed the construction of bromate × acetone phase diagram. To build this phase diagrams we collected the acetone and bromate concentrations for which the patterns of computed concentrations (usually Br- and
HOBr) have shown some significant change.
The fixed conditions used in all calculations were: [H2C2O4]0 = 3 × 10⁻² M; [Ce(IV)]
0 = 5 × 10⁻⁴ M; [H+] = 1.0 M; and k0 = 5 × 10⁻³
s-1. These concentrations were the same employed by Field and
Boyd31 to observe oscillations in batch for the title system. The k 0
value which we used is a common flow rate which was employed, for example, in the Minimum Bromate oscillator58.
RESULTS AND DISCUSSION
The simulations performed for the system bromate–oxalic acid– Ce–acetone–sulfuric acid revealed a striking wealth of dynamic behaviors until now not described for this system under an open-flow regime. These behaviors include simple periodic oscillations, complex periodic oscillations and chaos. The range of concentrations in which each behavior is observed is better shown by a phase diagram like that shown in Figure 1. This [bromate]0 × [acetone]0 phase diagram describes the different dynamic behavior of the system for each bromate and acetone concentration used in the inflow solution of the reagents.
The phase diagram shown in Figure 1 presents the limits of three broad regions in which oscillations are observed (HAO, LAO, and SS/LAO) and two stead state regions (SSI and SSII). The steady state, SSI presents lower concentration of the monitored intermediates (for example, Br–) than SSII. The separation line between SSI and SSII
was followed from [acetone]0 = 0.395 M and [bromate]0 = 0.06 M (not shown) until [acetone]0 = 0.233 M and [bromate]0 = 0.02 M. For still lower acetone and bromate concentrations the transition between these steady states becomes too flat to be detected.
In the regions labeled HAO and LAO the system show high-am-plitude and low-amhigh-am-plitude oscillations, respectively. In the region
Table 1. Field and boyd model employed
REACTIONS kf kr
Br- + BrO
3- + 2H+↔ HOBr + HBrO2 5.0 M-3s-1 1.0 × 10⁴ M-1s-1
Br- + HBrO
2 + H+↔ 2HOBr 2.0 × 10⁹ M-2s-1 5.0 × 10⁻⁵ M-1s-1
Br- + HOBr + H+↔ Br
2 + H2O 8.0 × 10⁹ M-2s-1 110 s-1
HBrO2 + BrO3- + H+↔ 2BrO
2• + H2O 1 × 10⁴ M-2s-1 2.0 × 10⁷ M-1s-1
BrO2• + Ce3+ + H+↔ Ce4+ +HBrO
2 7.0 × 10⁴ M-2s-1 8.0 × 10⁵ M-1s-1
BrO2• + (COOH)2→ HBrO
2 + CO2 + HCO2• 150 M-1s-1
HBrO2 + HBrO2↔ HOBr + BrO
3– + H+ 4.0 × 10⁷ M-1s-1 2.1 × 10⁻¹⁰ M-2s-1
Ce4+ + BrO
2• + H2O ↔ Ce3+ + BrO3- + 2H+ 9.6 M-1s-1 1.3 × 10⁻⁴ M-3s-1
HOBr + (COOH)2→ H
2O + CO2 + HCO2• + Br• 25 M-1s-1
Br• + Br• → Br
2 1.0 × 10⁸ M-1s-1
HCO2• + HCO2• → (COOH)
2 1.2 × 10⁹ M-1s-1
Ce4+ + (COOH)
2 → Ce3+ + CO2 + HCO2• + H+ 27.5 M-1s-1
Ce4+ + HCO
2• → Ce3+ + CO2 + H+ 1.0 × 10⁶ M-1s-1
Br• + (COOH)2→ Br- + H+ + HCO
2• + CO2 2000 M-1s-1
CH3COCH3 + H+↔ CH
2=CHOHCH3 + H+ 8.3 × 10⁻⁵ M-1s-1 21.3 M-1s-1
CH2=CHOHCH3 + Br2→ BrCH
2COCH3 + Br- + H+ 1.03 × 10⁷ M-1s-1
BrO3- + (COOH)
2→ BrO2• + H2O + CO2 + HCO2• 5.0 × 10⁻⁶ M-1s-1
HOBr + HCO2• → H
2O + Br• + CO2 2.0 × 10⁷ M-1s-1
Br- + Br
2↔ Br3- 1.0 × 10⁸ M-1s-1 7.5 × 10⁶ s-1
HCO2• + H+ + BrO
3–→ BrO2• + CO2 + H2O 2.7 × 10³ M-2s-1
Br3- + CH
2=CHOHCH3→ BrCH2COCH3 + 2Br- + H+ 2.8 × 10⁶ M-1s-1
Br2 + BrCH2COCH3→ BrCH
2COCH2Br + Br- + H+ 5.0 × 10⁻³ M-1s-1
Br3-+ BrCH
indicated by SS/LAO, which occurs at low initial concentrations of bromate and acetone, the system exhibits hysteresis between a steady state and low-amplitude oscillations. The limits of this region show different dynamic properties. The continuous line (at left) indicates the limit of periodic behavior and the dashed line (at right) indicates a subcritical Hopf bifurcations30. It means that starting in the HAO
region at [acetone]0≈ 0.05 M and decreasing [bromate]
0, the
amplitu-de of oscillations will amplitu-decrease until the continuous line is reached, when the system will be in a steady state. Then, increasing again the bromate concentration, the system will stay in a steady state until the dashed line is reached, when the oscillations will start abruptly (subcritical Hopf bifurcation). The dotted line in Figure 1 indicates a canard-like behavior line59,60 in which the system changes drastically
the oscillation amplitude as can be seen in Figure 2. Classification of this phenomena as a canard explosion requires investigation of the presence of hysteresis and excitation. As this was not done in detail, we prefer indicate this as a canard-like behavior based only in the sudden change of the oscillations amplitude.
The picture shown in Figure 1 is a simplified view of the acetone × bromate phase diagram. There are many other small regions which cannot be shown using this scale. At acetone concentration of 0.175
M and bromate concentration higher than 0.0430 M, inside the LAO region, the system oscillates in a low-amplitude mode as in the left hand side of Figure 2. Keeping the acetone concentration constant and decreasing bromate concentration to 0.0420 M, the system starts to show a period-2 low-amplitude oscillation pattern, as shown in Figure 3. This pattern occurs until the bromate concentration is 0.0407 M, showing that this region is rather small. At bromate concentrations below 0.0407 M the system is back to a simple pattern of low-amplitude oscillations until the canard-like line is attained at [bromate]0 = 0.04055 M.
This behavior is better understood taking a closer look of the phase diagram as it is shown in Figure 4. As can be seen, there is a period-2 low-amplitude oscillation region between the LAO and HAO regions. This region ends for acetone concentrations below 0.168 M.
Very close to the frontier that separates LAO and HAO, at [bromate]0 approximately 0.040 M and indicated by thick continuous line in Figure 4, many different complex patterns were found. This very thin region starts at [acetone]0 equal to 0,160 M and goes until [acetone]0 equal to 0.190 M (indicated by the “1n to
n1 ” label - this thick line is shown only until [acetone]
0 = 0.174 M
to not get over the other lines in Figure 4). Let us start inside the LAO region at [acetone]0 = 0.165 M. Decreasing bromate concentration the low-amplitude oscillations change to the pattern shown in Figure 5 at [bromate]0 = 0.040458 M. This can be called a 19 oscillation (the Ls notation indicates a repeated pattern with L large-amplitude oscillations and s small-amplitude oscillations54). At still lower [bromate]0 patterns like 13 and 12, with a lower number
Figure 1. Acetone × bromate phase diagram. Fixed constraints: [H+] 0 = 1 M;
[oxalic acid]0 = 0.03 M; [Ce(IV)]0 = 5 × 10⁻⁴ M, k
0 = 0.005 s
-1. HAO =
high-amplitude oscillations; LAO = low-high-amplitude oscillations; SS/LAO = hysteresis between steady state and low-amplitude oscillations; SSI and SSII are two steady states (SSI has lower bromide concentration than SSII); (—) supercritical Hopf bifurcation; (---) subcritical Hopf bifurcation; (...) canard-like behavior
Figure 2. Canard-like behavior. Fixed constraints: [H+]
0 = 1 M; [acetone]0
= 0.175 M; [oxalic acid]0 = 0.03 M; [Ce(IV)]0 = 5 × 10 -4 M, k
0 = 0.005 s -1.
The arrow indicates the time when bromate concentration was changed from 0.04060 M to 0.04055 M
Figure3. Period-2 low-amplitude oscillations. Fixed constraints: [H+] 0 = 1
M; [BrO3 -]
0 = 0.0410 M; [acetone]0 = 0.175 M; [oxalic acid]0 = 0.03 M;
[Ce(IV)]0 = 5 × 10 -4 M, k
0 = 0.005 s -1
of small-amplitude oscillations, were found. Keeping decreasing [bromate]0 other patterns were found in the sequence: (11)212 (a
sequence of two 11 followed by a 12 and repeated again), 21(11)3
(see Figure 6a), and 11(21)2. Note that the relative number of
small-amplitude oscillations to large-small-amplitude oscillations is decreasing as [bromate]0 decreases. At still lower [bromate]0 the large-ampli-tude oscillations predominates and patterns 21, 31, and 61 were found
(see Figure 6b).
These complex oscillating patterns were systematized by Masełko and Swinney54 using the Farey arithmetic by which each
oscillating pattern Ls is represented by a rational number p/q (which is called a firing number, F) where p is the number of small ampli-tude oscillation and q is the total number of oscillation (L + s). In this way, two parents patterns p1/q1 and p2/q2 can give rise to a
daughter pattern (p1 + p2)/(q1 + q2). As an example, patterns like 11 and 12 can give rise to a pattern 1112 which has a firing number 3/5
= (1+2)/(2+3). This pattern, together with the pattern 12, can form
the daughter 11(12)2 which has the firing number 5/8 = (3+2)/(5+3),
which is one of the patterns observed. These combination of patterns can be still understood collecting them in a Farey tree54.
At [acetone]0 = 0.160 M only the patterns 12, 11, 21, 31, and 41
were found decreasing [bromate]0. At [acetone]0 = 0.170 M, patterns still more complex arise, mixing low- and high-amplitude oscillations. For [bromate]0 between the concentrations that produces the patterns 13 and 11 we found the patterns: (13)211, 13111211 (see Figure 7), and
(11)312. The first and the last patterns are obvious daughters of the
parent patterns 13 and 11 but the pattern in Figure 7 has three parents,
13,11, and 12 and can not be understood by a Farey tree but by a Farey
triangule54. At lower [bromate]
0 the tendency for the predominance of
high-amplitude oscillations is observed again with the appearance of the sequence of the patterns 11, 2111, 21,21(31)2, 41, and 51.
At [acetone]0 = 0.180 M the situation is more complex as more patterns appear in very thin slices of bromate concentration as is shown in Figure 8. Some of these patterns can be seen in Figures 9 to 11. Note the astonishing complex repetitive pattern 127113117113 in
Figure 11a which can be considered as a daughter of three parent patterns. Note too that the low-amplitude pattern shown in the Fi-gure 9 (which can not be designed by the Ls notation because all oscillations has low amplitude) is the period-4 pattern which appears in a region inside a period-2 region as shown in Figure 4. Figure5. Pattern 19 close to a canard-like behavior (see line 1n to n1 in Figure
4). Constraints: [BrO3 -]
0 = 0.040458M; [acetone]0 = 0.165 M; [H +]
0 = 1 M;
[oxalic acid]0 = 0.03 M; [Ce(IV)]0 = 5 × 10 -4 M, k
0 = 0.005 s -1
Figure6. Patterns close to a canard-like behavior. (a) Pattern 21(11)3, [BrO 3
-] 0
= 0.040441M; (b) Pattern 61, [BrO 3
-]
0 = 0.040433M. Other constraints:
[acetone]0 = 0.165 M; [H +]
0 = 1 M; [oxalic acid]0 = 0.03 M; [Ce(IV)]0 = 5 ×
10-4 M, k
0 = 0.005 s -1
Figure7. Pattern 13111211 close to a canard-like behavior. Constraints: [BrO 3
-] 0
= 0.040615 M; [acetone]0 = 0.170 M; [H+]
0 = 1 M; [oxalic acid]0 = 0.03 M;
[Ce(IV)]0 = 5 × 10 -4 M, k
0 = 0.005 s -1
Figure8. Sequence of patterns close to a canard-like behavior at [acetone]0 = 0.180 M and 0,185 M. Constraints: [H+]
0 = 1 M; [oxalic acid]0 = 0.03 M;
[Ce(IV)]0 = 5 × 10⁻⁴ M, k
0 = 0.005 s
-1. HAO = high-amplitude oscillations;
At [acetone]0 = 0.185 M some patterns appeared in the same sequence as when [acetone]0 was 0.180 M but shifted to lower bromate concentration, as can be seen in Figure 8. Some patterns which were seen for [acetone]0 equal to 0.185 M did not appeared but some new are present as can be seen in Figure 12 which presents the very special regular pattern 11012(1512)2 which can be understood
as daughter of three patterns 12, 15, and 110. Otherwise, Figure 13
looks very special because we can see not only two different am-plitudes but three (the inner set of low-amplitude oscillations contains 16 and 17 medium and small oscillations, respectively) which belongs to a family of similar patterns which occur in the range of bromate concentrations indicated by the label “Fig. 13” in Figure 8. This kind of pattern can not be understood by a Farey sequence and, as far we know, has not been reported before. Figure9. Period-4 low-amplitude oscillation close to a canard-like behavior. Constraints: [BrO3-]
0 = 0.04136 M; [acetone]0 = 0.180 M; [H +]
0 = 1 M;
[oxalic acid]0 = 0.03 M; [Ce(IV)]0 = 5 × 10 -4 M, k
0 = 0.005 s -1
Figure10. Patterns close to a canard-like behavior. (a) Pattern 17, [BrO 3
-] 0
= 0.041280 M; (b) Pattern 19, [BrO 3
-]
0 = 0.04081M. Other constraints:
[acetone]0 = 0.180 M; [H+]
0 = 1 M; [oxalic acid]0 = 0.03 M; [Ce(IV)]0 = 5 ×
10-4 M, k
0 = 0.005 s -1
Figure11. Patterns close to a canard-like behavior. (a) Pattern 127 113 117 113,
[BrO3 -]
0 = 0.0408 M (b) High-amplitude spikes in a middle of many low-amplitude
oscillations, [BrO3-]
0 = 0.04072 M. Other constraints: [acetone]0 = 0.180 M;
[H+]
0 = 1 M; [oxalic acid]0 = 0.03 M; [Ce(IV)]0 = 5 × 10 -4 M, k
0 = 0.005 s -1
Back to the Figure 1, at low bromate concentration, approximately [bromate]0 = 0.005 M and [acetone]0 = 0.10 M, we can appreciate another very special dynamic behavior for this system that is a period-doubling sequence that should result in chaos30.
Starting at [bromate]0 = 0.0045 M and [acetone]0 = 0.09669 M, increasing the acetone concentration the period-1 (high-amplitude simple oscillations) goes to a period-2 (similar to Figure 3 but with high-amplitude oscillations), period-4 (similar to Figure 9 but with high-amplitude oscillations), period-8, period-16, period-32, and period-64 at [acetone]0 = 0.096692 M, 0.096696 M, 0.0966965 M, 0.09669675 M, 0.09669678 M, 0.09669680 M, respectively. The collected maximum and minimum values of the oscillations at each different [acetone]0 are present in Figure 14. Because the acetone concentration get closer and closer at each period-doubling, to make this figure more clear we used in the abscissa axis the expression Figure12. Pattern 110 12 (15 12 )2 close to a canard-like behavior. Constraints:
[BrO3 -]
0 = 0.03989 M; [acetone]0 = 0.185 M; [H +]
0 = 1 M; [oxalic acid]0 =
0.03 M; [Ce(IV)]0 = 5 × 10 -4 M, k
log ([acetone-64]0 - [acetone]0 + 5 × 10⁻⁸) where [acetone-64] 0 is
the acetone concentration for what the period-64 was observed. As expected, at still higher acetone concentration, we found a chaos window which extended until [acetone]0 = 0.096703 M, confirming the very well know fact that a period-doubling sequence is one of the route to chaos behavior14.
At bromate concentration still lower, [bromate]0 = 0.004 M, a pattern very complex arise (see Figure 15). As can be seen, there is some regularity embedded in the apparently chaotic pattern. This regularity turns out to be more clear if the [bromate]0 is decreased to 0.003 M when the system presents the quasiperiodicity30 behavior,
as shown in Figure 16. This proximity of period-doubling cascades, chaos and quasiperiodicity may suggest that the origins of these behaviors may have a common source but at the same time the phase diagram at Figures 1 and 4 show that a Farey sequence of complex patterns has a distinct origin.
Changing the [H+]
0 allowed us to obtain bromate × acetone phase
diagrams at 0.5 M and 1.5 M H+ concentrations. It means that a
tridimensional phase diagram can be obtained. We have investigated in these cases only the main lines of the phase diagram as in the phase diagram shown in Figure 1. As a result we observed that the external boundary that includes the oscillation regions diminishes as the acid concentration increases suggesting that the oscillation regions should disappear for higher sulfuric acid concentrations.
Then, our results show three regions in the phase diagram in which the system presents complex oscillations. The first is the region indicated by dots and labeled “1n to n1” in Figure 4, presenting
mixed-mode oscillations which can be rationalized by Farey
sequences. The second region presents a 4 inside a period-2, both of them as a low amplitude oscillation, as indicated in Fi-gure 4. The third region is at approximately 0.10 M acetone concentration and low bromate concentration (around 0.005 M) in which the system presents a period doubling sequence and quasiperiodicity.
After this analysis of the many different regions of the bromate × acetone phase diagram we can say that this is one of the most complex oscillating system ever studied. Our results shown that behaviors like a Farey sequence, a period doubling sequence, and quasiperiodicity can now be seen as possible different behaviors of an oscillating reaction which show up depending on the region of the phase diagram the parameters point to.
The very small changes in the bromate and acetone inflow concentrations necessary to observe several of the behaviors reported in this paper are almost impossible to be done experimentally. Any experiment will present small enough fluctuation in the speed of the pump that feed the reactants to the reactor that will make the system move from one pattern to another very close. This should produce patterns that will have some similarity with the patterns shown here but more irregular. However, comparison of our results with experimental results obtained by Guedes and Faria61 for a
si-milar system catalyzed by manganese, under batch conditions, show some resemblance, as the experimental results show mixed-mode oscillations, low-amplitude oscillations with high-amplitude bursts, and also transitions between high- and low-amplitude oscillations patterns (canard-like behavior). These results suggests that the phase diagram of the system catalyzed by manganese may has a phase diagram similar to the one presented here.
Figure13. Pattern with three different amplitudes (the inner set of low-amplitude oscillations contains 16 and 17 medium and small oscillations, respectively) close to a canard-like behavior. Constraints: [BrO3
-]
0 = 0.04176
M; [acetone]0 = 0.185 M; [H+]
0 = 1 M; [oxalic acid]0 = 0.03 M; [Ce(IV)]0 =
5 × 10⁻⁴ M, k
0 = 0.005 s -1
Figure14. Bifurcation diagram at [bromate]0 = 0.0045 M. Each point in the graphic is the calculated maximum or minimum log [Br -]. Other constraints:
[H+]
0 = 1 M; [oxalic acid]0 = 0.03 M; [Ce(IV)]0 = 5 × 10 -4 M, k
0 = 0.005 s -1
Figure15. Chaos with some regularity embedded at [bromate]0 = 0.004 M
and [acetone]0 = 0.097905 M. Other constraints: [H+]
0 = 1 M; [oxalic acid]0
= 0.03 M; [Ce(IV)]0 = 5 × 10 -4 M, k
0 = 0.005 s -1
Figure16. Quasiperiodicity at [bromate]0 = 0.003 M and [acetone]0 =
0.103638 M. Other constraints: [H+]
0 = 1 M; [oxalic acid]0 = 0.03 M;
[Ce(IV)]0 = 5 × 10 -4 M, k
For the system catalyzed by cerium, recent results in flow conditions have shown the existence of irregular low-amplitude oscillations that can change to regular high-amplitude oscillations (canard-like behavior) depending on the ratio [Ce(IV)]/[Ce(III)]62.
More complex patterns are still waiting to be observed experimentally for this system.
CONCLUSION
The Field and Boyd model for the system bromate – oxalic acid – Ce(IV) – acetone showed a wealth of dynamic possibilities not yet explored for this system, in a flow regime. Complex behaviors such as mixed-mode oscillations following a Farey sequence, quasiperiodicity, period doubling sequence and chaos were found including the hysteresis between a steady state and a low-amplitude oscillations. These different behaviors were mapped in a phase diagram containing several regions, some of them nested inside the others.
Comparison of our results with the modeling results of Kim, Shin, and Lee55 for the Briggs-Rauscher system, show that the phase diagram
we obtained is much more complex. However, we did not find burst oscillation patterns but this possibility can not be excluded because this can be reveled by a more detailed investigation of this system.
The correlation of the present results with biological system is unavoidable. Several biological processes, in special hormone cycles and neurons behavior, present complex patterns similar to some of the patterns presented here63. The huge amount of different behaviors
that are possible for complex systems like the one we presented here, suggests that other complex systems like, for example, the brain, can have an enormous amount of possibilities. However, the bridge between the many different patterns shown here and the behavior of biological subjects is only starting to be built.
ACKNOWLEDGMENTS
This work was supported by CNPq, CAPES, and FAPERJ. The authors thank Dr. I. Lengyel for the use of the Turbo Pascal numerical integration program.
REFERENCES
1. Chance, B.; Pye, E. K.; Gosh, A. K.; Hess, B.; Biological and Biochemical
Oscillators, Academic Press: New York, 1973.
2. Bray, W. C.; J. Am. Chem. Soc.1921, 43, 1262.
3. Glansdorff, P.; Prigogine, I.; Thermodynamic Theory of Structure, Stability
and Fluctuations, Wiley-Interscience: New York, 1971.
4. Nicolis, G; Prigogine, I.; Self-Organization in Non-Equilibrium Systems,
Wiley-Interscience: New York, 1977.
5. Lavenda, B. H.; Thermodynamics of Irreversible Processes, Macmillan:
London, 1978.
6. Belousov, B. P.; Sb. Ref. Rad. Med. 1958; Medgiz: Moscow 1959, 145.
7. Zhabotinsky, A. M.; Dokl. Akad. Nauk. SSSR1964, 157, 392.
8. Belousov, B. P. In Oscillations and Travelling Waves in Chemical Systems;
Field, R. J.; Burger, M., eds.; Wiley: New York, 1985, p. 605-614. 9. Zhabotinsky, A. M. In ref. 8, p. 1-6.
10. Field, R. J. In ref. 8, p. 55-92.
11. Zhabotinsky, A. M.; Chaos1991, 1, 379.
12. Noyes, R. M.; Field, R. J.; Annu. Rev. Phys. Chem.1974, 25, 95.
13. Field, R. J. In Theoretical Chemistry; Eyring, H.; Henderson, D., eds.;
Academic Press: New York, 1978, vol. 4.
14. Gray, P.; Scott, S. K. Chemical Oscillations and Instabilities, Clarendon
Press: Oxford, 1990, chap. 14.
15. Nicolis, G.; Portnow, J.; Chem. Rev.1973, 73, 365.
16. Winfree, A. T.; The Geometry of Biological Time, Springer-Verlag: New
York, 1980.
17. Babloyantz, A.; Molecules, Dynamics & Life: An Introduction to
Self-Organization of Matter, Wiley: New York, 1986.
18. Vidal, C.; Roux, J. C.; Rossi, A.; J. Am. Chem. Soc.1980, 102, 1241.
19. Zaikin, A. N.; Zhabotinsky, A. M.; Nature (London)1970, 225, 535.
20. Winfree, A. T.; Science1972, 175, 634.
21. Britton, M. M.; Sederman, A. J.; Taylor, A. F.; Scott, S. K.; Gladden, L. F.;
J. Phys. Chem. A2005, 109, 8306.
22. Smoes, M.-L. In Dynamics of Synergetic System; Haken H., eds.;
Springer-Verlag: Berlin, 1980.
23. Field, R. J.; Noyes, R. M.; Faraday Symp. Chem. Soc.1974, 9, 21.
24. Ruoff, P.; Chem. Phys. Lett.1982, 90, 76.
25. Kurin-Csörgel, K.; Epstein, I. R.; Orbán, M.; Nature (London)2005, 433, 139.
26. Argoul, F.; Arneodo, A.; Richetti, P.; Roux, J. C.; Swinney, H. L.; Acc. Chem.
Res.1987, 20, 436.
27. Schmitz, R. A.; Graziani, K. R.; Hudson, J. L.; J. Chem. Phys.1977, 67,
3040.
28. Rössler, O. E.; Wegmann, K.; Nature (London)1978, 271, 89.
29. Vidal, C.; Roux, J. C.; Rossi, A.; Bachelart, S.; C. R. Acad. Sci. (Paris) C
1979, 289, 73.
30. Scott, S. K.; Chemical Chaos, Clarendon Press: Oxford, 1991.
31. Field, R. J.; Boyd, P. M.; J. Phys. Chem.1985, 89, 3707.
32. Noszticzius, Z.; Bodiss, J.; J. Am. Chem. Soc.1979, 101, 3177.
33. Sevcik, P.; Adamcikova, P.; Collect. Czech. Chem. Commun.1982, 47, 891.
34. Sevcik, P.; Adamcikova, L.; Collect. Czech. Chem. Commun.1985, 50, 799.
35. Noszticzius, Z.; Stirling, P.; Wittmann, M.; J. Phys. Chem.1985, 89, 4914.
36. Noszticzius, Z.; Magy. Kem. Foly., Kem. Kozl.1979, 85, 330.
37. Wittmann, M.; Stirling, P.; Bódiss, J.; Chem. Phys. Lett.1987, 141, 241.
38. Berenstein, I.; Agreda, J.; Barragan, D.; Phys. Chem. Chem. Phys.1999,
1, 4601.
39. Berenstein, I.; Agreda, J.; Barragan, D.; J. Phys. Chem.1999, 103, 9780.
40. Berenstein, I.; Barragan, D.; J. Braz. Chem. Soc.2004, 15, 844.
41. Biswas, S.; J. Phys. Chem. A2001, 105, 8857.
42. Gaspar, V.; Galambosi, P.; J. Phys. Chem.1986, 90, 2222.
43. Lotka, A. J.; J. Phys. Chem.1910, 14, 271.
44. Field, R. J.; Körös, E.; Noyes, R. M.; J. Am. Chem. Soc.1972, 94, 8649.
45. Kumpinsky, E,; Epstein, I. R.; J. Phys. Chem.1985, 89, 688.
46. Noyes, R. M.; J. Am. Chem. Soc.1980, 102, 4644.
47. Noyes, R. M.; J. Chem. Phys.1984, 80, 6071.
48. Györgyi, L.; Turányi, T.; Field, R. J.; J. Chem. Phys.1990, 94, 7192.
49. Treindl, L.; Ruoff, P.; Kvernberg, P. O.; J. Phys. Chem. A1997, 101, 4606.
50. Petrascu, A. M.; Kock, M. H.; Försterling, H.-D.; J. Phys. Chem. A1999,
103, 6757.
51. Hlavačova, J.; Ševčík, P.; Chem. Phys. Lett.1991, 182, 588.
52. Zhang Y. X.; Field, R. J.; J. Phys. Chem.1990, 94, 7154.
53. Pelle, K.; Wittmann, M.; Lovrics, K.; Noszticzius, Z.; J. Phys. Chem. A
2004, 108, 7554.
54. Masełko, J.; Swinney, H. L.; J. Chem. Phys.1986, 85, 6430.
55. Kim, K.-R.; Shin, K. J.; Lee, D. J.; J. Chem. Phys.2004, 121, 2664.
56. Rentrop, P.; Kaps, P.; Num. Math.1979, 33, 55.
57. Olsen, R. J.; Epstein, I. R.; J. Chem. Phys.1993, 98, 2805.
58. Bar-Eli, K.; Ronkin, J.; J. Phys. Chem.1984, 88, 2844.
59. Brfns, M.; Bar-Eli, K.; J. Phys. Chem.1991, 95, 8706.
60. Brfns, M.; Bar-Eli, K.; Proc. R. Soc. London A1994, 445, 305.
61. Guedes. M. C.; Faria, R. B.; J. Phys. Chem. A1998, 102, 1973.
62. Pereira, J. A. M.; Faria, R. B.; J. Braz. Chem. Soc.2004, 15, 976.
63. Le Masson, G.; Renaud-Le Masson, S.; Debay, D.; Bal, T.; Nature (London)
![Figure 2. Canard-like behavior. Fixed constraints: [H + ] 0 = 1 M; [acetone] 0](https://thumb-eu.123doks.com/thumbv2/123dok_br/18984518.458356/3.892.121.414.95.315/figure-canard-like-behavior-fixed-constraints-h-acetone.webp)
![Figure 8. Sequence of patterns close to a canard-like behavior at [acetone] 0](https://thumb-eu.123doks.com/thumbv2/123dok_br/18984518.458356/4.892.476.774.797.1007/figure-sequence-patterns-close-canard-like-behavior-acetone.webp)
![Figure 11. Patterns close to a canard-like behavior. (a) Pattern 1 27 1 13 1 17 1 13 , [BrO 3 - ] 0 = 0.0408 M (b) High-amplitude spikes in a middle of many low-amplitude oscillations, [BrO 3 - ] 0 = 0.04072 M](https://thumb-eu.123doks.com/thumbv2/123dok_br/18984518.458356/5.892.129.407.390.799/figure-patterns-canard-behavior-pattern-amplitude-amplitude-oscillations.webp)
![Figure 14. Bifurcation diagram at [bromate] 0 = 0.0045 M. Each point in the graphic is the calculated maximum or minimum log [Br - ]](https://thumb-eu.123doks.com/thumbv2/123dok_br/18984518.458356/6.892.98.359.93.293/figure-bifurcation-diagram-bromate-graphic-calculated-maximum-minimum.webp)
