Genetic transcriptional regulatory model driven by the time-correlated noises
Xiao-miao Zhang, Bao-quan Ai,∗ and Jian-wen Xiong Laboratory of Quantum Information Technology, ICMP and SPTE,
South China Normal University, 510631 Guangzhou, China
(Received on 29 October, 2009)
Steady state properties of a kinetic model of Smolen-Baxter-Byrne [P. Smolen, D. A. Baxter, J. H. Byrne, Amer. J. Physiol. Cell. Physiol. 274, 531 (1998)] are investigated in presence of two time-correlated noises. The steady state probability distribution can be obtained by solving the Fokker-Planck equation. It is found that both the correlated-time between the white noise and the colored noise and that between the colored noises can convert the bistability to monostability while the former activates the transcription and the latter suppresses it.
Keywords: genetic transcriptional regulatory mechanism, steady-state probability distribution, time-correlated noises, Fokker-Planck equation.
1. INTRODUCTION
Recently, nonlinear stochastic systems with noise term have been the subject of extensive investigations. Noise can induce many significant phenomena such as phase transition and stochastic resonance. The concept of noise-induced tran-sition has many applications in the fields of physics, chem-istry and biology [1–27]. Especially in biologic system, it is very important to explore the effects caused by noise in non-linear system and to find the condition, causation and appli-cation, which can give a strong impulse on the development and the intercross of subjects.
Gene expression and regulation processes is the core prob-lem of molecular biology and a hot subject in biology study. Genetic transcriptional regulatory mechanism is a simulation of the biologic gene regulatory system in which the transcrip-tion factor accelerates the transcriptranscrip-tion process. There are some studies about this simulation [28, 39, 40]. Neverthe-less, in the previous work, they took the correlation-time as zero. Actually, the real correlation-time is very small, but it is not equal to zero exactly. So taking finite correlation-time into consideration may be more reasonable. Generally, ana-lyzing the evolvement of a system with nonzero correlation-time may reflect the dynamic effects of a noise on a sys-tem more completely. So it may make some exploring sense to study the effects of the correlation-time on the gene tran-scription regulatory mechanism.
In this paper, based on the kinetic model of Smolen-Baxter-Byrne [29], the effects of two time-correlated noises (the fluctuations in the transcription rate and basal rate of synthesis of transcription factor) have been investigated through the numerical computation and the analysis theory. It is found that the additive colored noise reduces the tran-scription efficiency. Remarkably, the correlated-time be-tween the additive colored noises as well as the multiplicative white noise can convert the bistability to monostability and can suppress the transcription while the correlation-time be-tween the multiplicative white noise and the additive colored noise can convert the bistability to monostability and can ac-tivate the transcription, which has not been found before.
∗Electronic address:[email protected]
2. THE MODEL OF GENE TRANSCRIPTION
Now there are mainly two kinds of theoretical models of gene transcriptional regulatory mechanism: positive tran-scription control and negative trantran-scription control. Smolen et al. have proposed a model simulation about the transcrip-tion factor facilitating the gene transcriptranscrip-tion in 1998 [29], which contains dimer, positive feedback of transcription fac-tor and nonlinear reciprocity. The model considers a single transcriptional activator (TF-A) as part of a pathway mediat-ing a cellular response to a stimulus. The TF forms a homod-imer that can bind to responsive elements (TF-REs). The tf-a gene incorporates a TF-RE, and when homodimers bind to this element TF-A transcription is increased. Binding to the TF-REs is independent of dimer phosphorylation. However, only phosphorylated dimers can activate transcription. The fraction of phosphorylated dimers depends on the activity of kinases and phosphatases whose activity can be regulated by external signals. Therefore, this model incorporates both signal-activated transcription and positive feedback on the rate of TF synthesis. In order to capture the salient features of TF dimerization, binding, and phosphorylation-dependent regulation of transcription and to make the model appreci-ated intuitively, some simplifications were made [30]. It is assumed that the transcription rate saturates with TF-A dimer concentration to maximal rate α, which is proportional to TF-A phospholation. The synthesis rate is β at negligible dimer concentration. TF-A is eliminated with a rate constant
κ2. The basic mechanism is shown in Fig. 1 [29].
According to several biologic and chemical reactions of this model, a differential equation about the evolvement of concentration of transcription factor with time can be ac-quired [28]:
˙ x= αx
2
x2+κ 1−
κ2x+β, (1) wherexis the concentration of transcription factor (TF-A),
κ1is the concentration of dimer which is not adhering to the responsive elements (termed as TF-REs). For certain values of α ( α<5.45 orα>6.68 ) there is one unique steady solution of [TF-A] (the concentration of transcription factor) [28]. For other values ofα, there are three steady solutions with one unstable state and the other two stable states.
FIG. 1: The schematic description of positive autoregulatory model [29]. TF-A denotes transcription factor, TF-RE responsive element,
αtranscription rate,βthe basal rate of synthesis,Pphosphorylated,
κ2the degradation rate.
have studied the effects of two Gaussian white noises on the steady state distribution of protein concentration [28]. But they did not consider the correlation time. In this paper, we just study it. In order to introduce these effects, we rewrite the Eq. (1) as follows,
˙ x= αx
2
x2+κ 1−
κ2x+β+ x2 x2+κ
1
ξ(t) +η(t), (2)
whereξ(t)is a white noise andη(t)is a colored noise with the following properties [31]:
hη(t)i=hξ(t)i=0, (3)
hξ(t)ξ(t′)i=2D1δ(t−t′), (4)
hη(t)η(t′)i=D2
τ1 exp
−|t−τt′| 1
, (5)
hη(t)ξ(t′)i=hξ(t)η(t′)i=λ √
D1D2
τ2 exp
−|t−τt′|
2
, (6)
hereD1 is the intensity of white noise, τ1 and D2 are the correlation time and intensity of the multiplicative colored noise, and τ2 is the noise correlation time of the coupling betweem the multiplicative and additive noise. In the limit
τ1→0, the additive noise tends to white noise, while the cou-pling between the multiplicative and additive noise is colored correlated.
In this paper, we emphasize on finding how the correla-tion time affects the genetic transcripcorrela-tional regulatory model. In the following part we give a steady state analysis of the model.
3. STEADY STATE ANALYSIS OF THE MODEL
If a nonlinear system contains a colored noise, it is a non-Markov stochastic process. It is necessary to develop some approximate methods to transform the non-Markov process to the Markov process in order to get analytic results. The functional analysis and the unified colored noise approxima-tion (UCNA) are the methods commonly used in the analysis [19, 32–37]. According to the stochastic Liouville equation, Eq. (2) satisfies
∂P(x,t)
∂t =−
∂
∂xh(x)P(x,t) −∂∂xg1(x)hξ(x)δ(x(t)−x)i −
∂
∂xg2(x)hη(t)δ(x(t)−x)i, (7)
where
h(x) = αx 2
x2+κ 1−
κ2x+β, (8)
g1(x) = x2 x2+κ
1
, (9)
g2(x) =1, (10)
here the probability distribution function can be expressed as P(x,t) =hδ(x(t)−x)i.
By applying the Novikov theorem [38] and Fox’s approach [19, 32, 34, 35], the approximate Fokker-Planck equation corresponding to Eq. (7) can be written as
∂P(x,t)
∂t =−
∂
∂xh(x)P(x,t) + D1
∂ ∂xg1(x)
∂
∂xg1(x)P(x,t) +D2
∂ ∂xg2(x)
∂
∂xg2(x)P(x,t) +
λ√D1D2 1−τ2
h h′(xs)−
g′2(xs) g2(xs)h(xs)
i
∂ ∂xg1(x)
∂
∂xg2(x)P(x,t) +
λ√D1D2 1−τ2
h h′(xs)−
g′1(xs) g1(xs)h(xs)
i
∂ ∂xg2(x)
∂
∂xg1(x)P(x,t). (11)
xs= 3 s −q 2+ r q 2 2
+p 3 3 + 3 s −q 2− r q 2 2
+p 3
3 −b
3, (12)
p=κ1−
(α+β)2 3κ2
2
, (13)
q= 1 27
α+β
κ2 3
+p 3
α+β κ2 −
κ1
κ2
β, (14)
b=−ακ+β 2
. (15)
From Eq. (11), one has
∂P(x,t)
∂t =−
∂
∂x[h(x)+g
′(x)g(x)]P(x,t)+ ∂2
∂x2g(x)g(x)P(x,t), (16) where
g(x) =
D2g22(x) +
2λ√D1D2 1−τ2
h 2ακ1xs (κ1+xs)2−κ2
ig1(x)g2(x) +D1g 2 1(x)
1/2
. (17)
If the multiplicative noise is colored with finite correla-tion timeτ1, the UCNA method can be employed. Thus the non-Markov process of Eq. (2) can be simplified to a one-dimensional Markov process
dx dt =
1 A(x,τ1)
[h(x) +g2(x)Γ(t) +g1(x)ξ(t)], (18)
with
A(x,τ1) = 1−τ1
h′(x)−g′2(x) g2(x)
h(x)
= 1−τ1
2ακ1x (x2+κ
1)2−
κ2
, (19)
whereh′(x)andg′2(x)are the derivatives ofh(x)andg2(x) with respect toxandΓ(t)is white noise with
hΓ(t)i=0,hΓ(t)Γ(t′)i=2D2δ(t−t′). (20)
By combining the results, Eq. (11), of the functional anal-ysis and Eq. (18) of the UCNA, the Fokker-Planck equation corresponding to Eqs. (2,3,4,5,6) can be written as
∂P(x,t)
∂t = −
∂ ∂x
h(x)
A(x,τ1)
P(x,t) +D2
∂ ∂x
g2(x) A(x,τ1)
∂ ∂x
g2(x) A(x,τ1)
P(x,t)
+ λ
√ D1D2 1−A(xτ2s,τ1)
h h′(xs)−
g′1(xs) g1(xs)h(xs)
i
∂ ∂x
g2(x) A(x,τ1)
∂ ∂x
g1(x) A(x,τ1)
P(x,t)
+D1
∂ ∂x
g1(x) A(x,τ1)
∂ ∂x
g1(x) A(x,τ1)
P(x,t)
+ λ
√ D1D2 1−A(xτ2s,τ1)
h h′(xs)−
g′2(xs) g2(xs)h(xs)
i
∂ ∂x
g1(x) A(x,τ1)
∂ ∂x
g2(x) A(x,τ1)
P(x,t). (21)
Thus the two different kinds of colored noise can be approx-imated and expressed by Eq. (21). It should be mentioned that the regime of the approximation method used in deriving
Eq. (21) is [32]
G(x,τ1,τ2) =1−
τ2 A(x,τ1)
h′(xs)−
g′2(xs)
g2(xs)
h′(xs)
>0,
G(x,τ1,τ2)≫λ D1D2 h(x)
. (23)
In the following calculations, these conditions are satis-fied. Thus the corresponding Fokker-Planck equation of the steady state probability distribution system, Eq. (21) when
∂P(x,t)/∂t=0, can be written as
Pst(x) =exp
Z H(x)
G2(x)dx−ln|G(x)|
, (24)
with
H(x) = h(x)
A(x,τ1)
,G(x) = g(x)
A(x,τ1)
. (25)
Then we give a numerical analysis for equation (24) and the results are presented in Figs. 2-5.
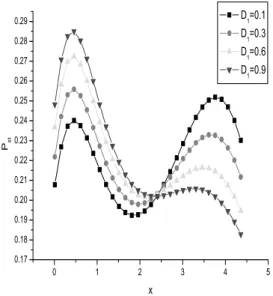
FIG. 2:Pst(steady probability density) as a function ofxfor differ-ent values of the multiplicative white noise intensityD1. D1=0.1, 0.3, 0.5, and 0.7, respectively, atD2=0.5,τ1=0.1,τ2=0.5,λ=0.4,
α=5.75,β=0.4,κ1=10.0, andκ2=1.0. (units are relative).
The effects of the strength of the multiplicative white noise D1(the fluctuation of transcription rate) on the steady state probability distribution (SPDF) are plotted in Fig. 2. As we can see from the curves, for a small value ofD1, the sys-tem has two steady states with the upper state excelling the lower state. With the increasing of the noise strength, the height of the right peak decreases while the height of the left peak increases. For a large noise strength the height of the right peak decreases drastically. Therefore, the multiplica-tive white noise can drive the steady state from the upper state to the lower state, and the system from bistability to monostability. That is to say, strong fluctuation of transcrip-tion rate may suppress the gene transcriptranscrip-tion.
Fig. 3 depicts the effects of the strength of the additive col-ored noiseD2(the fluctuation of basal rate of synthesis) on the steady state probability distribution (SPDF). For a small value ofD2, the system has two steady states with the lower
FIG. 3: Pst(steady probability density) as a function ofxfor dif-ferent values of the additive colored noise intensityD2. D2=0.1,
0.3, 0.5, and 0.7, respectively, atD1=0.1,τ1=0.1,τ2=0.5,λ=0.4,
α=5.75,β=0.4,κ1=10.0, andκ2=1.0. (units are relative).
state excelling the upper state. With the increasing of the noise strength, the height of the left peak and the right peak decrease simultaneously. The peak becomes flat for big noise strength. So it can be prophesied that the system turns into confusion for large perturbation of environment. This im-plies that the additive colored noise do not affect the tran-scription switch, but make a strong impact on the transcrip-tion efficiency. That is to say, the fluctuatranscrip-tion of basal rate of synthesis can be used to weaken the transcription efficiency. Such a development could have important implications for gene transcription regulation.
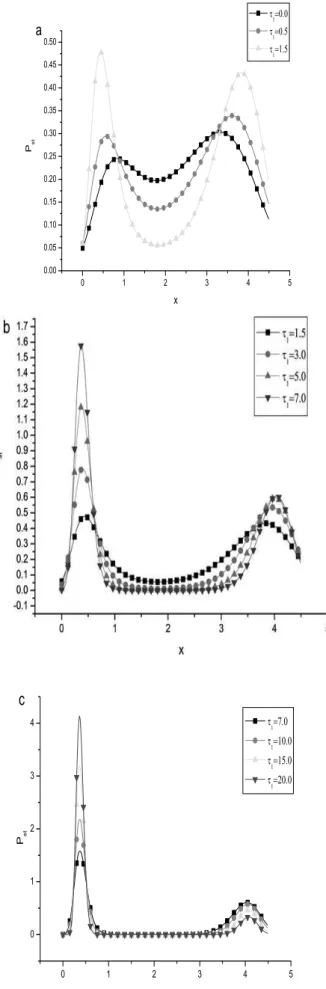
Fig. 4(a)-4(c) are plots of the effects of different values of
τ1(the correlation time of the colored noise) on the steady state probability distribution. For a small value ofτ1, the curves have a similar feature as Fig. 2 whenD1 is small. With the increasing of the value of a small value ofτ1(see in Figs. 4a, 4b), the height of the left peak and the height of the right peak increase simultaneously and the height of the right peak increases more slowly than the left one. For a large value ofτ1(see in Fig. 4c), with the increasing of the value of theτ1, the height of the right peak decreases while the height of the left one increases extremely rapidly. Therefore, the correlated time of the colored noise can drive the steady state from the upper state to the lower state, and the system from bistability to monostability. That is to say, strong fluctuation of correlation time of the multiplicative colored noise (the transcription rate) may suppress the gene transcription.
FIG. 4:Pst(steady probability density) as a function ofxfor differ-ent values of the correlation time of the multiplicative color noise
τ1. Fig. 4(a):τ1=0.0, 0.5, and 1.5; Fig. 4(b):τ1=1.5, 3.0, 5.0, and
7.0; Fig. 4(c):τ1=7.0, 10.0, 15.0, and 20.0, respectively, atD1=0.1,
D2=0.1,τ2=0.5,λ=0.5,α=5.5,β=0.5,κ1=10.0, andκ2=1.0. (units are relative).
FIG. 5:Pst(steady probability density) as a function ofxfor differ-ent values of the correlation time between the multiplicative noise and the additive noiseτ2. τ2=0.0, 3.0, 6.0 and 9.0, respectively, atD1=0.1, D2=0.1, τ1=0.1, λ=0.5, α=5.5, β=0.5, κ1=10.0, and
κ2=1.0. (units are relative).
has two steady states. With the increasing of the value of
τ2, the height of the right peak increases while the height of the left one reduces. Therefore, the correlation time between the additive colored noise and the multiplicative white noise can drive the steady state from the lower state to the higher state, and the system from bistability to monostability. That is to say, strong fluctuation of correlation time between the additive colored noise (basal rate of synthesis) and the multi-plicative white noise (the transcription rate) can activate the gene transcription.
4. CONCLUSIONS AND SUMMARY
In this paper, based on the kinetic model of Smolen-Baxter-Byrne [29], the effects of the fluctuations in the tran-scription rate and basal rate of synthesis of trantran-scription fac-tor have been investigated through the numerical computa-tion and the analysis theory. It is found that the additive col-ored noise reduces the transcription efficiency. Remarkably, the correlated-time between the additive colored noises as well as the multiplicative white noise can convert the bista-bility to monostabista-bility and can suppress the transcription. The correlation-time between the multiplicative white noise and the additive colored noise can convert the bistability to monostability and can activate the transcription.
[1] A. Fulinski and T. Telejko, Phys. Lett. A 152, 11 (1991). [2] B. Q. Ai, X. J. Wang, G. T. Liu, L. G. Liu, Phys. Rev. E 67,
022903 (2003).
[3] B. Q. Ai and L. G. Liu, J. Phys. Chem. B 112, 9540 (2008). [4] J. M. Sancho, M. San Miguel, S. L. Katz, and J. D. Gunton.
Phys. Rev. A 26, 1958 (1982).
[5] B. Q. Ai and L. G. Liu, Phys. Rev. E 74, 051114 (2006). [6] R. Benzi, A. Sutera, and A. Vulpiani, J. Phys. A 14, L453
(1981).
[7] R. Benzi, G. Parisi, A. sutera, and A. Vulpiani, Tellus 34, 10 (1982).
[8] B. McNamara and K. Wiesenfeld, Phys. Rev. A 39, 4854 (1989).
[9] T. Zhou and F. Moss, Phys. Rev. A 41, 4255 (1990). [10] P. Jung and P. Hanggi., Phys. Rev. A 44, 8032 (1991). [11] G. Hu. T. Ditzinger, C. Z. Ning, and H. Haken, Phys. Rev.
Lett. 71,807 (1993).
[12] M. I. Dykman, R. Mannella, P. V. E. McClintock, and N. G. Stocks, Phys. Rev. lett. 68, 2985 (1992).
[13] A. Neiman and L. Schimansky-Geier, Phys. Rev. Lett. 72, 2988 (1994).
[14] P. Jung and G. Maye-Kress, Phys. Rev. Lett. 74,2130 (1995). [15] L. Ganna, F. Marchesoni, and S. Santucci, Phys. Rev. Lett. 74,
1052 (1995).
[16] J. F. Lindner, B. K. Meadows, W. L. Ditto, M. E. Inchiosa, and A. R. Bulsara, Phys. Rev. Lett. 75, 3 (1995).
[17] G. Hu, H. Haken, and F. Xie, Phys. Rev. Lett. 77, 1925 (1996). [18] A. R. Bulsara and L. Gammaitoni, Phys. Today 49 (3), 39
(1996).
[19] L. Gammaitoni, P. Hanggi, P. Jung, and F. Marchesoni, Rev. Mod. Phys. 70, 224 (1998).
[20] V. Berdichevsky and M. Gitterman, Phys. Rev. E 60, 1494
(1999).
[21] F. Marchesoni, F. Apostolico, and S. Santucci, Phys. Rev. E 59, 3958 (1999).
[22] M. M. Alibegov, Phys. Rev. E 59, 4841 (1999).
[23] C. J. Tessone, H. S. Wio, and P. Hanggi, Phys. Rev. E 62, 4623 (2000).
[24] H. E. Plesser and T. Geisel, Phys. Rev. E 63, 031916 (2001). [25] A. A. Zaikin, J. Kurths, and L. Schimansky-Geier, Phys. Rev.
Lett. 85, 227 (2000).
[26] Y. Jia, S. Yu, and J. Li, Phys. Rev. E 62, 1869 (2000). [27] Y. Jia, X. Zheng, X. Hu, and J. Li, Phys. Rev. E 63, 031107
(2001).
[28] X. M. Liu, H. Z. Xie, L. G. Liu, and Z. B. Li, Phys. A 388, 392 (2009).
[29] P. Smolen, D. A. Baxter, J. H. Byrne, Amer. J. Physiol. Cell. Physiol. 274, 531 (1998); 277 (1999) C777.
[30] C. L. Zhu, Y. Zheng, and Y. Jia, Bioph. Chem 129, 49 (2007). [31] X. Q. Luo and S. Q. Zhu, Phys. Rev. E 67, 021104 (2003). [32] P. Hanggi and P. Jung, Adv. Chem. Phys. 89, 239 (1995). [33] L. Cao, D. J. Wu, and S. Z. Ke, Phys. Rev. E 52, 3228 (1995). [34] R. F. Fox, Phys. Rev. A 34, 4525 (1986).
[35] Y. Jia and J. Li, Phys. Rev. E 53, 5786 (1996).
[36] W. R. Zhong, Y. Z. Shao, and Z. H. He, Fluc. and Noi. Lett. 6, L349 (2006).
[37] C. J. Wang and D. C. Mei, Fluc. and Noi. Lett. 8, L213 (2008). [38] E. A. Novikov, Zh. Eksp. Teor. Fiz. 47, 1919 (1964); [Sov.
Phys. JETP 29, 1290 (1965)].
![FIG. 1: The schematic description of positive autoregulatory model [29]. TF-A denotes transcription factor, TF-RE responsive element, α transcription rate, β the basal rate of synthesis, P phosphorylated, κ 2 the degradation rate.](https://thumb-eu.123doks.com/thumbv2/123dok_br/18983499.457956/2.871.89.418.85.400/schematic-description-autoregulatory-transcription-responsive-transcription-phosphorylated-degradation.webp)