0103 - 5053 $6.00+0.00
Article
*e-mail: [email protected]
Activated Petroleum Coke for Natural Gas Storage
Manoel O. A. Méndez,a Antonio C. L. Lisbôa,*,a Aparecido R. Coutinhob and Choyou Otanic
a
Faculdade de Engenharia Química, Universidade Estadual de Campinas, CP 6066, 13083-970 Campinas-SP, Brazil
b
Faculdade de Ciências Exatas e da Natureza, Universidade Metodista de Piracicaba, Rod. SP 306, km 01, 13450-000 Santa Bárbara d’Oeste-SP, Brazil
c
Departamento de Física, Instituto Tecnológico de Aeronáutica, Pça. Mal. Eduardo Gomes, 50 Vila das Acácias, 12228-900 São José dos Campos-SP, Brazil
Carvões ativados (CA) são caracterizados por elevadas áreas superficiais específicas e elevados volumes de poros. Os principais processos de obtenção destes materiais consistem na ativação de precursores com elevado teor de carbono, como por exemplo, o coque de petróleo (CP). Neste trabalho CP foi ativado quimicamente com hidróxido de potássio (KOH). O produto
foi caracterizado por meio de adsorção de N2 a 77 K, apresentando elevada capacidade de
adsorção, com valores de volume de poros acima de 1,5 cm3 g-1 e área superficial específica de
até 2500 m2 g-1, com distribuições de tamanho de poros concentrada na região de supermicroporos
(diâmetros entre 0,7 nm e 2 nm). A temperatura de ativação e a razão de impregnação entre CP e KOH foram as variáveis mais significativas do processo. Análise por adsorção de CH4 em pressões elevadas indicou uma capacidade de armazenamento da ordem de 91 v/v (volume de metano armazenado por volume do leito).
Activated Carbons (AC) are characterized by high specific surface area and high pore volume. They are mostly produced by activation of high carbon content precursors, for example petroleum coke (PC). In the present work samples of PC were chemically activated with potassium hydroxide (KOH). The activated PC presented high capacities of N2 adsorption at 77 K, with pore volumes up to 1.5 cm3 g-1 and specific surface area up to 2500 m2 g-1. The pore size distributions obtained
indicate that the activated PC has pore sizes concentrated in the supermicroporous range (diameters between 0.7 nm and 2 nm). The temperature and the impregnation ratio used in the activation process were the variables that mostly affected the porosity of the activated PC. The storage capacity of the activated PC, obtained by methane adsorption at high pressure, was 91 v/v (methane volume stored by bed volume).
Keywords: petroleum coke, activated carbon, natural gas storage
Introduction
The terms activated carbon (AC) and carbon molecular sieve (CMS) are used to designate a wide range of amorphous carbonaceous materials based on carbon and with a high degree of porosity. AC and CMS are characterized by high specific surface areas and high pore volumes in the carbon matrix. The activated carbons used commercially possess specific surface areas between 800 m2 g-1 and 1500 m2 g-1, with porosity constituted mainly
of microporous, which have diameters smaller than 2 nm.
Brazil currently imports CMS to be used in several areas of science and technology and in many industries. AC belongs to the family of advanced carbon materials, due to its micropore characteristics, such as high surface area, high adsorption capacity and high reactivity.1-4
to increase the number and the volume of pores in the carbon matrix.5-9
Petroleum coke is a dark solid composed mainly of carbon, produced by the thermal decomposition and polymerization of heavy liquid hydrocarbon derived from crude oil.10 The coke produced from distillation residues
tends to form the sponge coke, while coke produced from a cracking residue form the premium coke. The sponge type, due to its practically amorphous structure, has little commercial value, and may be an economical and environmental problem.
According to the 2004 annual report of the Brazilian Petroleum Agency (ANP),11 Brazil produced approximately
1.5 × 10⁶ t of petroleum coke. Replan, the Petrobras refinery located in Paulinia, contributes with 40% of the total production, with a daily production of 1640 t of petroleum coke. In general, the type of coke produced by Brazilian refineries is the sponge one, originated from delayed coking units. This petroleum coke is either used for combustion in the refinery, or as load in other processes, such as cement production and in the metallurgical industry in which it is used for reduction. Among the applications, the most advantageous is the anode production. However, for this application, the petroleum coke used is the premium petroleum coke, only produced in a few units of the Brazilian petroleum industry.
The chemical activation of petroleum coke has been investigated since the 1980s by various investigators, who obtained specific surface areas in the range 80 m2 g-1 to
3000 m2 g-1, depending on experimental conditions.12-14 The
authors mention that the porosity of the resulting activated coke is influenced by the impregnation ratio (KOH/coke) and activation temperature, but there is no agreement regarding which variable is the most significant and how these variables affect the activated petroleum coke porosity. Recent research has shown that activated carbon and carbon molecular sieves can be used for natural gas storage, due to the higher density of the adsorbed phase in the surface of activated carbon.15-18
For such application the activated materials should have large surface area and pore volume. The objective of the present work was to develop a product with these characteristics starting with petroleum coke produced in the delayed coking unit of Replan\Petrobras.
Experimental
Petroleum coke samples were supplied by Petrobras from its delayed coking unit in Replan - Paulinia. The activation of these samples was carried out by using commercial grade nitrogen gas (N2) with the objective to prevent the oxidation
of petroleum coke in the thermal treatment. Potassium hydroxide (KOH) analytical grade was used as activating agentin all chemical activation experiments.
Thermogravimetric methods
Initially, thermogravimetric analysis (TGA) was used in order to evaluate the thermal behavior of the petroleum coke in several experimental conditions and also to obtain the process parameters for the subsequent activation experiments. In order to reduce the diffusive resistance and thermal resistance, the particle size of the samples
used in these analyses was smaller than 0.075 mm.
Analyses were made to evaluate the thermal behavior of petroleum coke when the samples were impregnated with potassium hydroxide at different impregnation ratio (defined as mass of KOH per mass of petroleum coke) conditions and different drying times. The KOH contents used in the TGA experiments were 0:1, 1:1 and 4:1. The drying times were 12 hours and 24 hours. All experiments were made with samples of 25 mg in a thermogravimetric analyzer from NETZCSH model TG209.
Differential thermal analysis (DTA) of the mixture petroleum coke, water and KOH were made in order to obtain the thermal behavior of this mixture. These experiments provided the thermal behavior of the mixture petroleum coke, water and KOH, i.e. process parameters such as evaporation temperature, heating rate of the mixture and rate of evaporation of the mixture. The impregnation ratio used in these experiments was 0:1, 4:0 and 6:1. The heating rate employed was 2.5 ºC min-1, with
all experiments starting at 30 ºC and ending at 600 ºC.
Chemical activation experiments
The chemical activation of the petroleum coke was carried out adapting the existing procedures mentioned in the literature.12-19 The process consisted of an initial stage of
impregnation, in which 50 g of petroleum coke were mixed with an amount of aqueous solution of KOH, according to a specific impregnation ratio. The resulting mixture was evaporated and then heated up to the desired activation temperature. This temperature was kept during the activation stage and the resulting solids were washed and neutralized.
Characterization of activated petroleum coke
area was determined by the BET model.20 The specific
surface area of microporous, the micropore volume and the ultramicropore volume were calculated by the t-plot comparative method using as reference the Halsey equation of statistical thickness.21 The total pore volume and the pore
size distribution were calculated using the Pierce method.22
The mesopore volume and supermicropore volume were calculated by the difference in the previous volume.
Results and Discussions
Thermogravimetric behavior of petroleum coke
The thermogravimetric analyses of petroleum coke indicate that the thermal decomposition is affected by heating rate. Figure 1 shows the thermogravimetric curve of the petroleum coke heated at 25 ºC min-1 and 50 ºC min-1.
Petroleum coke, when heated above 300 ºC, loses mass due to the volatile components present in the solid. These components are hydrocarbons remaining from the coking process, which when heated above 450 ºC are thermally cracked and volatilized. This behavior is observed by the change in the slope of the curve rate of mass loss versus temperature for the two heating rates used. The effect of the heating rate is related to the time of the thermal treatment associated with each heating rate. The higher the heating rate, the lower the mass removal from the petroleum coke because the total treatment time of the experiment is smaller.
Thermogravimetric behavior of petroleum coke impregnated with KOH
Thermogravimetric analyses with potassium hydroxide were made aiming to evaluate the reactivity of KOH with petroleum coke. Figure 2 shows thermogravimetric curves
of the samples impregnated with KOH and dried for 12 hours. It is observed that the amount of KOH impregnated in the petroleum coke affects the mass loss. The sample with 1:1 impregnation ratio loses mass earlier than the sample impregnated with 4:1, indicating differences in the reactivity of the KOH. However, the sample impregnated with 4:1 presented, at temperatures around 830 ºC, a rate of mass loss higher than the sample impregnated with 1:1. If this mass loss is associated with the generation of pores, this indicates that samples with higher impregnation ratio probably cause higher porosity development. Also, this indicates that the activations should happen more effectively at temperatures above 700 ºC.
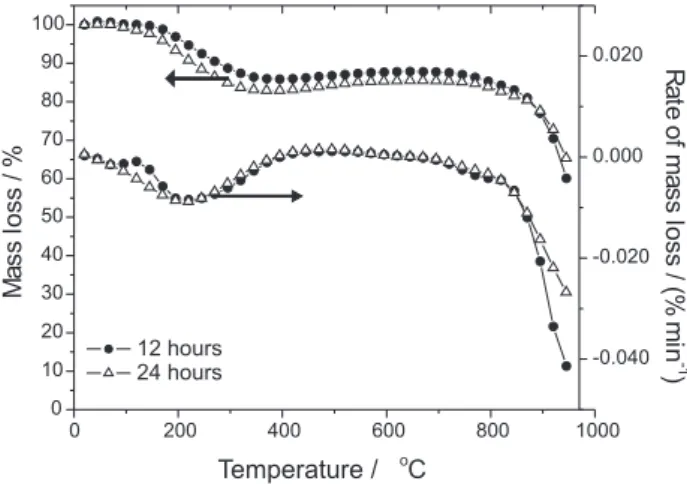
The drying time was evaluated by thermogravimetric analyses of impregnated samples dried with different times. Figure 3 shows the thermogravimetric curves of the samples impregnated with 1:1 dried for 12 hours and for 24 hours. The drying time affects the mass loss curve due to the initial loss of moisture not removed after 12 hours of drying. However, for both drying times used, the mass
Figure 1. Mass loss and rate of mass loss of petroleum coke as function of temperature and heating rate.
Figure 2. Mass loss and rate of mass loss of petroleum coke impregnated with KOH after 12 hours of drying.
loss curves presented the same behavior, indicating that the drying time only influences the amount of free water in the surface of the petroleum coke associated to KOH. For the samples impregnated with 4:1, Figure 4 shows no significant changes in the behavior of the curves as function of drying time. Both curves are similar because even for 24 hours of drying the amount of water in the surface of the sample cannot be removed.
Thermogravimetric analysis of petroleum coke/KOH/water mixture
To evaluate the behavior of the mixture made up of petroleum coke, KOH and water, thermogravimetric experiments were made in order to determine the rate of evaporation of the mixture and the evaporation temperature. Figure 5 shows the curves temperature of evaporation versus time for three mixtures with different impregnation ratio. For all curves in the figure 5 the beginning of the evaporation of the mixture occurs at 100 ºC approximately.
As the evaporation evolves, the mixture becomes more concentrated in KOH, changing the properties of the mixture and consequently changing the evaporation temperature of the mixture. This explains the differences found in the initial evaporation temperature and the changes in the temperature along the evaporation process. Adopting as reference the temperature of the furnace, the difference between the reference temperature and the mixture temperature allows to identify the moment that phase change begins (Figure 6), which is characterized by an increase in the difference between the reference temperature and the temperature of the mixture. For the impregnation ratio studied, the temperature difference reaches a maximum around 90 minutes. After this point, the mixture was completely evaporated and the temperature of the mixture attains equilibrium with the furnace temperature.
These data allowed to obtain the evaporation temperature of the system petroleum coke/KOH/water for the impregnation ratio used. The values presented in Table 1 correspond to the initial temperature of evaporation of the studied mixture.
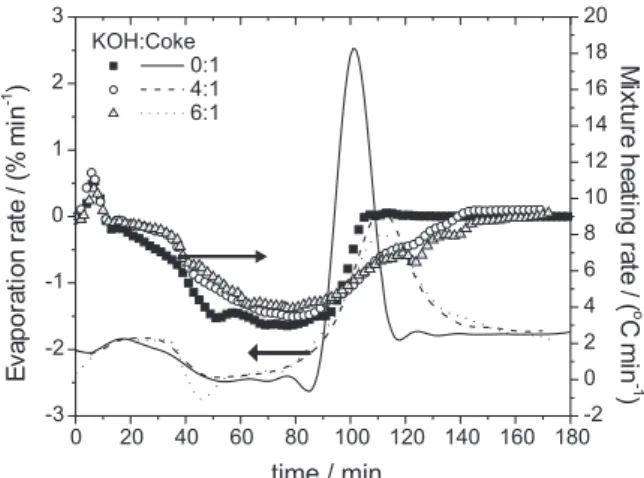
From the mass loss data it is possible to obtain the mass loss profile and the rate of evaporation as function of time. The result, presented in Figure 7, shows the behavior of the mass loss in the evaporation for different impregnation ratios.
Figure 5. Temperature behavior of the mixture with different impregna-tion ratios.
Figure 4. Mass loss and rate of mass loss of 4:1 petroleum coke impreg-nated with KOH after 12 and 24 hours of drying.
Table 1. Initial evaporation temperature for the mixture petroleum coke, KOH and water
Impregnation ratio Evaporation g KOH : g coke temperature / (ºC)
0:1 102
4:1 112
6:1 116
As the impregnation ratio increases, the beginning of the mass loss is delayed, due to the elevation of the evaporation temperature. However, the evaporation rates present a maximum value approximately constant for all impregnation ratio used.
The derivate of the evaporation temperature curve produces the heating rate of the mixture. In the Figure 8, which is the data of evaporation rate and heating rate plotted in the same graph, shows the region of heating rate that produce the lowest evaporation rate.
A maximum evaporation rate is inversely proportional to the impregnation ratio, and the heating rate of the mixture associated with this maximum is directly proportional to the impregnation ratio. This fact is also observed in Table 2.
Chemical activation of the petroleum coke
The experiments of chemical activation were carried out by varying the impregnation ratio from 2:1 to 6:1; the
average particle size from 0.9 mm to 2.9 mm; the activation temperature from 600 ºC to 800 ºC; and the activation time from 60 min to 180 min.
A complete characterization of the porous texture was made for the activated petroleum coke samples, which presented the highest values of BET specific surface areas. For comparison purpose, a sample of commercially activated carbon was also characterized. The commercial activated carbon used as reference is an activated carbon employed for gas separation produced by Norit Activated Carbon. The activated petroleum cokes selected for this characterization are designed by the name AQCP12, AQCP13, AQCP15 and AQCP28.
Figure 9 shows the adsorption/desorption isotherms of N2 at 77 K. The adsorption isotherm for the AQCP15 sample presented the highest values of adsorbed volume when compared with all other samples.
All samples presented typical type I isotherm indicating that the samples are essentially constituted by micropores. The fact that the isotherms do not present hysteresis phenomenon in the adsorption/desorption cycle indicates that the pores are essentially cylindrical ones, without a predominance of pores of funnel form or pores denominated inkbottle.
The samples pore size distribution calculated by the Pierce method is plotted in Figure 10.
Figure 8. Heating rate of the mixture and evaporation rate as function of impregnation ratio and heating time.
Figure 7. Mass loss and rate of evaporation as function of heating time and impregnation ratio.
Figure 9. Adsorption/desorption isotherms of N2 at 77 K for the four samples of activated petroleum coke and the reference sample Norit. Table 2. Maximum evaporation rate and related heating rate of the mix-ture, in function of the impregnation ratio
Impregnation ratio Maximum mass Heating rate of the g KOH : g Coke loss / (% min-1) mixture / (ºC min-1)
0:1 -0.015 0.195
4:1 -0.013 0.846
The curve for sample AQCP15 presented a distribution near the transition between microporous and mesoporous, but presented a maximum around 2 nm, which is the predominant pore size in this sample.
The Norit sample presented distribution also concentrated in the transition between microporous and mesoporous, however, due to the limitation of the Pierce method, it was not possible to find a maximum value in the distribution for the Norit sample. Comparing the distribution of the Norit samples with the distribution of the activated petroleum coke samples, it is observed that these have higher values and are more concentrated in the microporous region.
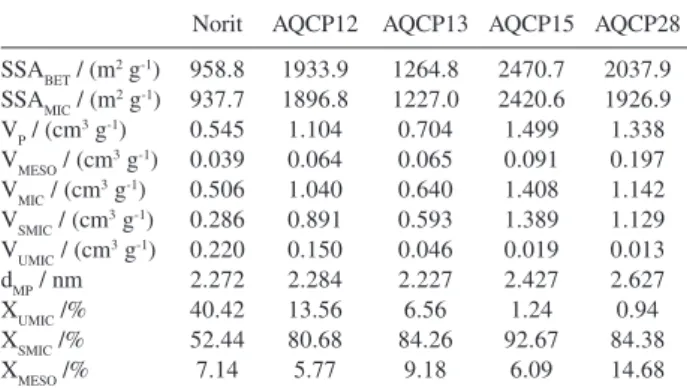
Table 3 presents all results obtained by the characte-rization of the petroleum activated carbon sample and the Norit sample. Comparing the values for specific surface area calculated by BET model it makes possible conclude that all activated petroleum coke samples present higher value than the Norit sample, with maximum value for sample AQCP15 with specific surface area of 2470 m2 g-1.
Figure 11 shows the comparative plot of the specific surface area obtained by BET.
Using the values of the t-plot for determining the micropore volume and ultramicropore volume, and the value of total pore volume obtained by the Pierce method it is possible to calculate the mesoporous volume and supermicroporous volume. Figure 12 shows the distribution of volume according to the range of porosity.
The Norit sample presents a volume distribution more concentrated in the range of ultramicroporisity and supermicroporosity with low volume content of mesoporous. When the Norit samples is compared with the samples of activated petroleum coke it is possible to conclude that the activated petroleum coke has a distribution of volume highly concentrated in the supermicroporosity range, indicating that this material can present characteristic of carbon molecular sieve due to the effect of kinetic selectivity in adsorption processes.
Figure 10. Pore size distribution as function of average pore size for the samples of activated petroleum coke and reference sample Norit.
Table 3. Porous characteristic of the activated petroleum coke samples and the reference sample Norit
Norit AQCP12 AQCP13 AQCP15 AQCP28
SSABET / (m2 g-1) 958.8 1933.9 1264.8 2470.7 2037.9 SSAMIC / (m2 g-1) 937.7 1896.8 1227.0 2420.6 1926.9 VP / (cm3 g-1) 0.545 1.104 0.704 1.499 1.338 VMESO / (cm3 g-1) 0.039 0.064 0.065 0.091 0.197 VMIC / (cm3 g-1) 0.506 1.040 0.640 1.408 1.142 VSMIC / (cm3 g-1) 0.286 0.891 0.593 1.389 1.129 VUMIC / (cm3 g-1) 0.220 0.150 0.046 0.019 0.013 dMP / nm 2.272 2.284 2.227 2.427 2.627 XUMIC /% 40.42 13.56 6.56 1.24 0.94 XSMIC /% 52.44 80.68 84.26 92.67 84.38 XMESO /% 7.14 5.77 9.18 6.09 14.68
Figure 11. Comparison between specific surface area BET and specific surface area of microporous.
Conclusions
The chemical activation of the petroleum coke samples used in this work allows conclude that the developed process is appropriate for production of activated petroleum coke with high levels of adsorption capacity.
Also the activated petroleum coke produced presents high values of specific surface area, up to 2500 m2 g-1 and
high values of pore volumes, up to 1.5 cm3 g-1. When these
materials were compared with a commercial activated carbon, they presented higher values in several properties (specific surface area and volume of pores), characteristics that indicate the possibility of the activated petroleum coke be used for natural gas storage, due to the narrow distribution of pore size presented in the range of supermicroporosity. The process developed and used in this work indicates the possibility of transforming the petroleum coke in a product with higher commercial value.
Acknowledgments
The present work was supported by FAPESP (Fundação de Apoio a Pesquisa do Estado de São Paulo), Multivácuo and Petrobrás with financial support of the experimental work, and Refinery of Paulínia (Replan) of Petrobras that supplied the petroleum coke samples.
References
1. Gonzáles, M. T.; Molina-Sabio, M.; Rodriguez-Reinoso F.;
Carbon 1994, 32, 1407.
2. Bansal, R. C.; Donnet, J. B.; Stoeckli, F.; Active Carbon, Marcel
Dekker Inc.: New York, 1988.
3. Jankowska, H.; Swiatkowski, A.; Chomma, J.; Active Carbon,
Ellis Horwood Limited: New York, 1991.
4. Marsh, H.; Introduction to Carbon Science, Butherworts: UK,
1989.
5. Walker, W.; Chemistry and Physics of Carbon, Marcel Dekker:
New York, 1968.
6. Coutinho, A. R.; Mendez, M. O.; Capobianco, G.; Otani, C.; Petraconi, G.; Maciel, H.; Massi, M.; Urruchi, W.; Campos, F. B.; Campos, M. F.; Furini, R.; Anais da Rio Oil & GásExpo
and Conference, Rio de Janeiro, Brazil, 2004.
7. Coutinho, A. R.; Méndez, M. O. A. Anais do III Encontro
Brasileiro Sobre Adsorção, Recife, Brazil, 2002.
8. Coutinho, A. R.; Luengo, C. A. In Advances Thermochemical
Biomass Conversion; Bridgewater, A.V., ed.; Blakie Academic:
Londres, 1994, vol. 2, p. 1230.
9. Pis, J. J.; Parra, J. B.; Puente, G.; Rubiera, F.; Pajares, J. A.;
Fuel 1998, 77, 625.
10. Janssen, H. R. In Ullmann’s Encyclopedia of Industrial
Chemistry, Janssen, H. R.; Roussel, K., eds.; VCH: New York,
1991, vol. A19, p. 235.
11. http://www.anp.gov.br/conheca/ anuario_2003.asp, Acessed in June 2004.
12. Marsh, H.; Yantom, D. S.; O’Grady, M.; Wennerberg, A.;
Carbon 1984, 22, 603.
13. Otawa,T.; Nojima, Y.; Miyazaki, T.; Carbon 1997, 35, 1315.
14. Barbosa Mota, J. P.; Rodrigues, A. E.; Saatdjian, E.; Tondeur,
D.; Carbon 1997, 35, 1259.
15. Lee, S. H.; Choi, C. S.; Fuel Process. Technol. 2000, 64, 141.
16. Biloe, S.; Goetz, V.; Guillot, A.; Carbon 2002, 40, 1295.
17. Chang, K. J.; Talu, O.; Appl. Therm. Eng. 1996, 16, 259.
18. Lillo-Ródenas, M. A.; Cazorla-Amorós, D.; Linares-Solano,
A.; Carbon 2003, 41, 267.
19. Lozano-Castelló, D.; Lillo-Ródenas, M. A.; Cazorla-Amorós, D.; Linares-Solano, A.; Carbon 2001, 39, 741.
20. Gregg, S. J.; Sing, K. S. W.; Adsorption, Surface Area and
Porosity, 2nd ed., Academic Press: Londres, 1982.
21. Figueiredo, J. L.; Órfão, J. J. L.; 2o. Curso Ibero-Americano
sobre Caracterização de Catalisadores e Adsorventes, São
Carlos, Brazil, 2001.
22. Lowell, S.; Shields, J. E.; Powder Surface Area and Porosity,
3rd ed., Chapman and Hall: Londres, 1991.
Received: March 5, 2006 Published on the web: August 30, 2006