0103 - 5053 $6.00+0.00
A
r
ti
c
le
*e-mail: [email protected]
Characterization of Copper Adsorption on Oxidized Activated Carbon
João Paulo de Mesquita, Patrícia B. Martelli and Honória de Fátima Gorgulho*
Departamento de Ciências Naturais, Universidade Federal de São João del Rei, Campus Dom Bosco, Praça Dom Helvécio, 74, 36301-160 São João Del Rei- MG, Brazil
Esse artigo discute a adsorção de íon Cu(II) em carvão ativado oxidado com HNO3. As modificações introduzidas na superfície do carvão ativado (CA) foram caracterizadas por medidas de área superficial, espectroscopia de absorção no infravermelho, titulação pelo tradicional método de Boehm e titulação potenciométrica. Os dados da titulação potenciométrica foram ajustados através de um método não linear desenvolvido para determinar a concentração e distribuição do pKa dos sítios ácidos ionizáveis presentes na superfície do CA, antes e após a oxidação com HNO3. Os estudos de adsorção foram realizados em batelada para a faixa de concentração de 0,08 a 1,75 mmol L-1 em pH = 4,0. Os resultados mostraram que o tratamento
do CA com ácido leva à diminuição na área superficial aparente e produz leves modificações na estrutura de poros. Entretanto, a oxidação influenciou fortemente a estrutura química da superfície do CA através do aumento na concentração de grupos ácidos com pKa < 6, causando assim uma melhora significativa na adsorção do íon Cu(II). A maior capacidade de adsorção do CA oxidado foi relacionada à presença de grupos ácidos com pKa < 4, revelando o importante papel destes grupos na adsorção pelo mecanismo de troca iônica.
This paper discusses Cu(II) ion adsorption onto oxidized activated carbon with HNO3. The modifications introduced on the activated carbon (AC) surface were characterized by surface area measurement, FT-IR spectroscopy, titration by the traditional Boehm procedure, and potentiometric titration. A nonlinear method for fitting acid-base potentiometric titration data was applied to determine the concentration and pKa distributions of the ionizable acidic sites on AC, before and after HNO3 oxidation. Adsorption studies were conducted in batch mode for the concentration range 0.08 to 1.75 mmol L-1 and pH = 4.0. Results showed that the acid
treatment of AC leads to a decrease in apparent surface areas and produces slight modifications in pore structure. However, oxidation strongly influenced the AC surface chemical structures by increasing the concentration of acidic groups with pKa < 6.0, which significantly improved Cu(II) ion adsorption. The uptake enhanced for oxidized carbon was related to the presence of acidic groups with pKa lower than 4, revealing the important role of acidic groups in adsorption by ion-exchange mechanisms.
Keywords: activated carbon, copper adsorption, potentiometric titration
Introduction
In many countries, toxic heavy metals in wastewater have become an important concern lately because of their harmful environmental impact, which creates the need for water recycling. The presence of heavy metals in the environment can be detrimental to a variety of living species and copper is one of the most toxic metals to
marine life and human beings.1 Environmental
contamination due to copper is primarily caused by mining, printed circuits, metallurgical and fiber
production, pipe corrosion, and metal plating industries.2
Agricultural inputs such as fertilizers, fungicidal sprays, and animal waste also lead to water pollution due to copper. Copper neurotoxicity has been reported to cause “Wilson’s disease”, which is characterized by copper build-up in the brain lenticular nucleons and by kidney
failure.1 Therefore, the elimination of heavy metals such
as copper from water and wastewater is important for public health.
Many methods have been proposed for the removal of heavy metals from water, including chemical precipitation,
membrane filtration, ion exchange, and adsorption.3-5 Each
are very versatile and efficient, and have received considerable attention in recent years. Activated carbon (AC) is an effective absorbent of many organic substances in water. In contrast to organic pollutants, AC does not remove water-dissolved metal ions and inorganic compounds effectively. The hydrophobic graphene layer makes its interaction with hydrated ions difficult. Therefore, the adsorption capacity and feasible removal rates must be substantially improved by the modification
of the AC surface with suitable chemicals.6-8 For this
reason, modification and impregnation techniques have been used to increase AC surface adsorption and removal capacity as well as to add selectivity to carbon.
However, ACs are not widely used due to their questionable regenerability, which depends on the mechanism of the metal ion adsorption. A variety of interactions between cationic species and the carbon surface might occur, such as, formation of surface complexes, ion-exchange processes, and redox reactions. Understanding the interaction of metal ions with the carbon surface is essential to control the sorption and desorption processes applicable to AC.
Previous investigations have demonstrated that the presence of oxygenated groups on the surface of AC favors metal adsorption through the formation of metal
complexes.8 In general, this process is considered an ion
exchange reaction with the participation of a strong acidic
surface groups.9,10
[surface] nH+ + Mn+ (aq) [surface] Mn++ nH+ (aq) (1)
AC chemical oxidation by nitric acids is one of the most effective means to provide acidic carboxylic and phenolic
groups to AC surface.10,11 However, due to the carbon surface
heterogeneity, the carboxylic group introduced exhibits a range of acid dissociation constants (Ka), depending on the neighboring groups and the size of the graphene layer. As a result, the types of acidic groups (Ka) that display ion-exchange properties are insufficiently known. These difficulties are connected with the structural uncertainty of the adsorption sites on heterogeneous surfaces.
Determining the concentration and Ka of the acidic groups on the AC surface is the first step to characterize acidity, ion exchange capacity, and charge accumulation properties. Potentiometric titration is frequently used to
study the acid-base properties of solid surfaces.12,13 Linear
and non-linear numerical analysis techniques are commonly used in the treatment of potentiometric data
for humic acids, proteins, and chitosan.14-16 The complexity
of these equations has evolved along with computers and software and the calculation load.
The main objective of the present study was to investigate the relation between copper adsorption and desorption processes on activated carbon, and the nature
(pKa) of the generated acidic sites on AC surface. HNO3
was used under reflux to oxidize the carbon surface.
Oxidized AC was extracted with NH4OH instead of the
typically used NaOH. Washing with NaOH solutions effectively dissolves the soluble residues generated during
oxidation; however, Na+ ions cannot be completely
eliminated during the thermal treatment and can remain
in the micropores.17 In contrast, the use of NH
4OH under
reflux ensures that only H+ and OH– ions occupy the
surface acidic and basic sites after rinsing with water and drying at 100 °C.
Potentiometric titration in aqueous medium and data numerical analysis by nonlinear regression techniques have been used in order to distinguish acidic groups with different Ka on AC. The model used in the present study
is based on the studies of Masini and co-workers,18,19 which
was developed for humic acids and polyelectrolytes. These authors assumed that the ionizable groups behave as a
mixture of N monoprotic acids. Ka would be dependent
not only on the chemical identity of the ionizable group, but also on the local interactions due to the chemical and physical media where the group is located on the surface of AC. The effects of charge accumulation on Ka were neglected in this model.
Experimental
Materials
Activated carbon (AC) (Fluka) was washed with distilled water and dried at 100 °C for 24 hours. Next, AC was cooled in a desiccator containing silica gel and stored in a bottle labeled Raw Activated Carbon (RAC). RAC was used to produce the oxidized activated carbon, named Modified Activated Carbon (MAC).
The copper solutions used in the equilibrium experiments were prepared with deionized water and
CuSO4•5H2O (Biotec). The analytic curve was obtained
with Titrisol Merck solution. All chemicals were reagent grade.
Preparation of MAC
RAC was refluxed with an HNO3 (VETEC) solution
(50% m/v) at boiling temperature for 2 hours. Next, the oxidized carbon was washed with distilled water, followed
by reflux of 1.0 mol L-1 of NH
extractor at 100 °C with distilled water for removal of the residual base and byproducts. The product (MAC) was dried at 100 °C for 24 hours.
Textural properties
Sample textural characterization was performed by N2
adsorption at 77 K in a NOVA 300 BET analyzer (Quanta Chrome, USA). Pore size distributions were obtained by applying the density functional theory (DFT) method to
N2 adsorption isotherms.
FT-IR spectrum of AC
Sample FT-IR spectra were recorded in a Perkin-Elmer
1720 FTIR spectrometer in the 350-4000 cm-1 wave
number range. Powder samples were diluted in KBr (Merck for spectroscopy) in an approximate ratio of 1/500. The resulting mixture was pressed into pellets and oven-dried at 110 °C for at least 20 hours. Spectra were
obtained with 60 scans and resolution of 8 cm-1. The KBr
spectra were subtracted as blank.
Acid-base properties-Boehm titration method
The method proposed by Boehmwas used to estimate
the acid-base properties of RAC and MAC samples.20 It is
well known that surface chemical groups are more complex than shown by Boehm’s titration, but this method gives a semi-quantitative measure of surface functionalities. Boehm’s method is based on acid-base titration of carbon acidic or basic centers. Consequently, selective neutralization of surface groups by equilibration with a series of bases with increasing strength was
conducted as follows: NaHCO3 neutralizes carboxylic
groups; Na2CO3 neutralizes carboxylic groups and also
allows lactonic groups to open and form carboxylic groups, which are then neutralized; NaOH neutralizes carboxylic, lactonic, and phenolic groups.
Four parts of carbon samples were weighed (about 0.2500 g each) and placed in four separate bottles. Next,
20 mL of 0.0500 mol L-1 of different bases, NaHCO
3 (SINTH), Na2CO3 (SINTH), and NaOH (MERCK), were
transferred to bottles containing the previously weighted carbon samples. A blank was prepared for each experimental condition. The bottles were degassed with
N2, closed and shaken for 48 hours. The solutions were
then filtered and the amounts of each reagent adsorbed
were determined by titration with HCl 0.0500 mol L-1.
The procedure was repeated for two other amounts of carbon samples (0.1000 g).
Acid site concentration was calculated by the average
of the amounts obtained for each mass: ,
where “c bar” stands for the mean; ci is the value of each
concentration; n = 3 is the number of experiments. The
standard deviation was obtained by: .
Potentiometric titration
Potentiometric titration was performed in triplicate for each sample with three different amounts (0.2500, 0.1000, and 0.0250g). The carbon mass was added to the
electrochemical cell with 0.7 mL HCl 0.1240 mol L-1 under
N2 atmosphere and ionic force adjusted to 0.10 mol L-1
with KCl, making a total volume of 20 mL. The pH was monitored until equilibrium was reached; next, NaOH
(MERCK) 0.0950 mol L-1 titration was started. The
experiment was performed with an automatic micro burette system Titroline ALPHA (SCHOTT S.A.) interfaced with a microcomputer. Titration was conducted with 0.0100 mL injections at intervals of 100 s.
Potentiometric titration modeling
The nonlinear regression program used in this work to fit potentiometric titration data makes use of a general equation that describes the titration of the mixture of a
strong acid with N weak acids (surface groups).18,19
(2)
where [H+
i] is the hydrogen ion concentration ([H+i]=
10-pHi), V
i is the titrant volume added, and V0 is the initial
volume in the potentiometric cell before starting titration.
VHA0 is the equivalent volume for the excess strong acid.
VHAn and KHAn are the equivalent volume and the ionization
constant, respectively, for the N acids present on the
surface, and Cb is the base concentration (mol L-1).
Through the minimization of the square sum S (error):
(3)
where m is the total number of experimental data (V, pH),
the parameters VHAn and KHan are adjusted. Calculation is
started with the input of initial values of VHAn and KHan
(guesses). With the PEGASO iteractive method, the best
approximations for the pHi(calc) values are obtained with
(4)
where the values of the functions f(pHi,k-1 ), f(pHi,k) and
pHi,k-1 and pHi,kare chosen according to the conditions:
if f(pHi,k+1).f(pHi,k) < 0, than
[pHi,k-1,f(pHi,k-1)] is exchanged for [pHi,k, f(pHi,k)]
if f(pHi,k+1).f(pHi,k) > 0, than
[pHi,k-1,f(pHi,k-1)] is exchanged for [pHi,k, f(pHi,k-1)].
The iteractions are carried out until the condition [(pHi,k+1 - pHi,k) / pHi,k] < 0.00001 reach the limit.
The obtained H+ concentration relative to pH (calc)
was corrected through the ion activity coefficient at the respective ionic force, resulting in the effective concentration (ion activity).
(5)
where Ci is the H+ concentration and fi is the activity
coefficient calculated with the equations:
fi = 10
(Debye-Hückel equation used for µ < 0.20 mol L-1)
fi = 10
(Davies equation used for 0.20 < µ < 0.60 mol L-1)
where α is the ion size in angstroms (1.10-10 m), Z is the
ion charge, and m is the ionic force of the solution obtained
with the equation . After calculating all
pH(calc) values, equation (2) was used to obtain the S
value.
The parameters VHAn and KHan were adjusted by the
Gradient method, with which the shift value of each
parameter VHAn and KHan initially guessed through
equations 6 and 7 have been calculated:
(6)
(7)
where ΔP is a fixed parameter that determines the size of
the step in the direction of the gradient vector.22 To
calculate the value of f ’(KHAn) and f ’(VHAn), one of the
parameters is incremented while all other parameters are kept constant. The process previously described is repeated for a new error-value calculation:
. This same procedure is
conducted for all parameters to calculate the values of S2,
S3,..., Sn. The values of f’(KHAn) and f’(VHAn) are obtained
with equations where
dx is the increment value. The module of the gradient vector is calculated with the equation
. Results of this equation are used to calculate the values of dVHAn and dKHAn, which, in turn, are used to update
the values of VHAn and KHan. Thus, by using these new
values, the procedure described above is used again to
obtain the values of S, S1, S2,...,Sn values. The calculation
sequence is repeated until a minimum S value is reached. The program was developed in MATLAB 6.5.
Adsorption isotherms
Each isotherm point was determined using 0.5000 g of AC samples added to 50 mL of a copper solution of known concentration. The solution pH was adjusted
by adding H2SO4 dropwise. The experiments were
conducted at initial pH 4.0. Copper solution concentration was varied from 0.0850 to 1.7500 mmol
L-1. The bottles were placed on a shaker
(TECNAL-TE-140) at 25 °C for 24 hours. The initial and final solution concentrations were measured in an atomic absorption spectrometer VARIAN SpectrAA at 20–400 nm. The final solution pH was also measured. One
variation of this procedure was the addition of Na2SO4
to the copper solution to keep the ionic strength at 0.10
mol L-1, that is to say, the experiment was also
conducted with constant ionic strength.
Desorption isotherms
For the desorption study, AC samples slurries were filtered out of the isotherm adsorption copper solutions and rinsed with deionized water. The rinsed carbon was transferred to an Erlenmeyer flask with 50 mL HCl 0.10
mol L-1. The flasks were placed in the shaker at 25 °C
for 24 hours. The final solution concentrations were measured in an atomic absorption spectrometer VARIAN SpectrAA at 20–400nm.
pH-monitored adsorption experiments
experiments; however, instead of shaking the bottle, the flasks were connected to a pHmeter Quimis 400ms with an Ag/AgCl combination glass electrode. The system was assembled to automatically measure pH as a function of time during the entire adsorption process. In the end, pH of the AC/solution system was obtained before and after adsorption of copper for each concentration.
Isotherm model
Surface adsorption can be described by the association/ dissociation reaction:
A + B AB (8)
where A represents the chemicals and B represents the adsorption centers in solid substrate. At low concentrations in a homogeneous system, the relation observed is:
[AB] ∝ [A] (9)
which can be described by the Langmuir isotherm:
(10)
where q is the concentration of adsorbate on the solid
phase (mmol g-1), K is the Langmuir constant (L mmol-1),
which is a direct measure of adsorption intensity, also called affinity constant, Q is a constant related to the area occupied by an adsorbate monolayer reflecting maximum
adsorption capacity (mmol g-1), and C is the equilibrium
concentration in liquid phase (mmol L-1).
The Langmuir isotherm parameters Q and K were evaluated by using Microsoft Origin 6.1 (Northampton, MA, USA) nonlinear curve fitter, which minimizes the value of Chi-square by varying the fitting parameters.
Chi-square is defined as: , where y is a
fitted value (model value) for a given point, yi is the point
measured datum value and σi is an estimate of the standard
deviation for yi. When Chi-square is minimized, the
Coefficient of Determination (R2) value tends to decrease
to 1. The parameter value and the standard error estimates were reported as calculated by the Origin program.
Results and Discussion
Surface textural characteristics
The surface area and porosity of the carbon materials used are compiled in Table 1. The acid treatment of RAC
led to a decrease in apparent surface areas and also produced slight pore structure modifications.
As already reported by other studies, decreases in the BET surface area are due to blocking of the narrow pores by the surface complexes introduced by the nitric acid
treatment.10 Therefore, HNO
3 oxidation strongly
influences the chemical structures of the AC surface as further discussed.
Boehm’s titration
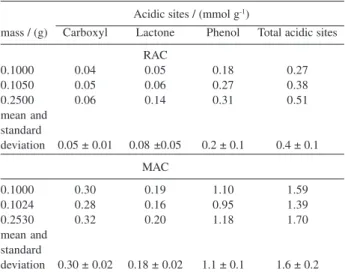
Changes on surface acidity due to the nitric acid treatment were quantified by Boehm’s titration and are summarized in Table 2. The most usual sources of error in this method are sample heterogeneity and granulometry. However, because the samples used in this work have similar textural properties (Table 1) satisfactory result was obtained, Table 2.
Interestingly, few carboxylic acids groups were detected on RAC surface by this method, whereas the MAC sample exhibited a significant amount of acidic
centers (pKa ≤ 5.0) introduced by HNO3 oxidation.
Indeed, the oxidation treatment increased by fourfold the total number of acidic sites in MAC. It is clear, therefore, that the nature of the surface chemical
structure of AC was significantly altered by the HNO3
and NH4OH treatments.
Table 1. Summary of textural characterization
Sample Area / Average pore / Total Pore / (m2 g-1) diameter (Å) volume (cm3 g-1)
RAC 770 34.39 0.65
MAC 670 31.21 0.52
Table 2. Result of acidity distribution from Boehm’s titration
Acidic sites / (mmol g-1)
mass / (g) Carboxyl Lactone Phenol Total acidic sites
RAC
0.1000 0.04 0.05 0.18 0.27
0.1050 0.05 0.06 0.27 0.38
0.2500 0.06 0.14 0.31 0.51
mean and standard
deviation 0.05 ± 0.01 0.08 ±0.05 0.2 ± 0.1 0.4 ± 0.1
MAC
0.1000 0.30 0.19 1.10 1.59
0.1024 0.28 0.16 0.95 1.39
0.2530 0.32 0.20 1.18 1.70
mean and standard
Fourier Transform Infrared analysis
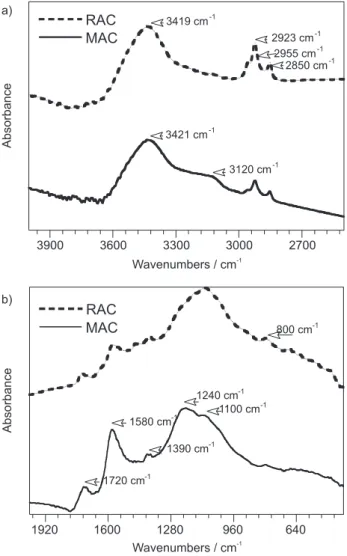
Fourier Transform Infrared (FT-IR) spectra of RAC and MAC (Figure 1) show two important regions; the first
between 4000 and 2500 cm-1 and the second at a lower
frequency, below 2000 cm-1. In the higher wavelength
region, an absorption centered at 3420 cm-1 could be
distinguished, typical of δ(OH), for both samples. This
absorption can be attributed to the presence of phenolic, lactonic, and carboxylic groups. In spite of the regional strong interference of water absorption, which prevented us from drawing conclusions, some differences among the spectra are clearly shown.
The presence of the carboxylic groups is usually confirmed by observing the stretching of these absorptions to lower energy values due to the hydrogen bond effect. This behavior is mainly observed for MAC samples, with
a shoulder centered at 3120 cm-1 characteristic of the
hydrogen bond of the carboxylic groups present on the
surface.23 In addition, the broad band centered at ≈1100
cm-1 and attributed to δ(OH) confirms the presence of
phenolic and carboxylic structures in RAC and MAC samples.
The spectrum region is 1800-400 cm-1 where one
normally observes the overlapping of several absorption bands that can be shifted to lower wavelengths by conjugation with the aromatic ring. In this range, the
absorptions defined at 1734 cm-1 for RAC and at 1720
cm-1 for MAC are typical of the axial deformation of the
C=O groups.24 At this range, a second absorption typical
of the C=C bond in aromatic rings centered at 1580 cm-1
was observed for both samples.
Chingombe et al.25 reported that HNO3 oxidation
introduces small amounts of nitrogen as NO2 groups,
observed as pronounced peaks at 1240 cm-1 attributed to
ν(C-N) vibration. In accordance with these observations,
the spectra of MAC at 1240 cm-1 showed a more
pronounced band than the one observed for RAC in the
same position, suggesting the presence of ν(C-N)
absorption of the NO2 group. The positively identification
of its absorptions on the spectra is difficult because of
several overlapping bands, such as ν(C-O) and ν(O-H)
vibrations.
In general, FT-IR results show that the RAC surface was modified by the introduction of carboxylic groups, as evidenced by the MAC spectrum.
Potentiometric titration
In potentiometric titration experiments, the time intervals between each titrant addition and tolerance of pH variation define a pH stability criterion that characterizes the severity imposed on ensuring
equilibrium.26 The reproducibility of potentiometric
titration results requires sufficiently long periods so as to ensure that acid-base equilibrium was reached. Thus, the best experimental conditions for the samples were studied first. In these experiments, the automatic titration procedure was studied as a function of the amount of sample, titrant dose, and time interval. After the preliminary tests, the time parameter of 100 s and titrant dose of 0.01 mL were fixed to perform the experiments. Figure 2 shows the raw titration data recorded as a function of the HCl volume added to MAC and RAC samples for duplicated experiments. It is clear in Figure 2 that stable and reproducible conditions were obtained in these conditions for both samples.
Sample mass impact on potentiometric titration was studied by means of experiments with different amount of AC and the non-linear program to calculate pka Figure 1. FT-IR spectra of RAC and MAC carbon samples. a) 4000 to
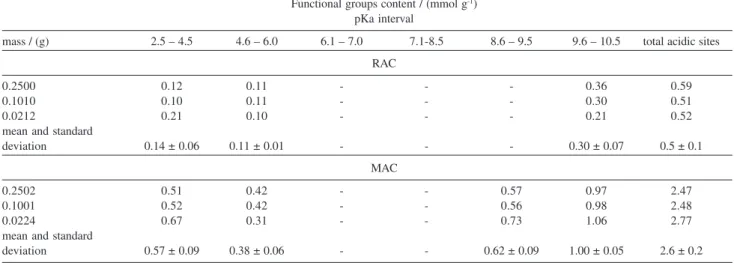
distribution and acid concentration. The number of sites was based only on the statistical test described in equation 3. Fitting was started by assuming the presence of the three kinds of sites (carboxylic, lactones, and phenolic groups), based on Boehm’s titration and FT-IR analyses. After the preliminary result, sites were added to the model until no statistically significant improvement was observed. The results obtained by fitting the experimental data are presented in Table 3. Notice that for the same samples the pKa distributions obtained by fitting are independent of the mass amount, which adds credibility to the measurement.
However, Table 3 shows that the acid site concentration increased slightly as the sample amount reduced. Such a behavior can be caused by high sample dilution associated with mass decrease. Thus, the equilibrium condition may be enhanced by additional contact between sample and solution. However, the total concentrations of acid groups determined for each AC were very similar and reflects the reproducibility and accuracy of the potentiometric titrations measurement.
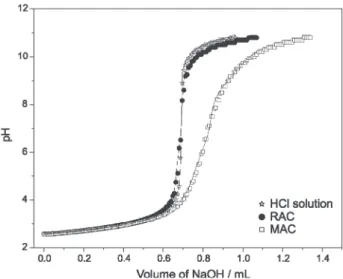
Figure 3 shows the experimental and fitted (nonlinear method) potentiometric titration curves of RAC and MAC samples. It is important to note that the titration curves (experimental and calculated) overlapped fairly well. The observed MAC titration curves had a larger buffer zone than RAC as a result of the increase in acidic sites concentrations.
Table 3 shows that in pKa range lower than 6.0, RAC and MAC samples were characterized by similar acid strength distribution but different number of acid sites concentration. In this pKa range, acid concentration increased approximately fourfold for MAC in relation to RAC. On the other hand, for pKa range higher than 7.0,
Table 3. Result of nonlinear regression fitting for potentiometric titration curves
Functional groups content / (mmol g-1) pKa interval
mass / (g) 2.5 – 4.5 4.6 – 6.0 6.1 – 7.0 7.1-8.5 8.6 – 9.5 9.6 – 10.5 total acidic sites
RAC
0.2500 0.12 0.11 - - - 0.36 0.59
0.1010 0.10 0.11 - - - 0.30 0.51
0.0212 0.21 0.10 - - - 0.21 0.52
mean and standard
deviation 0.14 ± 0.06 0.11 ± 0.01 - - - 0.30 ± 0.07 0.5 ± 0.1
MAC
0.2502 0.51 0.42 - - 0.57 0.97 2.47
0.1001 0.52 0.42 - - 0.56 0.98 2.48
0.0224 0.67 0.31 - - 0.73 1.06 2.77
mean and standard
deviation 0.57 ± 0.09 0.38 ± 0.06 - - 0.62 ± 0.09 1.00 ± 0.05 2.6 ± 0.2
the distribution of acid sites of the MAC sample was divided into two groups as follows: pKa range 9.6-10.5, which is also observed for RAC, and pKa range 8.5-9.5, not observed for RAC.
If the surface groups are expected to have acid strengths similar those of the organic acids with similar structures, the acid strengths of various organic acids can be referred for evaluation of the chemical structures on AC surface. The acid strengths of carboxylic acids such as benzoic acid, toluic acids, and some other aromatic carboxylic acids have a pKa around 5.0. Phenols such as phenol, pyrocatechols, and naphthols have a pKa above 9.0. However, the acid strength of these organic groups can be intensified by electrophilic substitution in the aromatic ring. This considerations suggest that the acidic groups on AC samples could be properly classified into two groups; the strong acids (for pKa range lower than 6.0), mainly comprising carboxylic acids, and the weak acids (with pKa higher than 7.0), comprising phenolic hydroxides.
Copper adsorption isotherms
Metal ions exist not only as single components but also as several species in solution, which leads to adsorption interference and competition phenomena. Therefore, soluble metal species that predominate in aqueous solutions should be evaluated before Cu(II) ion adsorption on AC is investigated.
Species percent concentration was found at working pH and concentration with the software VISUAL
MINTEQ.27 Figure 4 illustrates the distribution of
predominant copper species in aqueous solution at pH 4.0 for different concentration values.
According to the speciation result for pH 4.0, the hexaquo Cu(II) complex was the predominant species at the isotherm concentration range. On the other hand, sulfate concentration increases with the addition of
Na2SO4 salt led to increase the concentration of CuSO4
species, Figure 5. Consequently, the effect of the common ion can modify the distribution profile of the metal species in solution as well as interfere in the adsorption mechanism.
Adsorption isotherms
RAC and MAC sample Cu (II) ion adsorption
isotherms were obtained with and without 0.10 mol L-1
Na2SO4 to vary the solution ionic strength. All isotherms
and the Langmuir equation fitting are depicted in Figure 6. The parameters obtained with Langmuir’s model are summarized in Table 4. These data show that AC oxidation largely increased Cu (II) uptake despite the decrease in surface area and porosity. The same behavior was found for other oxidized carbon and metal ion
systems.28,29
Figure 3. Potentiometric titration curves obtained by employing masses of approximately 0.0220 g for the AC samples. The solid line represents the curve obtained by the program used in this work.
Figure 4. Predominant species calculated by VISUAL MINTEQ for CuSO4 solutions, pH=4. Abscissa: total Cu(II) ion concentration. Ordi-nate: species percent.
Figure 5. Predominant species calculated by VISUAL MINTEQ for
Maximum copper adsorption capacity values (Q) on
MAC and RAC samples in the absence of Na2SO4 (Table
4) were ≈ 3.5 times greater for MAC than for the untreated
sample, as a consequence of proportional increase in acidity. The correlation between the increase in the number of acid sites (380%) for a pKa <6.0 and the increment in adsorption capacity of MAC (350%) is noteworthy.
Langmuir constant values, K, were larger for MAC than for RAC, probably due to the largest affinity between MAC surfaces and copper ions. At first, the standard deviation observed for this parameter may seem very high, however, it must be noted that the K value given in Table 4 was obtained for a larger concentration range, covering low concentrations, whose affinity is high, and for high concentrations, whose surface saturation decreases the affinity between the Cu(II) ion and the surface. This was particularly important for RAC, because its saturation occurred at lower concentrations than those of MAC. Thus, it is important to understand that the accuracy of the parameters in Table 4 must be evaluated with respect to the concentration window. Therefore, the parameter fitting standard errors are not excessively large because the Langmuir isotherm was fitted to both saturation and sub-saturation regions.
The effect of Na2SO4 addition on the adsorption
isotherms shows that adsorption capacity decreased sharply for both samples (Table 4). It is interesting that the MAC affinity constant (K) was also significantly
affected by the presence of Na2SO4. The ionic solution
strength is a key factor in the control of electrostatic interactions because of a screening effect of the surface charge produced by the added salt. Attraction or repulsion interactions can be reduced increasing the ionic strength
of the solution.28
However, as the copper speciation with VISUAL
MINTEQ programmer has shown, Cu2+ availability in
solution containing Na2SO4 decreased at the
concen-trations used in this study (Figure 5). For example, for a
copper concentration of 8.473 10-5 mol L-1, the availability
of hexaquo Cu2+ complex in solution was almost 100% in
contrast to 39% in an aqueous solution of Na2SO4 0.10
mol L-1
. This suggests that copper adsorption can also
decreases due to the availability of hydrolyzed Cu2+, this
species probably being the main form adsorbed on the surface.
Copper adsorption mechanism
The role of the carboxylic group in the copper adsorption on AC was investigated by pH monitoring during the adsorption process.
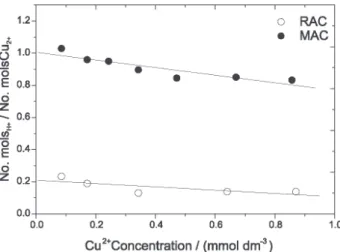
The experiments evidenced a decrease in pH along the adsorption process, especially for MAC, whose ratio between released and adsorbed copper protons was around 1, as shown in Figure 7.
MAC was characterized by a large number of acidic sites that could be the centers responsible for proton release. More specifically, the adsorption of metal ions on MAC is probably conducted by ion exchange Figure 6. Adsorption isotherm of Cu(II) ions on activated carbon in
ab-sence and preab-sence of 0.10 mol L-1 Na
2SO4. Abscissa: C = equilibrium concentration of metal in aqueous phase. Ordinate: q = concentration of metal ion in the carbon phase, in mmol g-1. Solid line represents the Langmuir equation fitting.
Table 4. Result from Langmuir equation applied to adsorption isotherm
of Cu(II) ion on RAC and MAC samples
Sample Q / (mmol g-1) K / (L mmol-1) R2
RAC 0.102 ± 0.009 6 ± 2 0.86
MAC 0.36 ± 0.02 39 ± 11 0.90
With Na2SO4
RAC 0.066 ± 0.007 8 ± 4 0.62
MAC 0.27 ± 0.02 7 ± 2 0.92
mechanism involving protonated surface sites. Other researchers have observed similar correlations between
released protons and metal ions adsorbed on AC.30 Copper
ion uptake is thought to result from the formation of single metal-complexes, as suggested by equation 11:
S-COOH + Cu2+ S-COO- Cu2+ + H+ (11)
where S-COOH represents a carboxyl group on the
surface.9,30,31 The mechanism above is favored by the acidic
centers with small pKa values, as strong acid groups release protons more easily. Therefore, copper ion adsorption is mainly due to the strong dependence on the dissociation of surface acidic groups in the solution pH. As the experiment was performed at pH 4.0 (Figure 7),
only the acidic groups with pKa ≤ 4.0 are able to provide
metal binding sites for ion exchange reaction. In this way, carboxylic groups could provide additional ion binding capacity at pH =4.0.
At high concentration, the calculated nH+/nCu2+ ratio
becomes smaller than unity and decreases with the increase in solution concentration. This probably occurs because the
basic sites on the AC surface also compete for H+ and because
there is more than one adsorption mechanism in action. In the case of RAC, monitoring pH as a function of adsorption revealed that the ratio between released protons and adsorbed copper is close to 0.2. This means that the acid groups had no significant participation in RAC copper adsorption. Considering that the sample was characterized by few surface acidic groups, the graphene layer probably controlled the adsorption mechanism. The graphene
layers, Cπ, act as Lewis basic centers, where protonation
takes place according the equation 12:
-Cπ + 2H2O -CπH3O+ +OH– (12)
These -Cπ basic centers may also interact with metal
cations. Indeed, some authors suggest that the adsorption of metal cation on nonoxidized carbons occurs mainly
through Cπ-cation interactions.28,32
Copper desorption
Considering that copper adsorption is based on a
general ion-exchange reaction between H+ and Cu2+, as
suggested by equation 11, the desorption process must be favored by the decrease in solution pH. Therefore, the desorption experiment was performed with an HCl
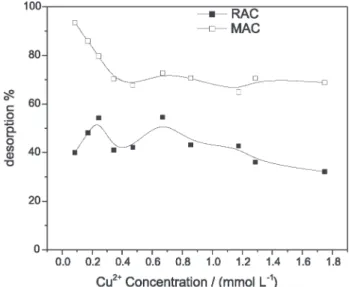
solution 0.10 mol L-1. The results given in Figure 8 show
the desorption percentage for different initial copper concentrations.
According to the result observed for MAC sample, it is possible to remove almost 100% of the copper previously adsorbed at low concentrations and regenerate the carbon adsorbent. However, as concentration increases, the desorption decreases to 70%. In Figure 7 the ratio of adsorbed copper to released proton was close to unity, mainly at low concentration, supporting an ion exchange mechanism as suggested by equation 11. The same experiments showed that as concentration increases the ratio becomes lower than unity. This observation suggests that for MAC at least 70% of the desorption involved a reversible ion exchange mechanism. At low concen-trations, these sites were more available on the surface and desorption is close to 100%. For concentrations at which the surface is saturated and adsorption is close to the maximum coverage capacity (Q), other parallel mechanisms also occurred and copper desorption decreased.
For the nonoxidized carbon, RAC, desorption remained practically at 40%. In this case, the reversible adsorption can derive from the same contribution of the small amount of acidic groups on the carbon surface to the ion exchange process.
Conclusions
This study show that AC oxidation with HNO3 leads
to a significant increase in the amount of surface acid groups with the acid dissociation constant, Ka, distributed over a wide pKa range. These modifications do not relate to any noticeable change on specific surface area and porosity values, but improve the adsorption capacity of copper ions on oxidized AC. The application of Langmuir Figure 8. Recovery percentage of Cu(II) from desorption experiments
isotherms to experimental data shows that copper adsorption increases 3.5-fold for MAC, the oxidized sample, as compared with data for RAC. Experiments conducted in this work show that the maximum copper adsorption capacity depends on the ionic strength and the predominant copper species in the aqueous solution.
The results also support the hypothesis that AC oxidation improves copper adsorption by ion-exchange reaction, which can be attributed to the larger number of acidic sites on MAC with pKa range lower than 6. The reversible copper adsorption occurs through the strongest
acidic center with the displacement of one H+ ion per
adsorbed Cu(II) ion. At high Cu(II) concentration other mechanism can take place, which explain the Cu(II) ion desorption decreased when metal ion concentration increase. For the RAC, sample nonoxidized, copper adsorption was controlled by the Lewis basic center interactions.
The informations obtained in the present study will permit us to optimise the preparation of carbons adsorbent with reversible adsorption properties and improve AC regenerability.
Acknowledgments
This work was supported by FINEP- Financiadora de Estudos e Projetos Ministério da Ciência e Tecnologia -Project 01.03.0310.00. CNPq-PIBIC-UFSJ. FAPEMIG-CEX-366/03.
References
1. Cai, L.; Li, X. K.; Song, Y.; Cherian, M. G.; Curr. Med. Chem. 2005, 12, 2753.
2. Robinson, P.; MacDonell, M.; Environ. Toxicol. Pharmacol. 2004, 18, 201.
3. Sikdar, K. S.; Buckle, J.; Rogut, J.; Environ. Prog.2001, 20, 1.
4. Johns, M. M.; Marshall, W. E.; Toles, A. C.; J. Chem. Technol.
Biotechnol.1998, 71, 131.
5. Costa, L. C. M.; Araujo, M. H.; Sapag, K.; Sardella, M. F.; Silva, H.; Deiana, A. C.; Lago, R. M.; J. Braz. Chem. Soc. 2005,
16, 899.
6. Chen, P. J.; Wu, S.; Chong, K.; Carbon2003, 41, 1979.
7. Pesavento, M.; Profumo, A.; Alberti, G.; Conti, F.; Anal. Chim. Acta 2003, 480, 171.
8. Chen, J.; Yiacoumi, S.; Blaydes, T. G.; Sep. Technol.1996,6,
133.
9. Chen, J. P.; Lin, M.; Carbon2001, 39, 1491.
10. Noh, J. S.; Schawrs, J. A.; Carbon1990, 28, 675.
11. Shim, J.; Park, S.; Ryu, S.; Carbon2001, 39, 1635.
12. Jr, V. S.; Malik, D. J.; Streat, M.; Carbon2002, 40, 95.
13. Shunkevich, A. A.; Akulich, Z. I.; Mediak, G. V.; Soldatov, V.
S.; React. Funct. Polym. 2005, 63, 27.
14. Aleixo, L. M.; Godinho, O. E. S.; Costa, W. F.; Anal. Chim.
Acta 1992, 257, 35.
15. Masini, J. C.; Godinho, O. E.; Aleixo, L. M.; Fresenius’J. Anal.
Chem.1998, 360, 104.
16. Jiang, X.; Chen, L.; Zhong, W.; Carbohydr. Polym. 2003, 54,
457.
17. Wu, Z.; Pittman, C. J.; Gardner, S. D.; Carbon1995, 33, 597.
18. Masini, J. C.; Abate, G.; Lima, E. C.; Hahn, L. C.; Nakamura, M. S.; Lichtig, J.; Nagatomy, H. R.; Anal. Chim. Acta1998,
364, 223.
19. Masini, J. C.; Anal. Chim. Acta1993, 283, 803.
20. Boehm, H. P. In Chemical Identification of Functional Groups,
Advances in Catalysis; Eley, D. D., ed.; Academic Press: New
York, 1966, vol. 16, p. 179.
21. Barroso, L. C.; Cálculo Numérico com Aplicações, 2nd ed.,
Harbra: São Paulo, 1987.
22. Bajpai, A. C.; Matemática Avançada para Engenharia, Cremus:
São Paulo, 1980.
23. Serrano, G. V.; Almeida, F. P.; Valle, C. J. D.; Villegas, J. P.;
Carbon1999, 37, 1517.
24. Silverstein, R. M.; Bassler, G. C.; Morrill, T. C.; Identificação
Espectrométrica de Compostos Orgânicos,5th ed., Guanabara
Koogan: Rio de Janeiro, 1994.
25. Chingombe, P.; Saha, B.; Wakeman, R. J.; Carbon2005, 43,
3132.
26. Contescu, A.; Contescu, C.; Putyera, K.; Carbon1997, 35, 83.
27. Kocaoba, S.; Akcin, G.; Talanta2002, 57, 23.
28. Álvarez-Merino, M. A.; Lópes-Ramon, V.; Castilha-Moreno, C. J.; J. Colloid Interface Sci.2005, 288, 335.
29. Biniak, S.; Pakula, M.; Szymanski, G. S.; Swiatkowski, A.;
Langmuir1999, 15, 6117.
30. Dastgheib, S. D.; Rockstraw, D. A.; Carbon 2001, 39, 1849.
31. Corapcioglu, M. O.; Huang, C. P.; Water Res. 1987, 21, 1031.
32. Leon y Leon, C. A.; Solar J. M.; Calemma, V.; Radovic, L. R.;
Carbon1992,30, 797.
Received: January 23, 2006