RECENT CHANGES IN TEMPERATURE AND PRECIPITATION EXTREMES IN AN
ECOLOGICAL RESERVE IN FEDERAL DISTRICT, BRAZIL
CARLOS ANTONIO COSTA DOS SANTOS
Universidade Federal de Campina Grande, Unidade Acadêmica de Ciências Atmosféricas, Campina Grande,
PB, Brasil
[email protected], [email protected]
Received July 2011 - Accepted July 2013
ABSTRACT
The main objective of this study is to provide information on trends, in local scale, using records of daily temperature and precipitation of a single weather station in an ecological reserve of the savanna biome in Federal District/Brazil, analyzing different extreme climatic indices. The extreme temperature indices have identiied that the days are getting warmer and the nights are cooler at local scale. Thus, the local diurnal temperature range is increasing. The results also evidence that the number of days with heavy precipitation is decreasing, but the precipitation indices presented high variability and suggest the importance of further studies related to changes in land use and urbanization. The locally obtained temperature results point to changes in South America.
Keywords: climate change, RClimdex, IPCC, quality control
RESUMO: MUDANÇAS RECENTES NOS EXTREMOS DE TEMPERATURA E PRECIPITAÇÃO EM UMA RESERVA ECOLÓGICA DO DISTRITO FEDERAL, BRAZIL O principal objetivo desse estudo é prover informações de tendências, na escala local, usando dados de temperatura e precipitação do bioma savana no Brasil, através da análise de índices de extremos climáticos. Os índices extremos de temperatura identiicaram que os dias estão se tornando mais quentes e as noites mais frias. Logo, a amplitude térmica diária está aumentando. Os resultados também evidenciam que o número de dias com precipitação forte está diminuindo, mas os índices de precipitação apresentaram alta variabilidade temporal e sugerem a importância de estudos futuros relacionados às mudanças no uso da terra e urbanização. Os resultados referentes à temperatura apontam para mudanças na América do Sul.
Palavras-chave: mudanças climáticas, RClimdex, IPCC, controle de qualidade
1. INTRODUCTION
Tropical savannas cover about one-eighth of the global land surface and are characterized by high plant-species diversity. The 1960s marked the beginning of the expansion of large-scale agriculture and planted pastures across the savannas of central Brazil, and the region is now one of the largest soybean and beef producers in the world (Giambelluca et al., 2009). The authors explain that this biome is extensive, has a biotic richness, and its vulnerability to impacts of human activities has received relatively little attention from researchers in comparison with tropical rain forest. Because plants are the primary site for the exchange of water, energy,
and momentum between the land and atmosphere, vegetation has an important role in the climate system (Hoffmann and Jackson, 2000).
Long-term annual or seasonal averages of climatic variables, especially temperature and precipitation, have generally been used as indicators for the assessment of climate change. Small changes in their means can be associated with large changes in the frequency of extremes due to changes in variability. Rahimzadeh et al. (2009) evidenced that the number of occurrences and intensity of low minimum temperature events around the world have decreased signiicantly. The reverse is true for the high maximum temperature events, but usually those trends have been weaker. IPCC (2007) presented that more extreme precipitation events have occurred over large areas of land especially in the mid and high-latitude regions. There is consistency among the results obtained from temperature studies, but patterns of precipitation differ for different regions and are more spatially and seasonally variable than temperature change.
The study of climate change through climate extremes is rather complex, and can be faced using a set of suitable indices describing as fully as possible the extremes of the climatic variables (Toreti and Desiato, 2008). The Expert Team on climate change detection, monitoring and indices, sponsored by WMO (World Meteorological Organization) Commission for Climatology (CCI) and the Climate Variability and Predictability project (CLIVAR), an international research program started in 1995 in the framework of the World Climate Research Program, has developed a set of indices (Peterson et al., 2001) that represent a common guideline for regional analysis of climate.
Many studies investigated climate change and extremes on a global scale (Easterling et al., 2000; Vincent et al., 2005; Haylock et al., 2006) or on a national scale (Brunetti et al., 2006; Satyamurty et al., 2009) but few of them made this on a local scale, using a large number of weather stations (Brunetti et al., 2004; Santos and Brito, 2007; Santos et al., 2009). The IPCC in its reports (2001 and 2007) evidenced the need for more detailed information about regional patterns of climate change.
This study attempts to provide new information on trends, on local scale, using records of daily air temperature and precipitation of the savanna biome in Brazil, through the analysis of different indices based on observational data from a weather station. This analysis is important for the savannas since any change in climate can have large impacts on the daily life of the population and environment.
2. DATA AND METHODOLOGY 2.1 Data and quality control
Daily maximum and minimum surface air temperatures and daily precipitation data were taken from the meteorological station located in the Ecological Reserve (RECOR) (15o 56’ 41”
S e 47o 53’ 07”W) of IBGE (Brazilian Institute of Geography and Statistics) in Federal District, Brazil, for the period of 1980 to 2004. The station location is shown in Figure 1. This reserve is part of the experimental sites of the Large-Scale Biosphere-Atmosphere Program in Amazonia (LBA) which is an international research initiative led by Brazil.
In this study a rigid data quality control was applied, because indices of extremes are sensitive to changes in station, exposure, equipment, and observer practice (Haylock et al., 2006). Data Quality Control (QC) is a prerequisite for determining climatic indices. The quality control performs the following steps: 1) Replaces all missing values (currently coded as -99.9) into an internal format that the software recognizes (i.e. NA, not available), and 2) Replaces all unreasonable values into NA. Those values include: a) daily precipitation amounts less than zero, and; b) daily maximum temperature less than daily minimum temperature. In addition, QC also identiies outliers in daily maximum and minimum temperature. The outliers are daily values outside a region deined by the user. Currently, this region is deined as ntimes standard deviation (sdt) of the value for the day, that is, (mean – n * std and mean + n * std), where std for the day and n is an input from the user (Zhang and Yang, 2004; Vincent et al., 2005).
2.2 Methodology
In this study the RClimdex 1.0 software developed by Xuebin Zhang and Feng Yang from Canadian Meteorological
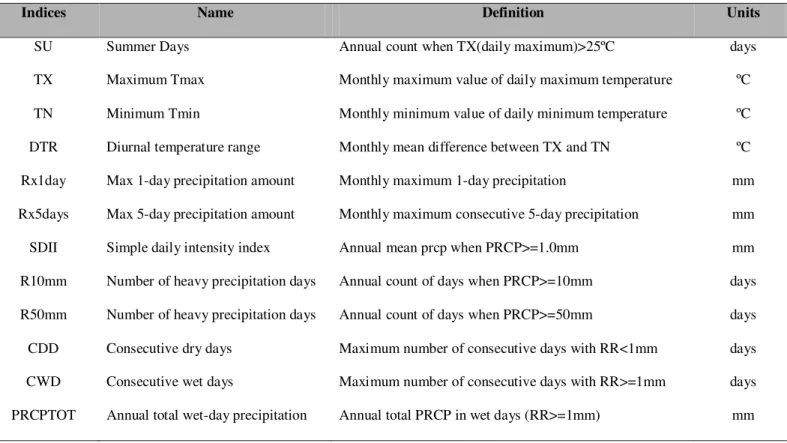
Service (Zhang and Yang, 2004) was used to obtain the climatic extremes indices following methodologies of Zhang et al. (2005) and Haylock et al. (2006). RClimdex provides 27 indices in total. However, only 12 indices were chosen for discussion here, 4 indices based on air temperature data and 8 based on precipitation data (Table 1) that better explain the climate behavior of the study region.
The resulting series were analyzed through trends. The slopes of the annual trends of the climate indices were calculated based on a least square linear itting. Trends were obtained for each index at the location and the statistical signiicances of the trends were assessed through the Student’s t-test and the number of degrees of freedom was obtained based on the length of the data set, i.e., 25 for the 1980-2004.
To run the RClimdex 1.0 software the input data ile has several requirements: 1) ASCII text ile; 2) Columns sequence: Year, Month, Day, Precipitation (PRCP), Maximum air temperature (TMAX), and Minimum air temperature (TMIN). (NOTE: PRCP units = millimeters and TMAX and TMIN units = degrees Celsius); 3) the format as described above was space delimited (e.g. each element was separated by one or more spaces); 4) for data records, missing data were coded as -99.9 (in this study the precipitation values were replaced by -99.9) and data records were in calendar date order (Zhang and Yang, 2004).
3. RESULTS AND DISCUSSIONS
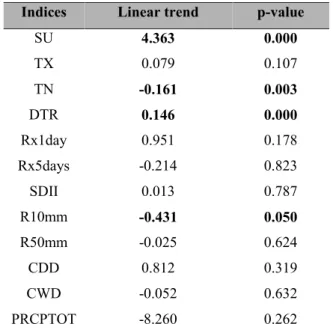
Table 2 presents the annual linear trends of the extreme indices of air temperature and precipitation for the RECOR site. The Summer Days (SU) index shows an increase of 4.363 days/year. This means that the number of days when the maximum daily temperature is higher than 25 ºC has increased considerably in the last two decades (Figure 2a). Monthly maximum value of daily maximum temperature (TX) is shown in Figure 2b and presents an annual increase of 0.079 ºC/year (Table 2) evidencing that the days are getting warmer. On the other hand, the monthly minimum value of daily minimum temperature (TN) is decreasing at a rate of 0.161 ºC/ year (Table 2) showing that the nights are cooler (Figure 2c). Figure 2d shows the Diurnal Temperature Range (DTR) index and presents an increase of 0.143 ºC/year as shown in Table 2. These indings, in part, are in agreement with IPCC global results (IPCC, 2007) and Vincent et al. (2005) because they found that temperature extremes are changing in South America. However, they found that the coldest nights (TN) of the year are getting warmer in opposition to the results shown for the RECOR site. It is necessary to evidence that there is no studies about the temperature extreme indices for this region of Brazil which could be used for comparison and, that in this study has
Indices Name Definition Units
SU Summer Days Annual count when TX(daily maximum)>25ºC days
TX Maximum Tmax Monthly maximum value of daily maximum temperature ºC
TN Minimum Tmin Monthly minimum value of daily minimum temperature ºC
DTR Diurnal temperature range Monthly mean difference between TX and TN ºC
Rx1day Max 1-day precipitation amount Monthly maximum 1-day precipitation mm
Rx5days Max 5-day precipitation amount Monthly maximum consecutive 5-day precipitation mm
SDII Simple daily intensity index Annual mean prcp when PRCP>=1.0mm mm
R10mm Number of heavy precipitation days Annual count of days when PRCP>=10mm days
R50mm Number of heavy precipitation days Annual count of days when PRCP>=50mm days
CDD Consecutive dry days Maximum number of consecutive days with RR<1mm days
CWD Consecutive wet days Maximum number of consecutive days with RR>=1mm days
been used a dataset of 25 years of a single weather station. Thus, the results showed here give only an indicative of the climate variability of the study area, it is necessary to extrapolate this analysis for more locations.
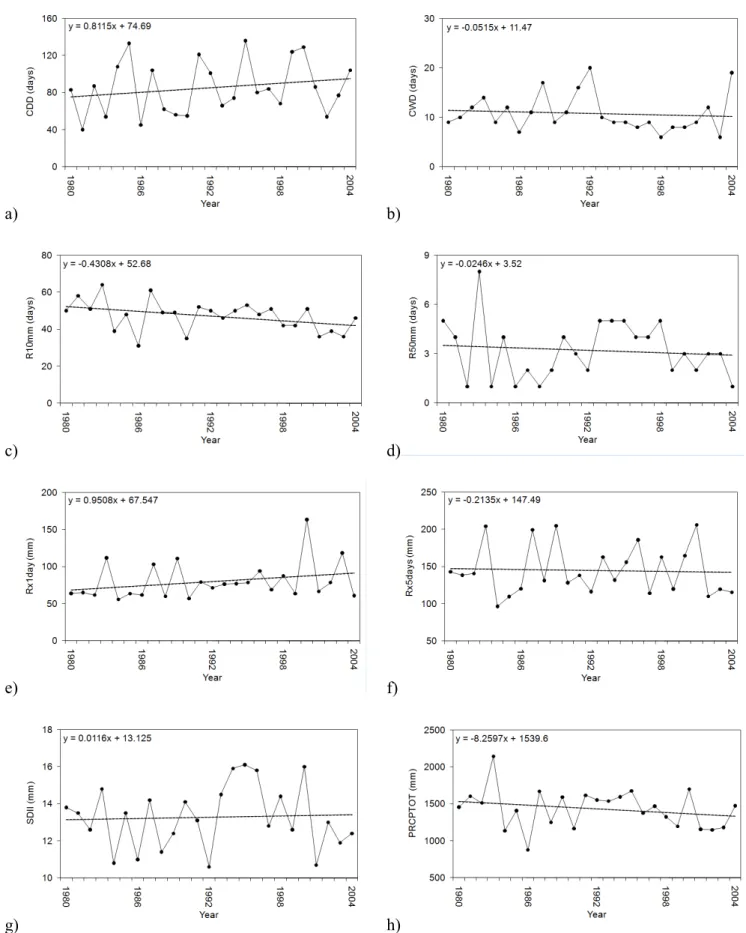
It is important to note that the temperature indices (Table 2), except the TX index, have shown signiicant trend at 5% level (p<0.05) while the precipitation indices presented only one statistical signiicant index (R10mm), showing that temperature indices are more sensitive to changes or variability. Nevertheless, all the indices present consistency in their results, for example, the Consecutive Dry Days (CDD) index shows an increase of 0.812 days per year (Figure 3a) while the Consecutive Wet Days (CWD) index presents a decrease of 0.052 day per year (Figure 3b), i.e. the trends of these indices have the opposite sign, as an expected result.
The number of days with precipitation higher than 10 mm (R10mm) is decreasing at a rate of 0.431 days/year and the number of days with precipitation higher than 50 mm (R50mm) is decreasing as well (-0.025) (Figures 3c and 3d, respectively). The monthly maximum 1-day precipitation index (Rx1day) presents a trend of 0.951 mm/year, i.e. the maximum Indices Linear trend p-value
SU 4.363 0.000
TX 0.079 0.107
TN -0.161 0.003
DTR 0.146 0.000
Rx1day 0.951 0.178
Rx5days -0.214 0.823
SDII 0.013 0.787
R10mm -0.431 0.050
R50mm -0.025 0.624
CDD 0.812 0.319
CWD -0.052 0.632
PRCPTOT -8.260 0.262
Table 2 - Annual linear trends of the extreme climate indices of air temperature and precipitation for the study area. The bold values represent statistical signiicance at 5% level (p<0.05).
a)
b)
c)
d)
a)
b)
c)
d)
e)
f)
g)
h)
found that, in general, the PRCPTOT index had the largest signiicant increase of the annual precipitation indices for the 1950-1999 periods. They also found that CDD increased as well as the number of days with heavy precipitation, and the intense precipitation is becoming concentrated in fewer days across the period, showed by the Rx5days index, indicating an important climate change in recent times. Their results are different of the indings of this study, except for the CDD result. Santos et al. (2009) analyzed the extremes indices for the Ceará State and identiied that the PRCPTOT, R50mm and Rx5days indices presented predominant increase, evidencing disagreement with the results presented in this study. It is necessary to evidence that the precipitation extreme indices results shown in this study do not have statistical signiicance, except the R10mm index, and the analysis have been done only for a single weather station in a Central part of Brazil, maybe these facts are the reasons of these differences in comparison to other studies.
The hydrological cycle and energy luxes can be modiied by the changes in physical properties at the surface that can have signiicant impacts at the local and regional scales, affecting the precipitation patterns and temperatures (Dufek and Ambrizzi, 2008). Several gases that affect the climate and air quality have as major source the biomass burning, for example the grazing in savannas. Its global impacts are very small and dificult to detect, but locally or regionally, the effects associated with land use change are very important.
4. CONCLUSIONS
The purpose of this research is to examine, on local scale, the behavior of extreme climate events based on daily air temperature and precipitation data of a weather station located in the savanna biome in Brazil. The results have been divided irst in the extreme temperature indices analysis and second in precipitation indices analysis.
The number of days when the maximum daily temperature is higher than 25 ºC and maximum value of daily maximum temperature have increased considerably in the last two decades, evidencing that locally the days are getting warmer. On the other hand, the minimum value of daily minimum temperature is decreasing showing that locally the nights are cooler. Thus, the diurnal temperature range showed a strong increase at the study area.
All the temperature indices have shown signiicant trend at 5% level while the precipitation indices presented only one statistically signiicant index (R10mm), showing that temperature indices are more sensitive to changes or variability and that the number of days with heavy precipitation is decreasing in the study area. However, all the precipitation indices present consistency in their results. The precipitation 1-day precipitation amount is increasing (Figure 3e). However,
the maximum consecutive 5-days precipitation amount or monthly maximum 5-days precipitation index (Rx5days) presents decreasing trend (-0.214) (Figure 3f). Simple daily intensity index (SDII), i.e. annual mean precipitation when the precipitation is ≥1.0 mm, does not show any signiicant trend (Figure 3g). Figure 3h presents the time series of the annual total precipitation (PRCPTOT) index showing negative trends. These results, even without statistical signiicance, present agreement with those found by Haylock et al. (2006) which analyzed the extreme precipitation indices for the whole South America and found high variability in their results, and Marcuzzo et al. (2012) which found decreasing trends in the annual precipitation over the savanna biome in the Centro-Oeste Region of Brazil, as well as, they agree with the results found by Hoffmann and Jackson (2000) in four of the ive studied savanna regions, simulated precipitation declined by approximately 10% following the conversion of savanna to grassland. In an environment where water availability seasonally constrains agriculture and ecosystem primary productivity, such a reduction in precipitation may have considerable ecological and economic consequences. However, as described previously, only R10mm have shown statistical signiicance in its trend. These results do not identify a pattern in the precipitation extreme climate indices at the study area. Santos et al. (2012) found different results when studied the trends in extreme precipitation indices obtained with ERA40 gridded precipitation data over northern Brazil including the Federal District. They found that the CDD showed a negative trend over the Federal District and that the annual precipitation amounts showed positive trends. These differences must be occurred due the use of reanalysis dataset which cover large surface areas, i.e., each grid point has 2.5° of latitude x 2.5° of longitude.
Giambelluca et al. (2009) affirmed that the 1960s marked the beginning of the expansion of agriculture and planted pastures across the savannas of central Brazil. Thus, the reduction in roughness length may also have considerable impact on precipitation and surface temperature. Surface temperature increases because of reduced conduction of sensible and latent heat from the surface to the atmosphere. The reduced heat lux into the atmosphere can reduce convection, thus reducing precipitation. However, roughness length can have signiicant effects on large-scale circulation patterns, making it dificult to predict the changes in precipitation. Hence, the behavior of the extreme climate indices found in this study can be explained by these reductions of roughness length, reducing the conduction of heat in the biosphere-atmosphere system.
results presented here showed high variability and suggest the importance of further studies related to changes in land use and urbanization. As discussed previously, these results are important for the Brazilian savannas since any change in climate can have large impacts on the daily life of the population and environment.
5. REFERENCES
BRUNETTI, M., BUFFONI, L., MANGIANTI, F., MAUGERI, M., NANNI, T. Temperature, precipitation and extreme events during the last century in Italy. Global and Planetary Change, v. 40, p. 141–149, 2004.
BRUNETTI, M., MAUGERI, M., MONTI, F., NANNI, T. Temperature and precipitation variability in Italy in the last two centuries from homogenized instrumental time series. International Journal of Climatology, v. 26, p. 345-381, 2006.
DUFEK, A. S., AMBRIZZI, T. Precipitation variability in São Paulo State, Brazil. Theoretical and Applied Climatology, v. 93, p. 167-178, 2008.
EASTERLING, D. R., EVANS, J. L., GROISMAN, P. Y., KARL, T. R., KUNKEL, K. E., AMBENJE, P. Observed variability and trends in extreme climate events. Bulletin of American Meteorological Society, v. 81, p. 417-425, 2000. GIAMBELLUCA, T. W., SCHOLZ, F. G., BUCCI, S. J.,
MEINZER, F. C., GOLDSTEIN, G., HOFFMANN, W. A., FRANCO, A. C., BUCHERT, M. P. Evapotranspiration and energy balance of Brazilian savannas with contrasting tree density. Agricultural and Forest Meteorology, v. 149, p. 1365-1376, 2009.
HAYLOCK, M. R., PETERSON, T. C., ALVES, L. M., AMBRIZZI, T., ANUNCIAÇÃO, Y. M. T., BAEZ, J., BARROS, V. R., BERLATO, M. A., BIDEGAIN, M., CORONEL, G., GARCIA, V. J., GRIMM, A. M., KAROLY, D., MARENGO, J. A., MARINO, M. B., MONCUNILL, D. F., NECHET, D., QUINTANA, J., REBELLO, E., RUSTICUCCI, M., SANTOS, J. L., TREBEJO, I., VINCENT, L. A. Trends in total and extreme South American rainfall 1960-2000 and links with sea surface temperature. Journal of Climate, v. 19, p. 1490-1512, 2006.
HOFFMANN, W. A., JACKSON, R. B. Vegetation–Climate Feedbacks in the Conversion of Tropical Savanna to Grassland. Journal of Climate, v. 13, p. 1593-1602, 2000. IPCC. 2001. Climate Change 2001: Impacts, Adaptation, and Vulnerability. Contribution of Working Group II to the Third Assessment Report of the Intergovernmental Panel on Climate Change. Cambridge University Press: Cambridge, New York.
IPCC. 2007. Climate Change 2007 – The Physical Science Basis. Contribution of Working Group I to the Fourth Assessment Report of the IPCC. Cambridge University Press: Cambridge, New York.
MARCUZZO, F. F. N., CARDOSO, M. R. D., FARIA, T. G. Chuvas no cerrado da Região Centro-Oeste do Brasil: análise histórica e tendência futura. Ateliê Geográico, v. 6, n. 2, p.112-130, 2012.
PETERSON, T. C., FOLLAND, C., GRUZA, G., HOGG, W., MOKSSIT, A., PLUMMER, N. Report on the activities of the working group on climate change detection and related repporteurs 1998–2001. In World Meteorological Organization, Rep. WCDMP-47, WMO-TD 1071, Geneva, IL, 2001.
RAHIMZADEH, F., ASGARI, A., FATTAHI, E. Variability of extreme temperature and precipitation in Iran during recent decades. International Journal of Climatology, v. 29, p. 329-343, 2009.
SANTOS, C. A. C., BRITO, J. I. B. Análise dos índices de extremos para o semi-árido do Brasil e suas relações com TSM e IVDN. Revista Brasileira de Meteorologia, v. 22, n. 3, p. 303-312, 2007.
SANTOS, C. A. C., BRITO, J. I. B., RAMANA RAO, T. V., MENEZES, H. E. A. Tendências dos índices de precipitação no Estado do Ceará. Revista Brasileira de Meteorologia, v. 24, p. 39-47, 2009.
SANTOS, C. A. C., BRITO, J. I. B., JUNIOR, C. H. F. S., DANTAS, L. G. Trends in Precipitation Extremes over the Northern Part of Brazil from ERA40 Dataset. Revista
Brasileira de Geograia Física, v. 4, p. 836-851, 2012. S AT YA M U RT Y, P. , D A S I LVA T E I X E I R A , M . ,
KLUG PADILHA, C. Warm and Dry Spells (WDS) in Austral Winter over Central South America. Annales Geophysicae, v. 25, p. 1049-1069, 2007.
SATYAMURTY, P., CASTRO, A. A., TOTA, J., GULARTE, L. E. S., MANZI, A. O. Rainfall trends in the Brazilian Amazon Basin in the past eight decades. Theoretical and Applied Climatology, DOI10.1007/s00704-009-0133-x, 2009. TORETI, A., DESIATO, F. Changes in temperature extremes
over Italy in the last 44 years. International Journal of Climatology, v. 28, p. 733-745. 2008.
1960–2000. Journal of Climate, v. 18, p. 5011–5023, 2005.
ZHANG, X., HEGERL, G., ZWIERS, F. W., KENYON, J. Avoiding inhomogeneity in percentile-based indices of temperature extremes. Journal of Climate, v. 18, p. 1641–1651, 2005.