О
О
K
О
BULLETIN OF THE SERBIAN GEOGRAPHICAL SOCIETY
О
2010.
XC-
. 2
YEAR 2010
TOME XC- N 2
О UDC 551.577.3
Ц Ц Ј Њ
Ј 1949-2004∗
Ћ,Ј О Ћ, О ОЈ Ћ
У Б – Г , С 3/3, Б , С ј
: ђ
1949-2004.
- .
. .
69%.
ђ ђ
. ђ
- . ђ,
.
: , - , , ,
-, ,
, .
(
) .
(North Atlantic Oscillation– NAO). ђ ,
ђ
(Huth R. et al., 2008). Ј
(Hess P., Brezowsky H., 1977; Gerstengarbe F.W., Werner P., 2005).О .
Ivanov S. et al. (2010)
. Ј . . (2008)
NAO О (Arctic Oscillation) ,
∗
146005 М
86
, .
.
Ј. (2005). О ђ
(El Niño Southern Oscillation – ENSO) 1951-2000.,
. М
М ђ ђ Bartholy J.
Pongrácz R. (2006). ђ , ђ
2-3 . (3
) ENSO
1950-1998. Ј .
(2010).
Bartholy J. Pongrácz R. (2006) ђ ђ
ђ
- ENSO . Cazacioc L. V.
Cazacios A. (2006) ђ NAO
.
, .
ђ NAO
-ђ ,
. Domonkos P.
et al. (2003) ђ ђ
ђ
.
ђ ђ
-
1949-2004. .
( ) - .
- (Gerstengarbe F.W., Werner P., 2005)
124 (1881-2004). О
29
( . Grosswetterlagen GWL). GWL-
, . GWL- 500 hPa. GWL-
3 o 10 ( .
Grosswettertypen GWT) ( 1). О
. ђ ,
GWL 3 .
87
1949-2004., 2
(%) GWT, ђ 1949-2004.
1. , GWL- .
GWT GWL
(W) WA, WZ, WS, WW
Ј (SW) SWA,SWZ
(NW) NWA, NWZ
, (HM)
HM, BM
, (TM)
TM
(N) NA, NZ, HNA, HNZ, HB, TRM
(NE) NEA, NEZ
(E) HFA, HFZ, HNFA, HNFZ
Ј (SE) SEA, SEZ
М
Ј (S) SA, SZ, TB, TRW
17
( 2). ђ
.
1949-2004. .
1. ( )
1949-2004. .
2. (%) ( )
88
e
ђ . ђ
ђ .
- . О
ђ ђ ,
ђ . ђ
( 17 2)
ђ .
0.32 0.69
. /
.
ђ
.
, 6 17
„weighted pair group“,
o . ђ ђ
.
ђ ,
( , , ) 1949-2004.
.
( 2)
( 0.17),
(12 17 ).
-0.45,
. ( )
/ ( -0.61, -0.63, -0.53
-0.56). (
-0.04, -0.14, -0.30, -0.39)
/ ( -0.03, -0.33).
( -0.44, -0.56,
-0.57) (0.17).
,
.
ђ (
)
. (-0.04
-0.76), (-0.03 -0.57), (-0.33 -0.81) (-0.25 -0.60).
. М ђ , /
89
,
( 2).
2.
(R) ( ), 1949-2004.
1950-2004.
95 %.
М
R О R О R О
1. -0.04 -0.76 -0.70 -0.58 0.62 0.79
2. -0.42 -0.62 -0.75 -0.32 0.81 0.53
3. -0.25 -0.60 -0.72 -0.63 0.70 0.75
4. -0.61 -0.42 -0.65 -0.75 0.77 0.77
5. -0.63 -0.53 -0.77 -0.68 0.89 0.79
6. -0.56 -0.37 -0.55 -0.43 0.66 0.57
7. -0.57 -0.58 -0,67 -0.72 0.83 0.87
8. -0.30 -0.11 -0,80 -0.53 0.78 0.47
9. -0.39 -0.47 -0.62 -0.59 0.65 0.65
10. -0.53 -0.68 -0.42 -0.62 0.54 0.78
11. -0.37 -0.36 -0.78 -0.63 0.79 0.64
12. -0.44 -0.32 -0.11 -0.82 0.36 0.78
13. 0,17 -0.28 -0.73 -0.77 0.55 0.72
14. -0.33 -0.81 -0.45 -0.44 0.53 0.69
15. -0,03 -0.57 -0.38 -0.64 0.38 0.75
16. . -0,14 0.12 -0.65 -0.32 0.60 0.21
17. -0.56 -0.34 -0.42 -0.60 0.62 0.58
-0.45 -0.54 -0.77 -0.75 0.83 0.83
,
(-0.11).
( 7
-0.70). -0.77,
. ( ) ђ /
( -0.38, -0.45).
(-0.55 -042, ).
ђ , , / .
(-0.11),
.
90
О
- - 3.
( -0.11
-0.82 ) (-0.65 -0.32
). - ( - . -
) ( ) ( )
.
3. -
.
( )
( 3). О
NW (-0.67 R -0.68 О) М (-0.72 R -0.70
О) , . .
3.
(R) ( )
, 1949-2004. 95 %.
W SW NW HМ TM N NE E SE S
R -0.45 -0.29 -0.67 -0.72 -0.06 -0.02 0.82 0.60 0.67 0.76
О -0.54 -0.27 -0.68 -0.70 0.01 -0.07 0.88 0.69 0.62 0.57
17
.
. R 0.83,
91
4. ( )
92
,
. О ,
(0.36),
. ( 0.38,
0.53). ђ / ( 0.79, 0.77,
0.89), ( 0.70, 0.83)
( 0.81).
О
NE, E, SE S, (N)
( 3).
- (
, 0.60 0.21 ),
- ( 5).
5. -
.
( 4)
69%. ( )
( -1.4), (
-0.84) ( -0.71).
(0.86) R2 (
/ - , , , ),
(0.29) R3 ( / - , ).
R5 ( , ,
, )
93
6. ( )
4. .
a .
(adjusted R²)
М
R 47 0.69 -0.71 -1.4 -0.84
R1 47 0.67 -2.8 -4.8 -5.3
R2 47 0.86 -2.1 -3.8 -3.8
R3 47 0.29 1.47 2.62 3.68
R4 47 0.66 1.29 1.87 3.16
R5 47 0.57 -0.39 -1.1 -0.49
R6 47 0.65 2.03 3.84 5.30
R1- , ; R2- , , , ; R3- , ; R4- ,
; R5- , , , ; R6- , , .
1949-2004.
( 0.046 / 0.408
/ , 0.05
),
(-0.416 / ).
( М ) . О
(S) ,
.
6 , 11 .
( 1,074 mm/ , 0,020 mm/ , 0,442
mm/ ) ( 2,484 mm/ 2.491
mm/ , 0.05).
( -1,986 mm/ ,
-2.760 mm/ ,
0.05), / ( -1.522 mm/ ,
0.05, -0.612 mm/ )
( -0.616 mm/ ).
ђ
( ђ
) ђ
. ,
/ ( R2) 86%
. / ( ) , . (
0.29). 6
. ,
: -0.006/ -0.009/ ,
95
ђ (
).
ђ ,
- .
( -0.010/ ,
-0,008/ -0.010/ ,
0.05 ).
ђ ђ
(0.005/ , 0.05).
О
. О
(-0.624 mm/ ).
0.83 ,
.
ђ (-0.001/ ).
ђ
1949-2004.
-, . : - , , . .
- NE, E, SE S o
. Ј
NW HM ,
SW W .
69%,
29%
86% / .
-
. М ђ ,
96
. ђ , .
, М ђ
(Bartholy J.,Pongrácz R.,2006; Cazacioc L. V., Cazacios A., 2006; Domonkos P. et al., 2003), ђ
,
. ђ ,
- (ENSO, NAO, AO).
, ђ
.
.
Bartholy, J. and Pongrácz, R. (2006). Regional effects of ENSO in Central/Eastern Europe, Advances in Geosciences, 6, 133-137.
Cazacios, L.V. and Cazacios, A. (2006). Impact of the macro-scale atmospheric circulation on snow cover duration in Romania, Proceedings of Annual Scientific Session of National Meteorological Administration/2006, 495-498.
Domonkos, P., Kyselỳ, J., Piotrowicz, K., Petrović, P. and Likso T. (2003). Variability of extreme temperature events in South-Central Europe during the 20th century and its relationship with large-scale circulation,
Int. J.Climatol. 23, 987-1010.
, . , Ј. (2005). М (ENSO)
, З , . LIII, , .
, . М. (2005). , џ , .
Gerstengarge, F. W. and Werner, P.C. (2005). Katalog der Grosswetterlagen Europas Nach Paul Hess und Helmuth Brewowsky 1881-2004.Potsdam institute for climate impact research, Offenbach a.M.
Hess, P. and Brezowsky, H. (1977). Katalog der Grosswetterlagen Europas, Berichte das Deutshen Wetterdienstes, 113, Offenbach
Huth, R., Beck, C., Philipp, A., Demuzere, M., Ustrnul, Z., Cahynová, M., Kyselý, J. and Tveito O. E. (2008). Classifications of Atmospheric Circulation Patterns, Recent Advances and Applications. Trends and Direction in Climate Research: Ann. N.Y. Acad. Sci. 1146, 105-152.
Ivanov, S., Svetlitchnyi, A., Matygin, A., Ivus, G., Palamarchuk, J. (2010). Variability in the general atmospheric circulation, precipitation and runoff in Eastern Europe, Geophysical Research Abstracts, Vol. 12, EGU2010-93-1
Ј , . (2010). : „
“, М , .
97
UDC 551.577.3
ATMOSPHERIC CIRCULATION AND THE PRECIPITATION VARIABILITY IN SERBIA FOR PERIOD 1949-2004
VLADAN DUCIĆ,JELENA LUKOVIĆ,GORICA STANOJEVIĆ
University of Belgrade-Faculty of Geography, 3/3 Studentski trg, Belgrade, Serbia
Abstract: In this paper we have analyzed the correlation between the atmospheric circulation and annual precipitation in Serbia for period 1949-2004. The data for frequency Hess-Brezowsky circulation forms and types were used as indicators of atmospheric circulation. Statistically significant coefficient of a negative sign is obtained for zonal and half-meridional form and a positive sign for meridional form. The strength of correlation is not uniform in the space. According to the multiple linear regression the contribution of atmospheric circulation in the variability annual precipitation of Serbia is 69%. Also, we analyzed the connection between the atmospheric circulation and the mean annual cloudiness. Comparing the results for this two climate elements we have concluded that they show different time-space development for same macrosynoptic conditions. Also, we can speak about the regional aspects of these processes.
Key words: atmospheric circulation, Hess-Brezowsky typology, precipitation, cloudiness, Serbia
Introduction
The significance of macrosynoptic process for the spatial-temporal distribution of climate elements, along the local factors, is essential for the understanding regional climate characteristics, or the differences. In this regard, it is important to know a relation between the variability of precipitation and change in the atmospheric circulation. The North Atlantic Oscillation is often used as a factor of climate variability on the Northern hemisphere. We also use a method of classification like a way to look at changes in the atmospheric circulation in a given time period. The Hess-Brezowsky typology (Hess P., Brezowsky H., 1977; Gerstengarbe F.W., Werner P., 2005) is one of the most known classification that shows the weather and circulation conditions on the European continent. This classification belongs to the group of subjective methods.
Ivanov S. et al. (2010) pointed out that in region of Eastern Europe the regional changes in the precipitation are in the relationship with changes in the atmospheric circulation at the global level. According to Jovanović G. et al. (2008) there is a dominant influence of the NAO and AO (Arctic Oscillation) phenomenon on precipitation regime in Serbia, especially during the winter seasons, and the Arctic Oscillation have more pronounced effect. Ducić V. and Luković J. (2005) conclude that there is a connection between El Niño Southern Oscillation (ENSO) and changes in rainfall in Serbia for the period 1951-2000., stressing that the connection is made via the general circulation of the atmosphere. Monthly precipitation and temperature anomalies in Hungary during El Niño and La Niña events were found Bartholy J. and Pongrácz R. (2006). Also, these authors suggest that the strongest connection between these phenomena is realized with a time lag of 2-3 months. The same time lag (3 months) was obtained for monthly temperatures in Serbia and ENSO for period 1950-1998. (Jovanović G., 2010).
98
the basis of correlation analysis between the NAO index and the frequency of Hess-Brezowsky synoptic types determined that for the positive phases are typical the western air flow, while the negative phases are associated with the northwestern air flow. Domonkos P. et al. (2003) have obtained the connection between atmospheric circulation represented by this typology and extreme temperature events on the territory South-Central Europe.
The aim of this study is to determine the correlation between the atmospheric circulation which is defined of the Hess-Brezowsky typology and annual precipitation in Serbia for the period 1949-2004.
Data and methods
The data for the frequency (days) of the Hess-Brezowsky circulation forms and types were used as indicators of atmospheric circulation. The last edition of the Hess-Brezowsky catalog (Gerstengarbe F.W., Werner P., 2005) includes a time series of 124 years (1881-2004). This classification distinguishes 29 macrosynoptic situations or Great Weather Positions (Grosswetterlagen or GWL). Although GWL are defined according to geographical location of the action centers and the movement of frontal zone over central Europe, this typology is generally accepted to display characteristics of the atmosphere circulation on the territory of the European continent. This classification uses the distribution of pressure at sea level and geopotential hights of 500 hPa.
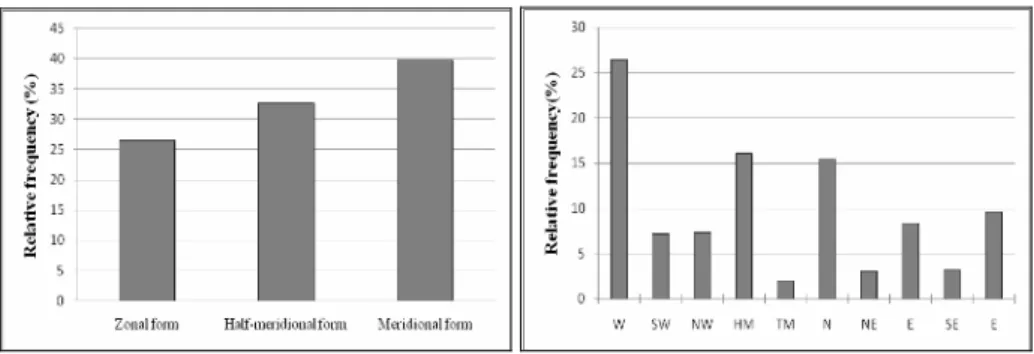
The GWL are grouped into the three circulation forms and 10 types (Grosswetterlagen or GWT). The forms and types are commonly used in research on changes in the circulation. One of the main features of this typology is that each GWL must be at least 3 consecutive days. Figure 1 shows the annual frequency of circulation forms (days) for the period 1949-2004., while figure 2 shows the annual relative frequency (%) forms and GWT, also for the period 1949-2004.
Table 1. Circulation forms, circulation types (GWT) and GWL.
Circulation form GWT GWL
Zonal West(W) WA, WZ, WS, WW
Southwest (SW) SWA,SWZ Northwest (NW) NWA, NWZ Central European high (HM) HM, BM Half-meridional
Central European low (TM) TM
North (N) NA, NZ, HNA, HNZ, HB, TRM
Northeast (NE) NEA, NEZ
East (E) HFA, HFZ, HNFA, HNFZ Southeast (SE) SEA, SEZ
Meridional
99
Figure 1. 10-yr running means of frequency (days) of circulation forms, 1949-2004.
Figure 2. Annual relative frequency (%) of circulation forms (left) and GWT (right), 1949-2004.
For annual precipitation were used the data for 17 stations in Serbia. From these values were obtained the data for Serbia as a whole. The analysis was limited to the period 1949-2004. by the cause of availability the data.
In analysis were used the linear correlation and the data were processed on move decadal level. Also, the research was expanded to the cloudiness. Reasons for data processing for cloudiness resulting from the need to extend to investigates, and so perceive the relationship between these two climatic elements together, and the introduction of circulation factors. Correlation analysis has shown a positive connection between precipitation and cloudiness. The value of Pearson’s correlation coefficient is ranged from 0.32 for Novi Sad to 0.69 for Smederevska Palanka. Generally, stations in the north and south/southwest Serbia have shown relatively lower values of coefficients. This could be explained by characteristics of their position.
The data for the frequency of circulation forms and annual precipitation amounts for Serbia as a whole were used in the process the multiple linear regression, and six clusters which were formed by grouping the 17 stations using method "weighted pair group" where the similarity measure is based on the Pearson’s correlation coefficient. The data were also processed on a moving decadal level.
The method of linear trend was used in order to considered the changes of the analyzed variables (circulation, precipitation, cloudiness) in the period 1949-2004.
Results
100
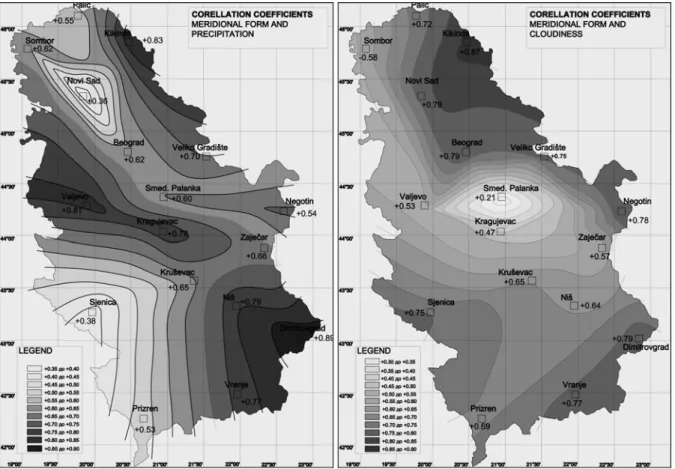
most of cases (only exception is station Palić with 0.17). Correlation coefficients are significant for 12 stations. The value of Pearson’s coefficient is -0.47 for Serbia as a whole. The strongest (negative) correlation was obtained for stations in the south/southeast and eastern Serbia (Vranje -0.61, Dimitrovgrad -0.63, Negotin -0.53 and -0.56 Zaječar). The weakest correlation is in the central parts of Serbia (Beograd 0.04, Smederevska Palanka 0.14, Kragujevac 0.30, Kruševac 0.39) and to the south/southwest (Sjenica 0.03, Prizren 0.33). The relatively high value of correlation coefficients in the north of Serbia (Novi Sad, -0.44, Sombor -0.56, Kikinda -0.57) disturbs the value obtained for the station Palić (0.17). If we exclude the factor of homogeneity of data for this station, one of the options is that north of Palić the correlation between frequency of zonal form and annual precipitation is positive.
Comparing the results for precipitation and for cloudiness (obtained in the analysis with zonal form) we can see the significant differences in the the amount coefficients for some station.The biggest difference is obtained for Belgrade (-0.04 and -0.76), followed by Sjenica (-0.03 and -0.57), Prizren (-0.33 and -0.81) and Veliko Gradište (-0.25 and -0.60).In these examples we can see much more the coefficients for the cloudiness than precipitation. However, stations in the south/southeast and the north of Serbia have more value coefficients in the case of annual precipitation, although not as dramatically as in the mentioned examplesand with the exception of Kikinda (Table 2).
Table 2. Correlation coefficients for the frequency of circulation forms with the precipitation (R) and cloudiness (O), 1949-2004. The data for the station Sombor are for period 1950-2004. Bold values are
significant at the 0.05 level.
Zonal form Half-meridional form Meridional form
Station R О R О R О
1.Beograd -0.04 -0.76 -0.70 -0.58 0.62 0.79
2. Valjevo -0.42 -0.62 -0.75 -0.32 0.81 0.53
3. Veliko Gradište -0.25 -0.60 -0.72 -0.63 0.70 0.75
4. Vranje -0.61 -0.42 -0.65 -0.75 0.77 0.77
5. Dimitrovgrad -0.63 -0.53 -0.77 -0.68 0.89 0.79
6. Zaječar -0.56 -0.37 -0.55 -0.43 0.66 0.57
7. Kikinda -0.57 -0.58 -0,67 -0.72 0.83 0.87
8. Kragujevac -0.30 -0.11 -0,80 -0.53 0.78 0.47
9. Kruševac -0.39 -0.47 -0.62 -0.59 0.65 0.65
10. Negotin -0.53 -0.68 -0.42 -0.62 0.54 0.78
11. Niš -0.37 -0.36 -0.78 -0.63 0.79 0.64
12. Novi Sad -0.44 -0.32 -0.11 -0.82 0.36 0.78
13. Palić 0,17 -0.28 -0.73 -0.77 0.55 0.72
14. Prizren -0.33 -0.81 -0.45 -0.44 0.53 0.69
15. Sjenica -0,03 -0.57 -0.38 -0.64 0.38 0.75
16. Smed. Palanka -0,14 0.12 -0.65 -0.32 0.60 0.21 17. Sombor -0.56 -0.34 -0.42 -0.60 0.62 0.58
101
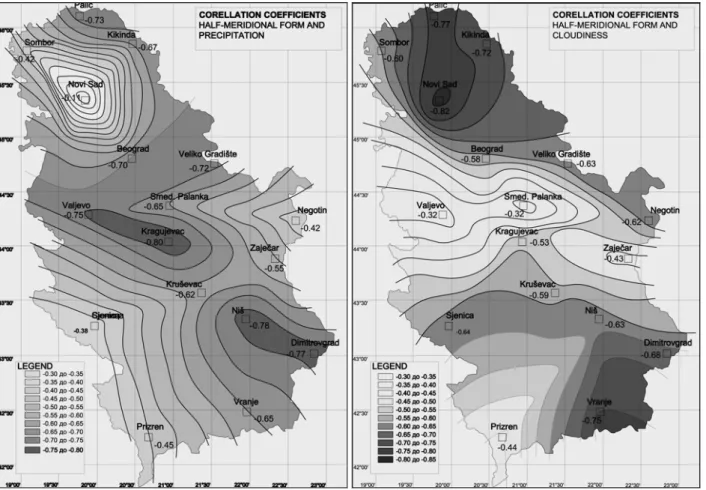
In analysis of the frequency of half-meridional form and annual precipitation a negative sign of coefficients was obtained for all stations, while only one station is insignificant (Novi Sad with -0.11). In relation to the zonal form here we were obtained relatively higher values of the correlation coefficients (for 7 stations over the coefficient -0.70).For Serbia as a whole coefficient is R -0.77, and correlation of these two variables can be characterized as a strong negative. The weakest relationship (medium strenght) was again found for the south/southwest of Serbia (Sjenica -0.38, Prizren -0.45). The relatively low values were obtained for the stations Zaječar and Negotin (-0.55 and -042 respectively).The strongest correlation was found for the central, western, south/southeast and north-eastern part of Serbia. Low value of coefficient for Novi Sad (-0.11) makes this station lonely in relation to the other stations in the region. The cause of this may be required in the quality of data, but also in any local peculiarities of the position this station.
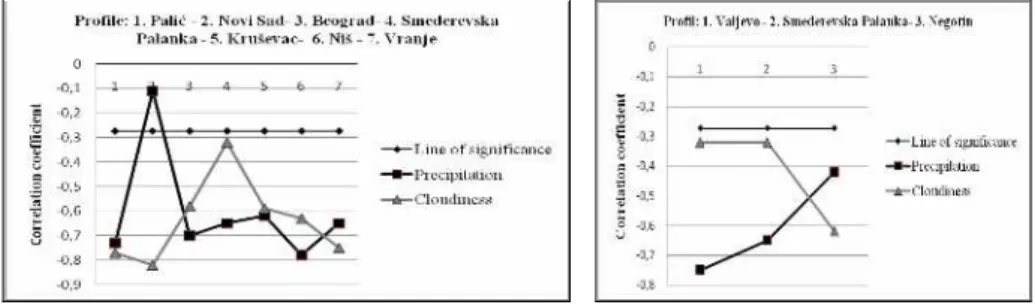
With profiles the directions of north-south and west-east we can see the differences in spatial distribution coefficients for precipitation and for cloudiness on example thefrequency of half-meridional form (figure 3). For the first profile (figure 3, left) direction of north-south, the most notable difference in amount of coefficients is for Novi Sad (even drastic -0.11 for precipitation versus -0.82 for cloudiness) and Smederevska Palanka (-0.65 for precipitation versus -0.32 for cloudiness). For the second profile direction of west-east (Valjevo –Smederevska Palanka – Negotin), the intensity of relationship in case of precipitation (cloudiness) decreases (increases) towards the east (figure 3, right).
Figure 3. The profiles directions of north-south and west-east on examples correlation coefficients for half-meridional form with precipitation and with cloudiness.
In table 3 are given results for the frequency of circulation types and annual precipitation (mean annual cloudiness) of Serbia as a whole. The most significant results were obtained for the NW type (-0.67 for precipitation and -0.32 for cloudiness) and NM (-0.72 for precipitation and -0.70 for cloudiness) from the all types that belong to half-meridional circulation form.
Table 3. Correlations coefficients for the frequency of circulation forms with the precipitation (R) and cloudiness (O) of Serbia as whole, 1949-2004. Bold values are significant at the 0.05 level.
W SW NW HМ TM N NE E SE S
102
103
The meridional circulation form is positively related with annual precipitation from 17 stations and for Serbia as a whole. Statistically significant relationship was obtained in all cases. For Serbia as a whole coefficient is 0.83 and correlation of these two variables can be characterized as strong positive. Spatial disposition of the connection strength is similar to half-meridional form, just a positive sign of the connection. Again for Novi Sad was obtained lower, but now statistically significant value (0.36). The largest part of Serbia shows a strong positive relationship with meridional form. The strength of connection declines towards southwest (Sjenica 0.38, Prizren 0.53). The strongest connection was found for the south/southeast (Nis 0.79, Vranje 0.77, Dimitrovgrad 0.89), northeast (Veliko Gradište 0.70, Kikinda 0.83) and the west of Serbia (Valjevo 0.81).
The strong positive correlation with annual precipitation amounts and average annual cloudiness has shown NE, E, SE and S circulation type, while for N type connection insignificant (table 3). All of them belong to meridional circulation form.
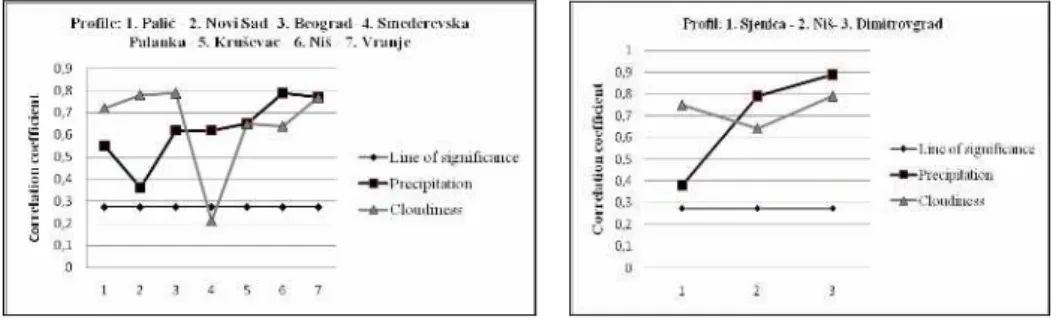
The difference in the spatial distribution of intensity correlation for precipitation and for cloudiness again is clearly evident in the profile of the north-south (the most prominent example of Smederevska Palanka, 0.60 for precipitation versus 0.21 for cloudiness), but also the profile of south west-east direction (Figure 5).
Figure 5. The profiles directions of north-south and west-east on examples correlation coefficients
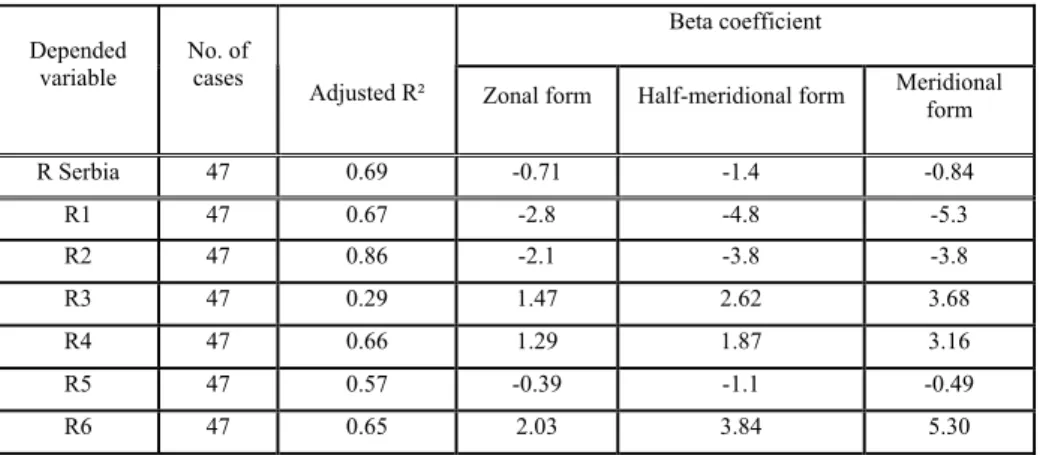
According to multiple linear regression (table 4) the contribution of atmospheric circulation in the variability of annual precipitation of Serbia as a whole is 69%.The greatest involvement of the variance dependent variable (rainfall) is with halfmeridional form (beta coefficients is 1.4), then halfmeridional form (beta coefficients is -0.84) and at least with zonal form (beta coefficients is -0.71). In the case of clusters the highest value of coefficient of determination (0.86) is obtained for the cluster R2 (make it a station on the south/southeast of Serbia: Vranje, Niš, Kruševac, Dimitrovgrad) and the lowest values (0.29) for the cluster R3 (station on the south/southwest: Sjenica and Vranje).
Figure 6. Meridional circulation form and annual precipitation (left) and meridional circulation form and mean annual cloudiness (right), 1949-2004.
105
While zonal form for all clusters shows the lowest value of beta coefficient, the half-meridional form only in the case of cluster R5 (Veliko Gradište, Valjevo, Smederevska Palanka, Kragujevac) beta coefficient is higher than the values of beta coefficients obtained for meridionalnu form.
Table 4. The results of the multiple linear regression
Beta coefficient Depended
variable
No. of cases
Adjusted R² Zonal form Half-meridional form Meridional form
R Serbia 47 0.69 -0.71 -1.4 -0.84
R1 47 0.67 -2.8 -4.8 -5.3
R2 47 0.86 -2.1 -3.8 -3.8
R3 47 0.29 1.47 2.62 3.68
R4 47 0.66 1.29 1.87 3.16
R5 47 0.57 -0.39 -1.1 -0.49
R6 47 0.65 2.03 3.84 5.30
R1- Zaječar, Negotin; R2- Vranje, Niš, Kruševac, Dimitrovgrad; R3- Sjenica, Prizren; R4- Sombor, Palić; R5- Veliko Gradište, Valjevo, Smederevska Palanka, Kragujevac; R6- Novi Sad, Kikinda, Beograd.
Annual frequency of the zonal and half-meridional forms show a positive linear trend (for the first 0.046 days/year, for the second 0.408 day/year, the significant at the 0.05 level only in the second case), while the meridional form gets a negative value of linear trend (-0.416 days/year) for the period 1949-2004. For circulation types from half-meridional group (except TM type) the trend of annual frequency is positive. For half-meridional types just south (S) show a positive trend, while for others the values of the trends are a negative sign.
Analysis of trends for annual precipitation shows the positive trend at 6 stations and the negative trends at 11 stations and for Serbia as a whole. Positive values of the trends in the north (Novi Sad 1.074 mm/year, Palić 0.020 mm/year, Sombor 0.442 mm/year) and the southwest of Serbia (Prizren 2.484 mm/year and 2.491 mm/year, both significant at 0.05 level) . The negative trends with the highest values for the stations in eastern Serbia (Zaječar -1.986 mm/year, Negotin -2.760 mm/year, both significant at 0.05 level), south/southeast of Serbia (Vranje -1.522 mm/year, significant at 0.05 level, then Dimitrovgrad -0.612 mm/year) and northern part of Serbia (Veliko Gradište -0.616 mm/year).
The fact that the negative trends were established for annual precipitation amount at most of stations and with the greatest value to those stations that showed the strongest positive relationship with meridional form (which also noted a negative trend in the analyzed period of time) confirms the importance of atmospheric circulation as a factors of variability of precipitation. If we remember, this group includes stations with south/southeast of Serbia (cluster R2), which has been shown that 86% rainfall variability can be explained by changes in atmospheric circulation.
106
negative: Sjenica -0.006/year and Prizren -0.009/year, both significant trends in the probability of risk of 0.05. If we remember data from the beginning of this work (chapter data and methods), for this part of Serbia was received relatively lower value of the strength correlation between the precipitation and cloudiness (although the connection is a positive sign which opens up another question). Therefore it remains to conclude that we not talk about the direct relationship between precipitation and cloudiness as the climate elements, but also during the same macrosynoptic conditions these elements take on different space-time development. In addition to this, the negative trend of mean annual cloudiness is for the stations in northern Serbia (Novi Sad -0.010/godini, Palić 0.008/year and Sombor -0.010/year, significant at 0.05 level in all three cases). Also interesting is station Zaječar where is a significant negative trend of annual precipitation and a positive trend in annual mean cloudiness (0.005/year, significant at 0.05 level).
The regional aspect of the analyzed processes is illustrated by example stations Kikinda on the best way. This is the only station in the north of Serbia for which obtained a negative value of linear trend of annual precipitation (-0.624 mm/year). This is a station where was obtained the value of correlation coefficient of 0.83 in connection with the frequency of the meridional form, which is still significantly higher compared to the stations in the region. For the mean annual cloudiness of the station Kikinda was obtained a negative trend (-0.001/year).
Conclusion
In this study was obtained a statistically significant correlation between the variability of atmospheric circulation and annual amount of precipitation on the territory of Serbia in the period 1949-2004. The circulation of the atmosphere is represented by Hess-Brezowsky typology, and the paper used data for the frequency of the circulation forms and types. By using appropriate statistical procedures were obtained following results:
- In most of cases and for all three circulating forms the correlation is statistically
significant, a negative sign for the zonal and half-meridional form and a positive sign for meridional circulation form. It is shown the imbalances in the spatial distribution power connection. The strength of correlation is not uniform in space.
- NE, E, SE and S circulation types show a strong positive correlation with the
annual precipitation amounts of Serbia as a whole. The strong negative relationship was obtained for the NW and HM type, while the moderate negative correlation obtained for the SW type and W circulation type.
- According to multiple linear regression (table 4) the contribution of atmospheric
circulation in the variability of annual precipitation of Serbia as a whole is 69%. For clasters that values is in the range of 29% in the south/southwest of Serbia to 86% for stations on the south/southeast Serbia.
- The sign of correlation for the frequency of circulation forms and types with the
mean annual cloudiness is the same as for precipitation, but the differences occur in values of coefficients, what is the most evident on the profiles directions of north-south and west-east. The uniform coefficients in the analysis of the frequency of circulation forms with precipitation and clouds occur only in case the data for Serbia as a whole (although it is recorded in the case a few station).
- The precipitation and cloudiness recorded different spatial-temporal development
107
The results of this work, as well as the results for the territory of Hungary and Romania and other neighboring countries (Bartholy J., Pongrácz R., 2006; Cazacioc L.V., Cazacios A., 2006; Domonkos P. et al., 2003), in which also applied this classification method to define circulation factors justifying its use in research for this part of the European continent. Also, this authors use the Hess-Brezowsky typology in analysis teleconnections (ENSO, NAO, AO). We can conclude that there is great complexity and conditionality of phenomena and processes within the climate system, but that the certain changes may to follow by the analysis of characteristics of atmospheric circulation. Like a task, the continuation of this work will certainly have a seasonal aspect of the analyzed problems.
References