Article
*e-mail: [email protected]
Ozonation of Azo Dye Acid Black 1 under the Suppression Effect by Chloride Ion
Alexandre Paprocki, Heldiane S. dos Santos, Marta E. Hammerschitt, Marçal Pires and Carla M. N. Azevedo*
Faculdade de Química, Pontifícia Universidade Católica do Rio Grande do Sul, Av. Ipiranga, 6681, 90619-900 Porto Alegre-RS, Brazil
O objetivo deste estudo é determinar a cinética degradação do corante Acid Black 1 por ação oxidante do ozônio e avaliar a inluência da contaminação de íons cloreto na degradação deste corante. Foram observadas cinéticas de pseudo-primeira ordem, tanto para a degradação das estruturas cromóforas (620 nm), quanto das aromáticas (321 nm). A completa remoção da coloração foi veriicada em 25 min ([corante]0 = 1,8 × 10⁻⁵ mol L-1), enquanto que as estruturas
aromáticas foram degradadas com menor velocidade. A presença de íon cloreto, principal impureza do reagente sólido, inluencia signiicantemente a velocidade de ozonização (−42%), mesmo em baixa concentração (5,6 × 10⁻⁴ mol L-1). O mecanismo mais provável para o efeito supressor do íon
cloreto envolve a direta reação entre O3 e Cl− gerando HOCl, dentre outros subprodutos. Apesar
deste aspecto, a ozonização pode ser um processo de degradação competitivo para este corante.
The aim of this study is to determine the kinetics of the Acid Black 1 dye by oxidizing action of ozone and to evaluate the inluence of chloride ion contamination on the dye degradation. Pseudo-irst order kinetics was observed for both decolorization (620 nm) and aromatic structure (321 nm) degradations. A complete color removal was veriied in 25 min ([dye]0 = 1.8 × 10⁻⁵ mol L-1), while
aromatic structures degraded at slower rates. The presence of chloride ion, the principal impurity of the solid dye reagents, inluences signiicantly the ozonation rate (−42%), even at low chloride concentration (5.6 × 10⁻⁴ mol L-1). The most probable mechanism for the chloride suppression
effect involves a direct reaction between O3 and Cl− generating HOCl, among other by-products.
In despite of that, ozonation could be a competitive degradation process for this dye.
Keywords: azo dye, ozonation, salt additives, chloride ion, suppression effect
Introduction
The Acid Black 1 (C.I. 20470) is an important azo dye widely used in the textile industry. This compound is used not only to dye or to print on synthetic and natural ibers, but also as intermediate in the synthesis of other azo dyes. Another application of the Acid Black 1 is as indicator to assist in the protein separation for chromatography and
electrophoresis analyses.1
Textile efluents, when not correctly treated, can cause high impact to the environment. Azo dyes are considered as harmful compounds due to their mutagenic and carcinogenic characteristics. The toxicity of theses dyes is often related to
the amines employed or formed in their syntheses.2
Dye wastewaters can be treated by conventional processes, such as activated carbon absorption or
coagulation, or by alternative technologies including
electrochemical treatment,3,4 absorption using new materials
and advanced oxidative processes (AOPs).5 Despite the fact
that ozonation in acid medium is not an AOP, O3 proved
to yield excellent results on dye efluents treatment.6-9
Some studies have been reported about destruction of Acid
Black 1 by ozonation.10-13 However, none of these studies
concerned the by-products formation during ozone attack. The possible interferences on ozonation eficiency by the presence of additives have been reported for the
treatment of the dyes,9,11,14,15 as well as for other class
of compounds.16,17 However, the available information
concerning the role of these dye additives on the kinetics
and by-product formation is scarce.16 The inorganic salts
are the most common additives used, as exhausting and retarding agents, during textiles dyeing processes and its
quantity varies from 5 to 60 g L-1.18 Gahr et al.19 mentioned
efluent and reported that, at higher levels, the presence of salt lowers the decomposition of reactive dyes.
Muthukumar et al.11 observed that the ozonation
kinetics of the Acid Black 1 is affected by the presence of some sodium salts (carbonate, chloride and sulfate). These authors explained the inluence of added salts by
side-reaction with O3, which becomes less available for
dye degradation. However, with respect to chloride ion,
Gunten20 stated that inorganic chlorine-derived by-products
are only formed during ozonation if Cl− aqueous solution
is pretreated with chlorine or chlorine dioxide.
The inluence of the impurities, commonly encountered
in commercial dyes, is less studied. According to Lyon,21
these impurities present in dyes are: (i) diluents such
as inorganic salts, starch and dispersing agents; (ii)
by-products formed during manufacture and (iii) dyes
of different constitution and color that are added for
shading. Zhang and co-workers14 investigated the effects
of impurities on the ozonation degradation of the azo dye C.I. Reactive Red 120. These authors compared the results obtained for unpuriied (75%) and puriied (90%) dyes, and concluded that the presence of impurities affects mostly the
biodegradability of the dye. Zhang et al.14 also suggested
that dyes need to be puriied before ozonation treatment if detailed information on the oxidative processes and by-production formation are required.
In this context, special attention has been given to chloride ion that is additive as well as impurity for textile
dyes.9,11,14,15,18,19,22 When present as additive, at relatively
high concentration (0.5-5 g L-1), Cl− seems to play an
important role on dyes degradation processes.9,11,15,18
The possible inluence of the low chloride concentration
(< 50 mg L-1, as an impurity) on dye ozonation has not been
reported in literature. Despite the importance of chloride in this system, the mechanism of its action on dye ozonation is not completely understood.
The aim of this study is to determine the kinetics and by-products formation on the Acid Black 1 ozonation and to evaluate the inluence of sodium chloride impurity on
dye degradation. The reaction between O3 and Cl− was
also investigated for a better understanding of the chloride suppression effect. Finally, the literature data about Acid Black 1 degradation processes as well as the chloride suppression effect on dye ozonization are discussed.
Experimental
Materials
The Acid Black 1 reagent (C.I. 20470) was obtained as a commercial dye from two suppliers Acros (purity 63.2%)
and Sigma (> 80%). In Figure 1 the chemical structure of
the dye, which has a molecular formula C22H14N6Na2O9S2
(616.48 g mol-1) and solubility less than 0.1 g L-1 in water,
is shown. The reagents were used as received and Acros dye reagent was also puriied to verify the possible inluence
of impurities on degradation process.22 The aqueous
solutions containing nominal concentrations of the 5, 10
and 20 mg L-1 on dye reagent were used in kinetic tests. All
solutions were prepared with ultra pure water (MilliQPlus,
Millipore; < 18 MΩ cm). Chloride ion work solutions were
prepared using NaCl (Merck, 99.5%) or HCl (Merck 37%). All other reagents used were of analytical grade.
Dye purification was performed following Lankin
procedure,22 which consists of the several sequential
washings with sodium chloride and aqueous isopropanol solutions. In this way, 5 g of dye was weighed into centrifuge bottle and 10 mL of 6% sodium chloride solution was added and shaken vigorously for 20 min and centrifuged (2,000 rpm) for 10 min. The supernatant was separated and the treatment was repeated one more time with 6% sodium chloride solution and twice with aqueous isopropanol (100:20, isopropanol:water, v/v). For these washings the period of stirring was 10 min and then the dye was iltered using a Buchner funnel and dried in an oven
at 110 oC. Next the dye content on solid was estimated by
its absorbance (λmax 620 nm) on aqueous solutions using
Lankin absorption coeficient (E11%cm 921).
Experimental set-up
The experimental set-up consisted of a prototype corona discharge generator (OZ Engenharia, Brazil) which uses dried atmospheric air to generated ozone, driven by air
pump with low rate of 1.32 ± 0.04 L min-1. Production
rate was 35 mg O3 h-1, determined by iodometric and
spectrophotometric methods. 6,23 The on-line O
3 absorbance
was measured by UV-visible spectrophotometer (Micronal, B382) using a quartz low cell (path length 10 mm) at 254 nm. Dye solutions (0.15 L) were ozonized in a cylindrical glass reactor (volume 0.2 L) by bubbling ozone/air mixture into the solution through a sinterized glass ilter (pore size
50-80 µm). Due to the small reactor volume, 0.15 L fresh
dye solution was used for each reaction time period studied (1 up to 25 min). Excess ozone leaving the reactor was trapped by two sequential bubblers containing KI aqueous
solution (2%). After ozonation the samples were purged for
5 min with N2 to remove residual ozone. All experiments
were conducted at room temperature (295 ± 1 K).
Analyses
The optical absorption of dye solutions was determined and recorded by a UV-Vis spectrophotometer (Hewlett Packard 8453) through a 10 mm path length. In order to calculate the kinetics, the concentrations of the dye in solution were determined by its absorbance at maximum absorption wavelengths in the visible (620 nm) and UV
(321 nm) regions following standard procedure.24
Organic and inorganic anions and inorganic cations were determined by ion chromatography (Dionex DX500) operated in autosuppression recycle mode and equipped with a conductivity detector, detailed methods are described
elsewhere.6 Ion chromatography technique (IC) allowed
separation and quantification of most important low molecular carboxylic acids (formic, acetic and oxalic), inorganic anions (fluoride, chloride, nitrite, bromide, nitrate, phosphate and sulfate) and cations (sodium, potassium, calcium and magnesium). The detection limits,
for all compounds, were ≤ 5 µg L-1. Chloride ion present
as impurity on dye solutions was also determined by Ion Selective Electrode (ISE) using sensing (Orion, Model 96-17B) and double-junction reference (Orion Model 90-02)
electrodes following standard procedure.20 Conductivity
(Digimed DM-41) and pH (Digimed DM-21) were also determined in some tests.
Due to the possible chloride interference on dye
ozonation reaction,9,11,14,15 some experiments were
performed with O3 and Cl− solutions, without the presence
of Acid Black 1. For theses tests, chloride ion was supplied
from either NaCl or HCl solutions (2.8×10⁻⁴ mol L-1) and its
concentration was monitored by IC and ISE techniques.6,25
Chloride solutions were ozonized, following the procedure described previously, and the UV-Vis spectra were obtained at different reaction times, using 10 and 100 mm path length cells. For comparison, the individual spectra of the
sodium hypochlorite and ozone (in 0.25 mol L-1 H
2SO4)
were obtained in same conditions.
Results and Discussion
Dye puriication
Since the eficiency of ozonation might be affected by salt additives and/or dye reagent impurities, preliminary tests were performed to assess dye purity and the presence of possible contaminants on puriied and unpuriied reagents.
The purity information about dye reagents were obtained from supplier catalog and in the certiicates of analysis. For Acros reagent a purity of 63.2% is mentioned while a higher content is indicated to Sigma reagent (> 80%) both on dry basis. However, the measured dye contents for
unpuriied reagents indicated different values, 61.2 ± 0.5%
(moisture 12.1 ± 0.3%) for Acros and 86.6 ± 0.8% (moisture
8.7 ± 0.6%) for Sigma on dry basis. The higher puriication
level was obtained for Acros reagent with dye purity increasing from 61.2 to 86.3%. Same tests were performed
using the puriied reagent (Acros ca. 86%).
In Figure 2 the spectra of Acid Black 1 solutions from unpuriied Acros and Sigma reagents and puriied Acros
reagent, prepared in the same conditions (20 mg L-1, natural
pH) is shown. The three spectra presented in this igure are similar in all wavelength range studied (190-800 nm). The obtained data is also in good agreement with literature
data.1 These results indicate that the presence of possible
contaminants does not interfere on dye absorption.
The IC and ISE analyses (not shown) indicated that chloride ion is the most important impurity identiied on dye reagents (not ozonized). Unpuriied Acros and Sigma reagents presented chloride contaminations of 6.8 and 2.0% (m/m on dry basis), respectively. Phosphate ion was
also identiied at average level ca. 0.5% in both unpuriied
dye reagents, while other anions (potential identiiable by IC) were not detected. The most abundant cations were found in the following order: Na+ >> Ca2+ >> K+ > Mg2+
for unpuriied dyes. These results were expected because
the probable chloride counter ion is sodium.22 On the other
hand, puriied Acros dye presents a signiicant decrease on
Ca2+ (−98%) and Na+ (−42%) contents, while K+ and Mg2+
levels did not change with the puriication process. The
inorganic impurities on the Acros reagent correspond to ca.
30% of the dye contamination while organic species, such as starch or other dye synthesis by-products, are responsible
for 70% of the impurities.2
Figure 2. Spectra of the aqueous solutions (nominal concentration
Ozonation kinetics
Preliminary tests were performed using the Acros unpuriied reagent (61%), for comparison with literature data. In Figure 3 the absorption spectra of Acid Black 1
solution (1.8×10⁻⁵ mol L-1) during the ozonation process are
shown. A quick decrease in absorption band at 620 nm was observed, resulting in a decolorized solution, suggesting a rapid destruction of the dye chromophore structure (-N=N-) directly by ozone. Under these conditions decolorization was completed in 25 min reaction time. On the other hand, the absorbance at 321 nm, wavelength generally attributed to aromatic structures, presented a less intense diminution. These results indicated that chromophore group seems to be less recalcitrant to ozone attack compared to aromatic dye moiety.
Similar results were observed for other dye concentrations studied, prepared with the same dye reagent
(Acros 61%). Complete color removal (λmax 620 nm,
A < 0.001) was observed after reaction times of 6 and
11 min for initial dye concentration of the 4.5×10⁻⁶ and
8.9×10⁻⁶ mol L-1, respectively.
Kinetic parameters were obtained following dye degradation at their maxima visible and UV absorption bands (620 and 321 nm). The reproducibility of these calculations was evaluated by replicate tests and errors were in the range of 4.3-5.0%. According to previous studies the ozonation in a continuous purging mode could be formulated by equation (1), considering only direct
oxidation by molecular ozone.10,13,24 The indirect oxidation
by hydroxyl free radicals can be neglected because the low hydroxide ion concentration in solution at pH used (< 5.3).
d[dye]
–––––– = –k0[O3][dye] (1)
td
where [dye] and [O3] are the concentrations of Acid Black 1
and ozone, and k0 is the corresponding kinetic rate constant.
In addition, ozone concentration in the solution can be assumed to be constant through the continuous ozone
supply thus the term k0[O3] is constant, therefore the
equation (1) can be simpliied to,
d[dye]
–––––– = –k[dye] (2)
td
where k is the overall pseudo-irst-order rate constant. Finally, as dye concentration is proportional to absorbance
(at speciic λ), the equation (2) becomes:
[Abs]t = [Abs]0e-tk (3)
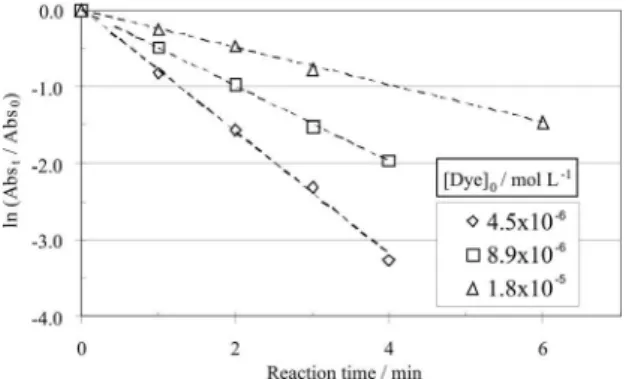
In Figure 4 the calculated logarithmic absorption ratio
(at λmax 620 nm) for ozonation at three different initial dye
concentrations is shown. These results conirmed pseudo-irst order kinetics. Several authors have also reported pseudo irst-order kinetics for reactions between different
dyes and ozone.7,8,13,14,22 The similar result was observed
at 321 nm (not shown) which suggests the same kinetics behavior, but at lower ozonation rate (four times slower) for aromatic degradation. A summary of the kinetics data, pH and conductivity measurements, obtained during Acid Black 1 ozonation, is presented in Table 1. The inverse relation between the dye concentration and the ozonation
rate was observed, in accordance with literature.4,5,8,20 The
decrease of pH was expected, due to the formation of inorganic and organic acids during ozonation, conirmed by a signiicant conductivity increase, more pronounced for high dye concentrations.
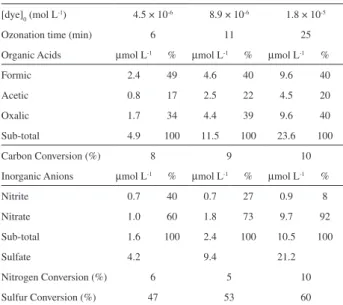
By-products formation
To achieve detailed information on the dye degradation
by O3, complementary studies about ionic by-products
generation were performed for ozonized solutions of the unpuriied Acros dye reagent. The data presented in Table 2
Figure 3. Absorption spectra of the Acid Black 1 (1.8×10⁻⁵ mol L-1)
solutions prepared with unpuriied reagent (Acros 61%) at different ozonation times (35 mg O3 h-1).
Figure 4. First-order ozonation degradation of unpuriied Acid Black 1
shows that sulfate and carboxylic acids (formic, oxalic and acetic) were the main oxidation by-products (chloride is also present but as a dye impurity). These species were not observed as dye contaminants (initial concentrations < LD) but were actually formed during dye ozonization in all
concentration conditions studied (4.5×10⁻⁶ to 1.8×10⁻⁵ mol L-1).
Nitrite and phosphate (not shown) were also detected but
at lower concentrations (< 1 µmol L-1). Formic acid is
the principal organic compound formed, corresponding 40-49% of total identiied short chain carboxylic acids. Oxalic acid was the second most abundant acid (34 up to 40%), with acetic acid presenting lower concentrations
(0.8-4.5 µmol L-1). These organic acids correspond to 8-10%
of the initial dye concentration expressed in carbon basis.
The molecule of Acid Black 1 also contains six nitrogen atoms in the form of azo (4), amino (1) and nitro (1) groups and two sulfur atoms in the form of sulphonic groups (Figure 1). These heteroatoms react in different ways with ozone due to their speciic reactivity and process conditions
(O3 dose, pH etc), being converted in several intermediates
and end-products.22 A partial transformation (5-10%) of
nitrogen atoms into nitrate and nitrite were observed. The
remaining nitrogen atoms could still be in amino form or be converted into nitro-compounds, more recalcitrant to ozone attack. On the other hand, sulfonic groups seem to be easily converted to sulfate with high yields (up to 60%). It is also observed a raise of sulfur conversion with increase of the dye concentration (from 47 to 60%). These preliminary results and the presence of the small organic fragments (carboxylic acids) indicated that the dye structure was not completely mineralized under the prevailing oxidation conditions.
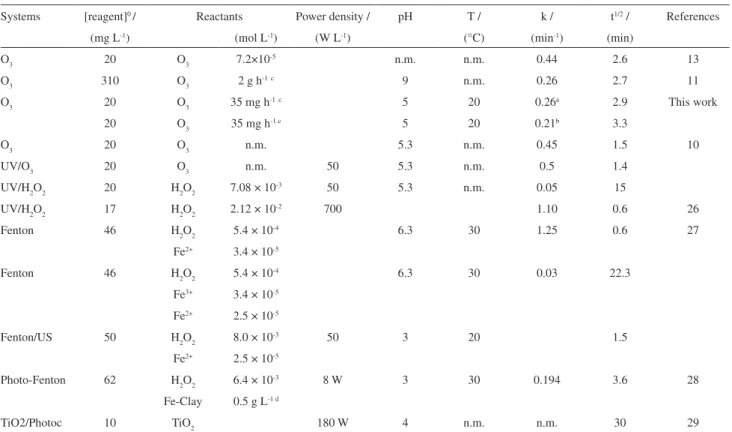
Comparison with other degradation processes
In Table 3 a summary of the literature data about Acid
Black 1 degradation processes is shown.10,11,13,22-29 Only
three works concerning Acid Black 1 ozonation kinetics were found and unfortunately in some studies important experimental conditions were not cited (pH, temperature,
O3 concentration etc). Shu and co-workers10,13 also
obtained pseudo irst-order kinetics for unpuriied Acid
Black 1 ozonation. A rate constant of the 0.45 min-1 was
calculated for a reagent dye concentration of 20 mg L-1. In
these conditions a t1/2 =1.6 min was obtained, indicating a
faster kinetics compare to our system (t1/2ca. 3 min). This
behavior is probably due to higher ozone doses used by these authors. It is dificult to draw a comparison of these
data with results obtained by Muthukumar et al.11 due to
different experimental conditions used (basic medium with
higher O3 and dye concentrations).
Only two degradation processes (Table 3) present
faster kinetics than ozonation: UV/H2O2 (power density
700 W L-1) and Fenton with t
1/2ca. 0.6 min.26,27 All other
processes have similar or lower kinetic rates compared to
O3 treatment. However, generic conclusion must be made
with caution due to the different experimental conditions used in some studies.
Another important aspect is the stated initial Acid Black 1 concentrations in Table 3, which in fact represent the dye reagent concentration. As shown in the present study, very different purities of the Acid Black 1 reagents could be found, 61 and 87% which rate constants of the 0.26
and 0.21 min-1, respectively. As consequence, signiicant
differences on actual dye concentration are obtained
Table 1.Rate constants and reaction half-times of the ozonation of the Acid Black 1 solutions (reagent Sigma 61%), measured at λmax. 620 and 321 nm at
ambient temperature (295 ± 1 K)
[reagent]o / (mg L-1)
[dye]o / (mol L-1)
620 nm 321 nm pH conductivity / (µS cm-1)
k / (min-1) t
1/2 /(min) k / (min-1) t1/2 / (min) Initial/Final
5 4.5 × 10⁻⁶ 0.80 0.9 0.19 3.6 5.22/4.95 5.56/13.43
10 8.9 × 10⁻⁶ 0.50 1.4 0.12 5.8 5.27/4.54 6.60/11.31
20 1.8 × 10⁻⁵ 0.26 2.7 0.10 6.9 4.96/4.04 11.08/58.90
Table 2. By-products generated from ozonized solutions at different Acid
Black 1 concentrations
[dye]0 (mol L-1) 4.5 × 10⁻⁶ 8.9 × 10⁻⁶ 1.8 × 10⁻⁵
Ozonation time (min) 6 11 25
Organic Acids µmol L-1 % µmol L-1 % µmol L-1 %
Formic 2.4 49 4.6 40 9.6 40
Acetic 0.8 17 2.5 22 4.5 20
Oxalic 1.7 34 4.4 39 9.6 40
Sub-total 4.9 100 11.5 100 23.6 100
Carbon Conversion (%) 8 9 10
Inorganic Anions µmol L-1 % µmol L-1 % µmol L-1 %
Nitrite 0.7 40 0.7 27 0.9 8
Nitrate 1.0 60 1.8 73 9.7 92
Sub-total 1.6 100 2.4 100 10.5 100
Sulfate 4.2 9.4 21.2
Nitrogen Conversion (%) 6 5 10
by using the same reagent concentration from different
suppliers. For instance, a reagent concentration of 20 mg L-1
resulting in dye concentrations of the 1.8×10⁻⁵ mol L-1
(unpuriied Acros 61%) and 2.4×10⁻⁵ mol L-1 (for unpuriied
Sigma 87%). If a correct dye concentration is not taken into account, kinetics data could be misinterpreA further problem is the role that those reagent impurities (for instance: 13 up to 39% in the dye reagents used in this work) could play on the dye degradation processes. Special attention has been given to the inorganic salts, normally present on dyestuff wastes from dye impurities
and/or salt added during textile processing.15,19 Among
these impurities, sodium chloride is a key species due to
its wide use on dye synthesis and puriication processes.19
Thus, the dye impurities, especially chloride ions, could be responsible for some discrepancies observed in literature data presented in Table 3.
Inluence of chloride ion on dye ozonation
In Table 4 the kinetics data of Acid Black 1 ozonation in presence of the different added chloride concentrations
(1.4×10⁻⁶ up to 2.8×10⁻² mol L-1) is shown. The dye
decay always followed pseudo-first-order kinetics no matter the NaCl was involved or not. However, reaction
rate signiicantly decreased (6 up to 42%) with chloride addition. This effect was observed for both puriied and unpuriied reagent (Figure 5), but in different ways. The most important inluence was observed for Acros 86%
(−42%) at 5.6×10⁻⁴ mol L-1 of the added chloride. A less
intense, but signiicant decrease (−35%) on rate variation,
was observed for unpuriied Acros dye at highest chloride
concentration tested (2.8×10⁻² mol L-1).
These results were not expected because other authors have reported a chloride suppression effect at
higher Cl− concentrations.9,11,15,16 Muthukumar et al.11,15
Table 3. Kinetic data of aqueous solutions of Acid Black 1 in different degradation systems
Systems [reagent]0 / Reactants Power density / pH T / k / t1/2 / References
(mg L-1) (mol L-1) (W L-1) (°C) (min-1) (min)
O3 20 O3 7.2×10⁻⁵ n.m. n.m. 0.44 2.6 13
O3 310 O3 2 g h-1c 9 n.m. 0.26 2.7 11
O3 20 O3 35 mg h-1c 5 20 0.26a 2.9 This work
20 O3 35 mg h-1 c 5 20 0.21b 3.3
O3 20 O3 n.m. 5.3 n.m. 0.45 1.5 10
UV/O3 20 O3 n.m. 50 5.3 n.m. 0.5 1.4
UV/H2O2 20 H2O2 7.08 × 10⁻³ 50 5.3 n.m. 0.05 15
UV/H2O2 17 H2O2 2.12 × 10⁻² 700 1.10 0.6 26
Fenton 46 H2O2 5.4 × 10⁻⁴ 6.3 30 1.25 0.6 27
Fe2+ 3.4 × 10⁻⁵
Fenton 46 H2O2 5.4 × 10⁻⁴ 6.3 30 0.03 22.3
Fe3+ 3.4 × 10⁻⁵ Fe2+ 2.5 × 10⁻⁵
Fenton/US 50 H2O2 8.0 × 10⁻³ 50 3 20 1.5
Fe2+ 2.5 × 10⁻⁵
Photo-Fenton 62 H2O2 6.4 × 10⁻³ 8 W 3 30 0.194 3.6 28
Fe-Clay 0.5 g L-1 d
TiO2/Photoc 10 TiO2 180 W 4 n.m. n.m. 30 29
a Solid unpuriied reagents Acros 61% or b Sigma 87%; c ozone production of the O3 generators; d Fe-Acetylacetonate+bentonite loading 0.5 g L-1; n.m.: means not measured.
Figure 5. Inluence of added chloride (as NaCl) on kinetic constants of
working with concentrated chloride solutions (1.4×10⁻¹
to 2.6×10⁻¹ mol L-1) observed an increasing of ca. 60%
on reaction time for complete color removal. Soares et
al.9 also observed a negative effect in decolorisation of
Acid Blue 113 by O3 in the presence of NaCl (1.4×10⁻²
to 1.4×10⁻¹ mol L-1) and veriied a non linear behavior on
color removal by ozone with the addition of higher chloride concentration.
The observed chloride suppression on dye ozonation rate constant is complex and indicates a possible
inhibition effect at high Cl−levels. In Figure 5, logarithmic
correlations between k and [Cl−] are obtained for three
studied conditions (Acros 61 and 86%, Sigma 87%). These results sugested that chloride suppression is not a linear effect in our system. A more detailed discussion about this behavior is presented in the next section.
The inluence of added salt on ozonation dye kinetics
could be related to a simple decreasing of O3 solubility
(salting effect). To test this hypothesis an empirical relation was used to account for ionic strength inluence on ozone
partition between gas and water phases (Henry constant).22
For higher chloride concentration (2.6×10⁻¹ mol L-1),
an important reduction on O3 solubility (16%) was
calculated. This fact could in part explain the decrease
on dye degradation rate observed by Muthukumar et
al.11 On the other hand, for low chloride concentration
(< 2.8×10⁻² mol L-1) an insigniicant decrease on ozone
solubility was estimated (< 2%). These calculations indicated that salting effects seem to remain marginal in our conditions.
Azevedo et al.17 suggested that the bromide ion,
normally present as a contaminant of NaCl, reacts with
O3 faster then Cl− generating brominated compounds.
However, in the conditions tested the bromide ion was
neither identiied in dye solutions (LOD < 2 µg L-1) nor in
the NaCl solid reagent (< 0.02%) used. Thus, the inluence of chloride on Acid Black 1 degradation should take place from different mechanism, neither related to the presence of bromide nor due to a salting effect.
Reaction between chloride ion and ozone
The possible mechanism explaining the Cl− suppression
effect could be a direct reaction between O3 and chloride.
Yeatts and Taube30 firstly indicated that chlorine can
be formed in ozone/chloride solutions in acid media as indicated in reaction A (Table 5). More recent works conirm the second order rate constant for this reaction as
well as the catalytic effect of the H+.31-33 Levanov et al.32,33
proposed the mechanism indicated by reactions B-D for this system. Siddiqui suggested that hypochlorite could react with ozone generating chloride and chlorite ions. In
addition, chlorite ion could also react with O3 and produces
chlorate ion by pathway shown in reactions E to G.34
Levanov et al.32,33 suggested that Cl
2 formation and its
release into a gas phase result from a rapidly established equilibrium. Unfortunately it is very dificult to identify chlorine gas in the presence of the ozone, especially at low reactants concentration used. On the other hand, a decrease in the chloride level in ozonized solutions, with a concomitant hypochlorite generation, could be an alternative form to conirm the proposed mechanism.
Our experimental results indicated a significant
decrease on Cl− concentration (−20%) for ozonized
hydrochloric acid solutions (2.8×10⁻⁴ mol L-1 in Cl−,
pH 1) without the presence of dye. As expected, this effect
was not observed in sodium chloride solution (2.8×10
-4 mol L-1 in Cl−, pH 6) probably due to low [H+]. In order
to verify the possible formation of the hypochlorous acid (HOCl), UV spectra of these solutions were recorded.
Table 4. Inluence of the chloride added (as NaCl) to the Acid Black 1
on ozonation
[dye]0 / (mol L-1)
Supplier purity
[Cl−]
added / (µmol L-1)
[Cl−]
total / (µmol L-1)
k / (min-1)
var. / (%)
t1/2 / (min)
1.8×10⁻⁵
Acros 61% (not puriied)
0 38a 0.26 0 2.7
141 179 0.25 −6 2.8
282 320 0.23 −11 3.0
563 601 0.22 −15 3.1
28,169 28,207 0.17 −35 4.1
2.4×10⁻⁵ Acros 86% (puriied)
0 22a 0.24 0 2.9
141 163 0.18 −26 4.0
282 304 0.17 −30 4.2
563 585 0.14 −42 5.1
2.4×10⁻⁵
Sigma 87% (not puriied)
0 11a 0.21 0 3.3
141 152 0.18 −14 3.8
282 293 0.17 −19 4.0
563 575 0.16 −23 4.3
a: chloride contaminations originally present in the reagents dye (see text).
Table 5. Main reactions involved on chloride ozonation mechanism
Number Reaction Kinetic ConstantsEquilibrium or
A O3 + 2 Cl− + 2 H+→ Cl
2 + H2O + O2 B O3 + Cl−→ ClO− + O
2 k = 1.5×10⁻³ L mol-1 s-1
C HOCl OCl− + H+ pKa = 7.5
D HOCl + H+ + Cl−↔ Cl
2(g) + H2O K = 2.2×10⁴
E ClO− + O
3→ 2 O2 + Cl− k = 110 L mol-1 s-1
F ClO− + O
3→ O2 + ClO2− k = 30 L mol-1 s-1
G ClO2− + O
For dilute HCl concentration (≤ 0.1 mol L-1) only the
peaks of ozone (254 nm) and chloride (ca. 200 nm) were
detected. However, on increasing HCl concentration up to
0.5 mol L-1, a new peak around 230 nm appears, while ozone
peak (254 nm) is no longer observed (Figure 6). This new
peak is close to the HOCl λmax (230 nm) one, as could be
observed in the spectrum obtained from a NaOCl acidic
solution (in 0.25 mol L-1 H
2SO4) also shown in Figure 6.
Similar behavior was observed by Vinals et al.35
studying the inluence of chloride ion on the ozone assisted leaching of gold and palladium from metallic scraps. These authors veriied the presence of a peak around 230 nm and attributed to the presence of HOCl, for chloride
concentration up to 0.5 mol L-1.
It is possible that hypochlorous acid formation could also take place in slight acid solutions (pH 4) and at low
O3 and chloride concentrations, such as the ones used
in this study. If true, the direct reaction between O3 and
chloride could compete with dye ozonation and explain,
at least in part, the observed Cl− suppression effect on Acid
Black 1 degradation. However, the global mechanism is probably more complex than that considered in this work. The presence of dye could directly inluence the chloride reaction with ozone and their by-products also could interact among them, generating different products. Thus, for a best elucidation of the involved mechanism and to a precise estimation of chloride suppression effect further tests must be performed using more sensitive analytical techniques, free of interference.
Conclusions
Experimental results show that ozonation of Acid Black 1 solutions is very eficient in the destruction of the dye chromophore structures. Ozonation treatment leads to a complete decolorization of the dye solution
(1.8×10⁻⁵ mol L-1) in few minutes (< 25 min). In addition,
Figure 6. Spectra UV-Vis of the aqueous solutions: 0.5 mol L-1 HCl
(ozonized and not ozonized) and HOCl (2×10⁻³ mol L-1 in 0.25 mol L-1 H2SO4) and ozone (1.2×10⁻⁴ mol L-1 in 0.25 mol L-1 H
2SO4).
the aromatic structures are also attacked but at slower rates. Pseudo irst-order rate kinetics were obtained, with an inverse relation between initial dye concentration and rate constant.
The ozonized unpurifed dye solutions showed the presence of short chains carboxylic acids (formic, oxalic and acetic) and inorganic anions (sulfate, nitrate and nitrite) as degradation by-products. The calculated conversions on molar ratios suggest that dye structure was not completely mineralized under used conditions.
The dye purity is a very important parameter not just to state the real dye concentration but also to indicate the presence of impurities which could be reactive towards
O3. The main identiied contaminant (chloride ion) affects
signiicantly the dye ozonation kinetics. Interference studies indicated that rate constants decrease up to
42% in the presence of 5.6×10⁻⁴ mol L-1 added chloride.
However, the presence of other impurities could also interfere in the dye degradation. The mechanism of the chloride suppression effect seems to involve a direct
reaction between O3 and Cl− generating HOCl, among
other by-products.
Acknowledgments
The authors thank FAPERGS and CNPq for inancial support.
References
1. Green, F. J.; The Sigma-Aldrich Handbook of Stains, Dyes and Indicators, Aldrich Chemical Co.: Milwaukee, Wisconsin, 1991. 2. Borrós, S.; Barbera, G.; Biada, J.; Agulló, N.; Dyes Pigm. 1999,
43, 189.
3. Carneiro, P. A.; Boralle, N.; Stradiotto, N. R.; Furlan, M.; Zanoni, M. V. B.; J. Braz. Chem. Soc. 2004, 15, 587.
4. Catanho, M.; Malpass, G. R. P.; Motheo, A. J.; Quim. Nova. 2006, 29, 983.
5. Almeida Filho, C.; Zarbin, J. G.; J. Braz. Chem. Soc. 2006, 17, 1151.
6. Martins, A. O.; Canalli, V. M.; Azevedo, C. M. N.; Pires, M.; Dyes Pigm. 2006, 68, 227.
7. Alaton, I. A.; Balcioglu, I. A.; Bahnemann, D. W.; Water Res.
2002, 36, 1143.
8. Sarayu, K.; Swaminathan, K.; Sandhya, S.; Dyes Pigm. 2007, 75, 362.
9. Soares, O. S. G. P.; Órfão, J. J. M.; Portela, D.; Vieira, A.; Pereira, M. F. R.; J. Harzard. Mater. B. 2006, 137, 1664.
10. Shu H. Y; Chang M. C.; Dyes Pigm. 2005, 65, 25.
12. Tosik R.; Wiktorowski, S.; Ozone Sci. Eng. 2001, 23, 295. 13. Shu H. Y.; Huang C. R.; Chemosphere 1995, 31, 3813.
14. Zhang, F. F.; Yediler, A.; Liang, X. M.; Kettrup, A.; Dyes Pigm. 2004, 60, 1.
15. Muthukumar, M.; Selvakumar, N.; Dyes Pigm. 2004, 62, 221. 16. Chu, W.; Lau, T. K.; J. Hazard. Mater. 2007,144, 249.
17. Azevedo, E. B.; Neto, F. R. D.; Dezotti, M.; J. Hazard. Mater.
2006, 128, 182.
18. Dong, Y.; Chen, J.; Li, C.; Zhu H.; Dyes Pigm. 2007, 73, 261. 19. Gahr, F.; Hermanutz F.; Oppermann W.; Water Sci. Technol.
1994, 30, 255.
20. Gunten U.; Water Res. 2003, 37, 1469.
21. Lyon, H. O.; Biotechnic Histochem. 2002, 77, 57. 22. Lankin, A. L.; Chem. Ind. 1970, 38, 1227.
23. Standard Methods for the Examination of Water and Wastewater - APHA, 20th ed.; American Public Health Association/
American Water Works Association/Water Environment Federation, Washington DC, 1998.
24. Langlais, B.; Reckhow, D. A.; Brink, D. R.; Ozone in Water Treatment Applications and Engineering, AWWARF and Lewis Publishers, Inc.: Denver, 1991.
25. Evans, A.; Potentiometry and Ion Selective Electrodes, J. Wiley:, London, 1991.
26. Shu, H. Y.; Chang, M. C.; Fan, H. J.; J. Hazard. Mater. 2004, 113, 201.
27. Wang, S.; Dyes Pigm. 2008, 76, 714.
28. Yip, A. C. K.; Lam, F. L. Y.; Hu, X.; Chem. Eng. Sci. 2007, 62,
5150.
29. Grzechulska, J.; Morawski, A. W.; Appl. Catal. B - Environ.
2002, 36, 45.
30. Yeatts, L. R. B.; Taube, H.; J. Am. Chem. Soc. 1949, 71, 4100.
31. Hoigne, J.; Bader, H.; Haag, W. R.; Staehelin, J.; Water Res.
1985, 19, 993.
32. Levanov, A. V.; Kuskov, I. V.; Zosimov, A. V.; Antipenko, E. E.; Lunin, V. V.; Kin. Catal. 2003, 44, 740.
33. Levanov, A. V.; Kuskov, I. V.; Koiaidarova, K. B.; Zosimov, A. V.; Antipenko, E. E.; Lunin, V. V.; Kin. Catal. 2005, 46, 147.
34. Siddiqui, M.; Water Res. 1996, 30, 2160.
35. Vinals, J.; Juan, E.; Ruiz ,M.; Ferrando, E.; Cruells, M.; Roca, A.; Casadao, J.; Hydrometal. 2006, 81, 142.
Received: July 17, 2009

![Table 4. Inluence of the chloride added (as NaCl) to the Acid Black 1 on ozonation [dye] 0 / (mol L -1 ) Supplier purity [Cl − ] added /(µmol L-1 ) [Cl − ] total /(µmol L-1 ) k /(min -1 ) var](https://thumb-eu.123doks.com/thumbv2/123dok_br/18994553.461780/7.892.66.413.154.453/table-inluence-chloride-added-black-ozonation-supplier-purity.webp)

