INTRODUCTION
Calcium stannate, CaSnO3, is a distorted orthorhombic perovskite with space group Pbnm, which belongs to the family of alkaline earth stannates. The degree of distortion of these perovskite may be described by tilting of the SnO6 octahedra [1]. CaSnO3 has been received increasing attention due to applications as capacitor component [2], gas sensor [3], anode materials for lithium ion batteries [4], catalyst [5], and photocatalyst [6]. Heterogeneous photocatalysis is an effective method for wastewater treatment, especially when organic pollutants are present in aqueous media [7-9]. In the photocatalytic process, a semiconductor is used as a light absorber to promote the breakage of pollutant molecules.
Photodegradation may occur by a direct mechanism, i.e., by oxidation or reduction of pollutant molecules on the photocatalyst surface due to photogenerated electrons (e-) or holes (h+), or by an indirect mechanism when •OH radicals are formed from reaction of pollutant species with H2O, OH
-or O2 adsorbed on the surface of the photocatalyst. These •OH radicals react with organic compounds to form CO2 and H2O [10].
A high activity in the degradation of organic pollutants has been reported for alkaline earth stannates as a consequence of their dielectric semiconductor properties [9, 11, 12]. Some of these works reported the use of alkaline earth stannates in water splitting [5, 13, 14], whereas others applied these materials for dye photodegradation,
CaSnO
3obtained by modiied Pechini method applied in the
photocatalytic degradation of an azo dye
(CaSnO
3obtido pelo método Pechini modiicado aplicado na degradação
fotocatalítica de um azo corante)
G. L. Lucena1, L. C. de Lima1, L. M. C. Honório1, A. L. M. de Oliveira1, R. L. Tranquilim 2, E. Longo3, A. G. de Souza1, A. da S. Maia1, I. M. G. dos Santos1*
1NPE, LACOM, Universidade Federal da Paraíba, João Pessoa, PB, Brazil 58059-900
2LIEC, CDMF, Universidade Federal de S. Carlos, S. Carlos, SP, Brazil 13565-905
3LIEC, CDMF, Instituto de Química, Universidade Estadual Paulista, Araraquara, SP, Brazil
Abstract
Pure forms of alkaline-earth stannates with perovskite structure (ASnO3, A= Ca
2+, Sr2+, Ba2+) have been used as photocatalysts. In
this work, CaSnO3 perovskite sample was synthesized by a modiied Pechini method at 800 ºC and characterized by X-ray diffraction (XRD), UV-visible spectroscopy, infrared spectroscopy and Raman spectroscopy. The photocatalytic degradation of remazol golden yellow (RNL) dye under UV radiation was evaluated. The XRD pattern showed that the synthesis method favored the orthorhombic CaSnO3 crystallization. According to the Raman spectrum, a material with high short-range order was obtained despite of the
relatively low synthesis temperature, compared to the solid-state reaction one. The highest photocatalytic activity was attained at pH 3, which presented 51% discoloration and improved activity of 35% compared to discoloration solely due to adsorption (absence of radiation). The point of zero charge (PZC) and the photocatalytic results indicated that a direct mechanism prevailed at pH 3, whereas an indirect mechanism prevailed at pH 6.
Keywords: CaSnO3, photocatalysis, dye degradation.
Resumo
Estanatos de metais alcalinos terrosos na forma pura com estrutura perovskita (MSnO3, M= Ca2+, Sr2+, Ba2+) têm sido utilizados como fotocalisadores. Neste trabalho, perovskita de CaSnO3 foi sintetizada pelo método Pechini modiicado, em 800 ºC, e caracterizada por difração de raios X, espectroscopia de UV-vis, espectroscopia de infravermelho e espectroscopia Raman. Avaliou-se a degradação fotocatalítica do corante remazol amarelo ouro (RNL) sob luz ultravioleta. O difratograma de raios X mostrou que o método de síntese utilizado favoreceu a formação do CaSnO3 ortorrômbico. O espectro Raman indicou que um material com elevada ordem a curto alcance foi obtido apesar da temperatura de síntese relativamente baixa, em comparação ao método do estado sólido. A maior atividade fotocatalítica foi alcançada em pH 3, que apresentou descoloração de 51% e aumento de atividade de 35% em relação à adsorção (ausência de radiação). O ponto de carga zero (PZC) e os resultados fotocatalíticos indicaram que em pH 3 existiu uma predominância de um mecanismo direto, enquanto em pH 6 prevaleceu o mecanismo indireto.
especially using BaSnO3 or SrSnO3 [9, 12]. For instance, Sales et al. [15] synthesized Sr1-xBaxSnO3 powders and observed that the photodegradation of remazol golden yellow is strongly inluenced by the composition of the photocatalyst. In a recent study, Moshtaghi et al. [16] investigated the photodegradation of acid blue 92 and acid black 1 using SrSnO3 as the photocatalyst and obtained discoloration percentages larger than 93%. Wang et al. [17] evaluated the use CaSnO3 with microcube morphology for the photodegradation of rhodamine B, methyl orange and 4-hydroxyazobenzene dyes and observed high photocatalytic eficiency. According to authors, a network of corner-shared octahedra can improve the charge carrier mobility, which indicates that CaSnO3 may be an interesting photocatalyst. However, there are few reports on its photocatalytic properties. Several studies have reported the synthesis of perovskite-type stannates by the conventional solid-state reaction [18-20]. However, this method requires high temperatures and a long reaction time. Thus, this study aimed to synthesize CaSnO3 by the modiied Pechini method and evaluate the azo dye photodegradation under different conditions.
EXPERIMENTAL
Synthesis of the CaSnO3: CaSnO3 powder was synthesized by a modiied Pechini method, as described in previous work on SrSnO3 [21]. In this work, metallic Sn (99%, Vetec), Ca(NO3)2.4H2O (99%, Vetec), citric acid (C6H8O7.2H2O, 99.5%, Cargil), ethylene glycol (C2H6O2, 99.5%, Vetec), and NH4OH (99%, Vetec) were used as raw materials during synthesis. For the synthesis of CaSnO3, Sn(s) was added to 100 mL of 0.1 M HNO3 solution in an ice bath with magnetic stirring, until complete dissolution of the metal was achieved (about 3 h). Ca(NO3)2.4H2O (Ca:Sn molar ratio of 1:1) was then added. Citric acid was added into the system with molar ratio 3:1 (citric acid:metal) under stirring at 70 °C for 20 min. The solution was adjusted to pH 3 by adding NH4OH. Ethylene glycol was added to the solution, using a citric acid:ethylene glycol mass ratio of 60:40. The temperature was raised to 90-110 °C, to favor the polymerization process, until the volume was reduced to 1/3 of its initial value. This resin was heat treated in an oven at 300 °C for 90 min, leading to the formation of the powder precursor. The material was deagglomerated, ground in a Spex-type mill (800 M) for 15 min and sieved through a 100 mesh (149 μm) sieve. The polymeric precursor was calcined at 300 °C for 600 min with heating rate of 1 °C.min-1 in an oxidizing atmosphere (O
2), to partially eliminate carbon. It was then subjected to calcination at 800 °C for 240 min in air at heating rate of 10 °C.min-1 to crystallize the desired perovskite phase.
Characterization: the structure of the CaSnO3 sample was evaluated by X-ray diffraction (XRD) using a diffractometer (XRD-6000, Shimadzu) operating at 40 kV and 40 mA with CuKα radiation. The q-2q XRD patterns
were collected in the range of 15-80°, using a step size of 0.02° and step time of 2 s. The lattice parameters and unit
cell volume were calculated using the Rede93 program. visible spectroscopy analysis was carried out using a UV-vis spectrophotometer (UV-2550, Shimadzu) scanned in the range between 190-900 nm in diffuse relectance mode. The band gap values (Eg) of the samples were calculated using a method described in [22, 23]. Infrared spectroscopy analysis was performed in an IRPrestige-21 Shimadzu spectrophotometer, in the mid infrared range (mid-IR), from 2000 to 400 cm-1, using KBr pellets, and in the far infrared range (far-IR) using Nujol oil. Raman spectrum was collected using a Horiba Jobin-Yvon spectrophotometer (IHR-550) operating with an Ar laser (514 nm) and power of 20 mW. The point of zero charge (PZC) of the material was determined by the salt addition method [24]. First, 0.05 g of the sample were added to 50 mL of 0.01 M sodium chloride (NaCl) solution. The pH of the suspension was adjusted to pH 2-12 by adding standard hydrochloric acid or sodium hydroxide solutions. The mixture was then kept in a shaker for 24 h at room temperature. The inal pH value of each suspension was recorded after 24 h of equilibration by using a pHmeter (Dubnoff Marconi). The PZC of the sample was calculated by plotting ΔpH (inal pH - initial pH) versus pHi.
Photocatalytic and adsorption tests: the CaSnO3 sample was used as photocatalyst for the degradation of remazol golden yellow dye (RNL). The photocatalytic tests were performed in a homemade reactor with dimensions of 10 cm x 10 cm x 100 cm using UVC lamps (λ=254 nm). The experiments were carried out in triplicate using 10 mg of the photocatalyst and 15 mL of the dye solution with a concentration of 10 mg.L-1 at pH= 3 and 6. The solution pH was kept constant by the use of a CH3COOH/CH3COONa solution (2 mol.L-1) as buffer. Petri dishes containing the dye solution and the photocatalysts were photoirradiated for 5 h. After photocatalysis, the mixtures were centrifuged and iltered. The percentage of discoloration and degradation of the dye solutions were quantiied using a UV-vis spectrophotometer (UV-2550, Shimadzu) in absorbance mode by measuring the absorbance of the solution at 410 and 240 nm, respectively [25]. The photocatalytic eficiencies of the photocatalysts were calculated by calibration curves; the initial absorption of the untreated dye solution and the respective concentrations before and after photocatalytic treatment were considered. In addition, tests at pH= 3 and 6 were performed in the dark, using the same conditions of the photocatalytic tests, to evaluate the discoloration solely due to the adsorption of the dye on the surface of the material.
RESULTS AND DISCUSSION
Characterization of the material
76-0606, the peak at 27º indicated the presence of CaCO3 as a secondary phase. The presence of CaCO3 in CaSnO3 and Ca1-xSrxSnO3 samples was also conirmed in [26, 27].
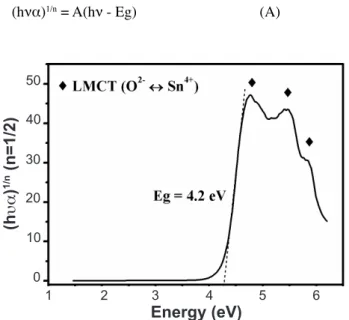
Fig. 2 shows the UV-vis spectrum and the band gap value of the CaSnO3 sample. The region of highest energy absorption was observed between 4.5-6.0 eV. According to literature, bands at this region are assigned to the ligand metal charge transfer (LMCT) O2-n Sn4+for ions in an octahedral
sites [28]. In the present work, LMCT bands were identiied at 4.7, 5.4 and 5.8 eV. The Eg value obtained for the CaSnO3 sample was estimated to be 4.2 eV, according to Equation A [22, 23]. This result is similar to the experimental value (4.40 eV) reported in [29], and slightly smaller than the theoretical band gap value of 4.87 eV reported in [30].
(hνα)1/n = A(hν - Eg) (A)
where: h – Planck’s constant, ν - frequency, α - absorption coeficient, Eg - band gap energy, A - constant. The value of the exponent n denotes the nature of the sample transition. In the present work, n=1/2 was used, which corresponds to a direct transition.
The IR spectrum of the CaSnO3 is shown in Fig. 3. The
bands located at 870, 1051, and 1454 cm-1 were assigned to carbonate vibrations [31], and the band at 1643 cm-1 was associated with water angular deformation. The vibrations assigned to stannates (SnO3
2-) generally produce
high-intensity bands in the infrared region at 300-400 cm-1 and
600-700 cm-1 with a band broadening typical of orthorhombic perovskite structures [27, 32]. The mid-IR spectrum of CaSnO3 showed a band at 641 cm
-1 assigned to the stretching mode of Sn-O [33, 34]. For the spectrum obtained in the far-IR range (inset of Fig. 3), the bands at 362 and 390 cm-1 corresponded to the bending mode of O-Sn-O [34], while modes at 459 and 503 cm-1 were assigned to SnO
6 vibrations [32], and bands at 559 and 642 cm-1 referred to the stretching modes of Sn-O bonds [32, 34].
The Raman spectrum of the CaSnO3 sample is displayed in Fig. 4. The bands located at 161, 181, 276 and 354 cm-1 were assigned to Ca-SnO3 and O-Sn-O vibrations [30]. The bands at 441, 583 and 701 cm-1 were related to the torsional and stretching modes of SnO3 and Sn-O, respectively [30, 32, 35]. The modes at 1079 and 1092 cm-1 were assigned to calcium carbonate vibrations [36]. Maul et al. [37] performed a harmonic analysis of CaSnO3 and presented the phonon density of states (PDOS) to correlate the contribution of Ca2+, Sn4+ and O2- movements (apical and equatorial) with the dislocation frequency (ν). According to the authors, the bands between 100 and 300 cm-1 have higher contribution of Ca2+ and Sn4+ atoms and small contribution of apical O2-; for frequencies higher than 300 cm-1, the highest contribution is from oxygen ions.
Figure 1: X-ray diffraction pattern of the CaSnO3 sample calcined at 800 °C.
[Figura 1: Difratograma de raios X da amostra de CaSnO3 calcinada em 800 ºC.]
20 30 40 50 60 70 80 2q (degree)
Intensity
Figure 2: UV-vis spectrum of the CaSnO3 sample calcined at 800 °C. [Figura 2: Espectro de UV-vis da amostra de CaSnO3 calcinada a 800 ºC.]
1 2 3 4 5 6
50
40
30
20
10
0
Energy (eV)
(h
ua
)
1/n
(n=1/2)
Figure 3: Mid-IR spectrum of CaSnO3 sample calcined at 800 °C obtained in KBr (inset: far-IR spectrum of the same sample). [Figura 3: Espectro no infravermelho médio da amostra de CaSnO3, calcinada a 800 ºC, obtido em KBr (inserto: espectro no infravermelho distante, da mesma amostra).]
2000 1750 1500 1250 1000 750 500 Wavenumber (cm-1)
T
The inluence of the pH on the surface properties was evaluated by calculating the point of zero charge (PZC) of the perovskite, as presented in Fig. 5. In aqueous media, the surface of the oxides is hydroxylated. Surface dissociation occurs because most metal oxides are amphoteric, as shown by Equations B and C [38-40].
MOH(s) + H+
(aq) D MOH2
+
(s) (B)
MOH(s) + OH
-(aq) D MO-(s) + H2O(l) (C)
Therefore, when pH<pHPZC, the material surface becomes positively charged, which favors the adsorption of anions. When pH>pHPZC, the material surface becomes negatively charged, which favors the adsorption of cations [41]. The result presented in Fig. 5 showed that CaSnO3 has pHPZC=7.26.
Photocatalytic eficiency
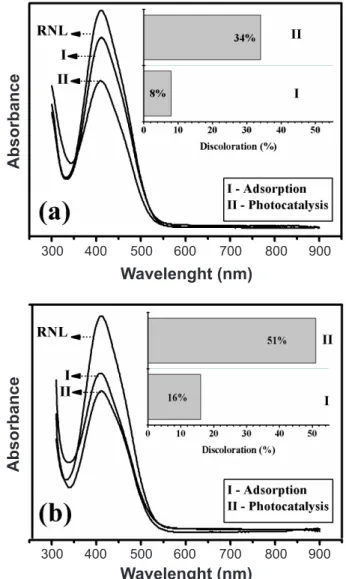
The UV-vis spectra and the discoloration percentages of the dye solution after adsorption and photocatalytic tests at pH 6 and 3 are presented in Fig. 6a and 6b, respectively. For the adsorption tests, as measurements were done in the dark, the decrease in the intensity of the band at 411 nm was solely attributed to the reduction of the dye amount in the solution due to its adsorption on the material surface. For the solutions at pH 6, a very small adsorption occurred (8%), while the adsorption at pH 3 was much larger (16%). This behavior may be understood by considering the Coulombic attraction and repulsion forces between the azo dye and the perovskite. According to the evaluation of the PZC, a positive surface charge density is obtained at pH 3, while a slightly positive charge density is attained at pH 6. On the other hand, according to literature data the RNL azo dye has three pKa
Figure 6: UV-vis spectra of RNL azo-dye, after adsorption and after photocatalytic test at pH 6 (a) and pH 3 (b), in the presence of
CaSnO3.
[Figura 6: Espectros de UV-vis do azo corante RNL, após os testes de adsorção e fotocatálise em pH 6 (a) e pH 3 (b), na presença de CaSnO3.]
300
Wavelenght (nm)
Absorbance
500 700
400 600 800 900
300
Wavelenght (nm)
Absorbance
500 700
400 600 800 900
Figure 5: ∆pH vs pHi of the CaSnO3 sample calcined at 800 °C. [Figura 5: ∆pH vs pHi da amostra de CaSnO3 calcinada a 800 ºC.]
2 2.0
1.0
0.0 1.5
0.5
-0.5
-1.5
-2.5 -1.0
-1.0
pHi
D
pH
6 10
4 8 12
3 5 7 9 11
Figure 4: Raman spectrum of the CaSnO3 sample calcined at 800 °C. [Figura 4: Espectro Raman da amostra de CaSnO3 calcinada em 800 ºC.]
150 300 450 600 750 900 1050 Raman shift (cm-1)
values: 3, 3.5 and 6 - the sulphonic group is deprotonated at pH 3, the sulphate group is deprotonated at pH 3.5 and the amido group is deprotonated at pH 6, which results in a large negative charge, as displayed in Fig. 7 [42, 43]. Therefore, an attractive force between the positive surface charge of the perovskite and the negative charge of the azo dye occurs at pH 3 favoring the dye adsorption and the highest solution discoloration. At pH 6, few molecules are adsorbed on the CaSnO3 surface due to the slight positive surface charge, leading to a small discoloration of the solution. These results are in agreement with literature data [38, 40].
UV irradiation had an important inluence on the amount of discoloration, which indicated that a photocatalytic reaction had occurred. XRD pattern (Fig. 1) and Raman spectrum (Fig. 4) obtained in the present work conirmed the formation of CaSnO3 with orthorhombic structure, which consists of tilted and distorted SnO6 octahedra [30]. According to [44], structures consisting of p-block metal oxides containing alkaline earth metals with large distortion of octahedral and tetrahedral units have interesting properties as photocatalysts, due to local internal ields caused by dipole moments in the distorted octahedra, which avoid
electron-hole recombination upon photoexcitation. This behavior was conirmed in [45] for alkaline earth stannates. Another important characteristic observed in the present work was the high short- and long-range order, indicated by the well deined peaks in the XRD pattern (Fig. 1) and in the Raman spectrum (Fig. 4). Moreover, UV-vis spectrum (Fig. 2) displayed an intense absorption band with a steep edge, without Urbach tail. According to [17], this behavior indicates that a band-band transition takes place instead of transitions from impurity levels. This behavior, associated with the CaSnO3 large band gap, may decrease the possibility of electron-hole recombination reactions.
An interpretation of the inluence of pH on photocatalytic degradation must be performed considering the semiconductor surface charge, substrate nature and •OH production, which also changes at different pH values [40, 41, 46, 47]. According to literature data, two different photocatalysis mechanisms may occur for basic and acidic solutions. At low pH, some organic substances are adsorbed on the material surface and oxidized by holes, as formation of hydroxyl radicals due to H2O or OH
- oxidation by holes may
be thermodynamically unfavorable. For neutral and alkaline solutions, •OH is formed more easily due to the presence of OH- on the material surface, which is readily oxidized by holes [38, 47, 48]. In the present case, the photodegradation of the RNL azo dye was smaller at pH 6 (Fig. 6a). In spite of this, a comparison with the results of the adsorption test indicated that a noticeable improvement in the activity occurred after UV irradiation, with a discoloration increase of 320%. As dye adsorption onto this perovskite was not favored at pH 6, it is believed that an indirect mechanism for the photocatalytic reaction prevailed, with the formation of hydroxyl radicals due to reaction of electrons with O2, and/or holes with OH- and/or H
2O. For the solution at pH 3 (Fig. 6b), a comparison with the results of the adsorption test also showed that UV irradiation increased the photocatalytic activity for all of the materials, but the activity was increased by a smaller amount than that of the solutions at pH 6 (219%). This result indicated that a direct mechanism had also an important effect on photodegradation, due to oxidation of adsorbed azo dye molecules by holes in the valence band or cleavage of the azo bonds by electrons in the conduction band [38, 47]. A similar effect was observed in [38], which evaluated the photodegradation of an azo dye by TiO2 and concluded that dye adsorption onto TiO2 at low pH favors the photocatalytic reaction.
CONCLUSIONS
CaSnO3 perovskite was successfully obtained by the modiied Pechini method, leading to a material with high short and long-range order. This high crystallinity, the large band gap value associated with distorted octahedra characteristic of the CaSnO3 orthorhombic structure enhanced the photocatalytic activity. UV radiation favored the discoloration of the solution, but the results were relatively different when the photocatalytic tests were conducted Figure 7: Deprotonation scheme of the acidiied RNL molecule at
pka1=3, pka2=3.5 and pka3=6.
under different conditions. At pH 3, a higher electrostatic attraction between the positive surface and negatively charged dye molecule favored the direct mechanism of photocatalysis, as indicated by the adsorption results. At pH 6, the smallest positive surface charge leaded to a smaller adsorption of the dye molecules. At this condition, photocatalysis seemingly occurred by an indirect mechanism.
ACKNOWLEDGEMENTS
The authors acknowledge the inancial support by the INCT/CNPq/MCTI and CT-INFRA/FINEP/MCTI.
REFERENCES
[1] Z. Dohnalová, P. Sulcová, M. Trojan, J. Therm. Anal. Calorim. 93 (2008) 857.
[2] A.M. Azad, L.L.W. Shyan, M.A. Alim, J. Mater. Sci. 34
(1999) 1175.
[3] H. Cheng, Z. Lu, Solid State Sci. 10, 8 (2008) 1042.
[4] X. Hu, T. Xiao, W. Huang, W. Tao, B. Heng, X. Chen, Y. Tang, Appl. Surf. Sci. 258, 17 (2012) 6177.
[5] W.F. Zhang, J. Tang, J. Ye, J. Mater. Res. 22 (2007) 1859.
[6] F. Zhong, H. Zhuang, Q. Gu, J. Long, RSC Adv. 6 (2016)
42474.
[7] A. Jia, Z. Su, L. Lou, S. Liu, Solid State Sci. 12 (2010) 1140.
[8] M. Ghaffari, H. Huang, P.Y. Tan, O.K. Tan, Powder Technol.
225 (2012) 221.
[9] P. Junploy, S. Thongtem, T. Thongtem, Superlattice Microst.
57 (2013) 1.
[10] A. Ajmal, I. Majeed, R.N. Malik, H. Idrissc, M.A. Nadeem, RSC Adv. 4 (2014) 37003.
[11] T.M. Lobo, R. Lebullenger, V. Bouquet, M. Guilloux-Viry, I.M.G. Santos, I.T. Weber, J. Alloy Compd. 649 (2015) 491.
[12] S. Moshtaghi, S. Zinatloo-Ajabshir, M. Salavati-Niasari, J. Mater. Sci.-Mater. Electron. 27 (2016) 425.
[13] W.F. Zhang, J. Tang, J. Ye, Chem. Phys. Lett. 418 (2006) 174.
[14] D. Chen, J. Ye, Chem. Mater. 19 (2007) 4585.
[15] H.B. Sales, V. Bouquet, S. Députier, S. Ollivier, F. Gouttefangeas, M. Guilloux-Viry, V. Dorcet, I.T. Weber, A.G. Souza, I.M.G. Santos, Solid State Sci. 28 (2014) 67.
[16] S. Moshtaghi, S. Gholamrezaei, M.S. Niasari, P. Mehdizadeh, J. Mater. Sci.-Mater. Electron. 27 (2016) 414.
[17] W. Wang, J. Bi, L. Wu, Z. Li, X. Fu, Scripta Mater. 60
(2009) 186.
[18] V. Berbenni, C. Milanese, G. Bruni, A. Girella, A. Marini, Thermochim. Acta. 608 (2015) 59.
[19] T. Wang, Y. Hu, L. Chen, X. Wang, G. Ju, Radiat. Meas.
73 (2015) 7.
[20] B. Hadjarad, M. Trati, M. Kebir, Mat. Sci. Semicon. Proc.
29 (2015) 283.
[21] G.L. Lucena, J.J.N. Souza, A.S. Maia, L.E.B. Soledade, E. Longo, A.G. Souza, I.M.G. Santos, Cerâmica 59 (2013) 249.
[22] D.L. Wood, J. Tauc, Phys. Rev. B. 5 (1972) 3144.
[23] E.A. Davis, N.F. Mott, Philos. Mag. 22 (1970) 903.
[24] T. Mahmood, M.T. Saddique, A. Naeem, P. Westerhoff, S. Mustafa, A. Alum, Ind. Eng. Chem. Res. 50 (2011) 10017.
[25] M. Muruganandham, M. Swaminathan, Dyes Pigm. 68
(2006) 133.
[26] M.C.F. Alves, S.C. Souza, S.J.G. Lima, E. Longo, A.G. Souza, I.M.G. Santos, J. Therm. Anal. Calorim. 87 (2007) 763.
[27] M.C.F. Alves, S.C. Souza, H.H.S. Lima, M.R. Nascimento, M.R.S. Silva, J.W.M. Espinosa, S.J.G. Lima, E. Longo, P.S. Pizani, L.E.B. Soledade, A.G. Souza, I.M.G. Santos, J. Alloys Compd. 476 (2009) 507.
[28] Z.C. Liu, H.R. Chen, W.M. Huang, J.L. Gu, W.B. Bu, Z.L. Hua, J.L. Shi, Microporous Mesoporous Mater. 89 (2006) 270.
[29] H. Mizoguchi, H.W. Eng, P.M. Woodward, Inorg. Chem.
43 (2004) 1667.
[30] J. Maul, A. Erba, I.M.G. Santos, J.R. Sambrano, R. Dovesi, J. Chem. Phys. 142 (2015) 014505.
[31] K. Nakamoto, Infrared and Raman spectra of inorganic and coordination compounds, John Wiley & Sons, New York (1996).
[32] H.L. Zheng, Z.C. Zhang, J.G. Zhou, S.S. Yang, J. Zhao, Appl. Phys. A-Mater. 108 (2012) 465.
[33] C.H. Perry, B.N. Khanna, G. Rupprecht, Phys. Rev. 135, 2A (1964) 408.
[34] E. Moreira, C.A. Barboza, E.L. Albuquerque, U.L. Fulco, J.M. Henriques, A.I. Araújo, J. Phys. Chem. Solids. 77 (2015) 85.
[35] M. Tarrida, H. Larguem, M. Madon, Phys. Chem. Miner.
36 (2009) 403.
[36] C.G. Kontoyannis, N.V. Vagenas, Analyst 125 (2000) 251.
[37] J. Maul, I.M.G. Santos, J.R. Sambrano, A. Erba, Theor. Chem. Acc. 135 (2016) 36.
[38] I.K. Konstantinou, T.A. Albanis, Appl. Catal. B-Environ.
49 (2004) 1.
[39] T. Mahmood, M.T. Saddiquet, A. Naeem, P. Westerhoff, S. Mustafa, A. Alum, Ind. Eng. Chem. Res. 50 (2011) 10017. [40] U.G. Akpan, B.H. Hameed, J. Hazard. Mater. 170 (2009) 520.
[41] H. Zhu, R. Jiang, Y. Fu, Y. Guan, J. Yao, L. Xiao, G. Zeng, Desalination 286 (2012) 41.
[42] T.P.F. Teixeira, S.I. Pereira, S.F. Aquino, A. Dias, Eng. Sci.
29, 7 (2012) 685.
[43] T.P.F. Teixeira, “Avaliação da eiciência do uso de hidro
-talcitas calcinadas na remoção de azo corantes aniônicos pre
-sentes em eluentes de indústria têxtil”, Diss. Mestr., Univ. Fed. Ouro Preto, Ouro Preto (2011).
[44] J. Sato, H. Kobayashi, Y. Inoue, J. Phys. Chem. B 107 (2003) 7970.
[45] W. Wang, S. Liang, K. Ding, J. Bi, J.C. Yu, P.K. Wong, L. Wu, J. Mater. Sci. 49 (2014) 1893.
[46] J. Nishio, M. Tokumura, H.T. Znad, Y. Kawase, J. Hazard. Mater. 138 (2006) 106.
[47] W.Z. Tang, C.P. Huang, Water Res. 29 (1995) 745.
[48] M. Muruganandham, M. Swaminathan, Dyes Pigm. 68
(2006) 133.