Wilton de Oliveira Bussab Grupo de Estudos em
População, Sexualidade e Aids*
Departamento de Informática e Métodos Quantitativos. Escola de Administração de Empresas de São Paulo. Fundação Getulio Vargas. São Paulo, SP, Brasil
* (Study Group on Population, Sexuality and AIDS) members: Elza Berquó, Francisco Inácio Pinkusfeld Bastos, Ivan França Junior, Regina Barbosa, Sandra Garcia, Vera Paiva, Wilton Bussab.
Correspondence:
Wilton de Oliveira Bussab DIMQ-EAESP-FGV Av. Nove de Julho 2029 01313-902 São Paulo, SP, Brasil E-mail: [email protected] Received: 7/31/2007 Reviewed: 2/25/2008 Approved: 3/20/2008
Sampling plan for the National
Survey Sexual Behavior and
Perceptions of the Brazilian
Population concerning HIV/
AIDS, 2005
ABSTRACT
OBJECTIVE: To describe the sampling plan and estimation methods used to collect and analyze data in the survey Sexual Behavior and Perceptions of the Brazilian Population concerning HIV/Aids in 2005.
METHODS: The study presents the decisions that were made concerning population defi nition, strata of interest to the survey and to the sampling plan,
main procedures for data analysis and sample performance in the fi eld.
SAMPLING RESULTS: A probabilistic plan was designed with 5,040 sampling units obtained from the Brazilian population, with individuals aged between 16 and 65 years living in large Brazilian urban centers. It is a complex sampling plan distributed over eight main estimation domains, designed in multiple stages. A man or a woman was interviewed in the last stage. Each interviewed unit and
each household have specifi c probability of belonging to the sample.
DESCRIPTORS: Sampling studies. Estimation Techniques. Data Interpretation, Statistical. Data Collection. Questionnaires. Population Studies in Public Health. Brazil. Cross-sectional studies.
INTRODUCTION
Nationwide surveys in the area of sexual behaviors, risks and protection against HIV/AIDS and other sexually transmitted infections (STIs) are necessary in any society that wishes to formulate and evaluate public policies in this fi eld based on consistent empirical data.1 Likewise, it is important to investigate some of
the interfaces between the STIs and consumption of psychoactive substances or the broader fi eld of sexual and reproductive health – for example, decisions concerning the use of contraceptive methods.
With few exceptions, surveys conducted in Brazil and in the majority of low- and middle-income countries are characterized by local or regional coverage. However, national surveys are indispensable, especially in a country with continental dimensions like Brazil, marked by heterogeneities and social, eco-nomic and cultural contrasts. A reliable portrait of this society and its dynamic phenomena – like changes in the sphere of sexual behaviors or the HIV/AIDS epidemic – requires the systematic conduction of national enquiries supported by consistent sampling plans.
The objective of the present paper was to describe methodological aspects
concerning the defi nition of the survey domain and the sampling plan designed
METHODS
Defi nition of the survey domain
The 2005 “Comportamento sexual e percepções da
população brasileira sobre HIV/Aids” Survey (Sexual Behavior and HIV/AIDS Perceptions of the Brazilian Population) encompasses all the Brazilian states, while its previous version, carried out in 1998, included 24 Brazilian states and the Federal District, excluding the
states of Tocantins and Roraima.a
The data of the 2005 survey were obtained by means of a multistage probabilistic sample totaling 5,040 re-spondents, aged 16 to 65 years, living in the large urban regions of Brazil. Therefore, the sample studied in the 2005 survey was larger than that of the 1998 survey, which was composed of 3,600 individuals.
The Ministry of Health has established four geographic strata of interest, corresponding to groups of Brazilian states, namely: states of the North and Northeast re-gions; states of the Central-West and Southeast regions excluding São Paulo; states of the South region; and, fi -nally, the state of São Paulo as an additional domain.
Target population
The reference system adopted to defi ne the population
of interest to the survey was the Demographic Census
of the year 2000, conducted by the Instituto Brasileiro
de Geografi a e Estatística (IBGE – Brazilian Institute for Geography and Statistics).
The survey used as unit of analysis one of the data aggregation units utilized by IBGE, the information reference system, grouped into 558 microregions.
Be-sides the information that identifi es the microregions
(name and state), the following variables were used: total population, urban population and population aged 16 to 64 years, the latter as an approximation to the population of interest, whose upper limit is 65 years of age.
The microregions cover large territorial areas, which might hinder the access to some units and, consequent-ly, increase survey costs. To minimize this problem,
operational decisions were made. The fi rst one was to
restrict the survey to dwellers of the urban areas of the microregions.
The second decision was to include only large urban conglomerates, defined as microregions which, in 2000, had more than 100,000 inhabitants living in their urban areas. This measure reduced the number of microregions to 276, corresponding to a 12% reduction in the number of dwellers of interest to the survey, as
a Centro Brasileiro de Análise e Planejamento. Comportamento sexual da população brasileira e percepções do HIV/AIDS. Brasília: Ministério da Saúde. Brasília; 2000. [Série Avaliação, 4].
showed by Table 1. Finally, like in the 1998 survey, 17 microregions in the North Region that did not include the respective state capitals were eliminated, due to ac-cess problems. At the end, 259 microregions constituted the domain of interest of the 2005 survey.
Thus, the survey’s target population was defi ned by the inclusion of all dwellers aged 16 to 65 years, living in urban areas of the microregions which, in 2000, had more than 100,000 inhabitants in their urban zone, except for microregions of the North Region that did not include the capitals of the respective states.
This number of dwellers represented, in 2000, 88% of the Brazilian population in the age group living in urban areas of the country, which corresponded to approxi-mately 80 million people. Table 1 shows the effects of the operational measures upon population totals, and also on the strata of interest. As expected, the largest loss occurred in the North/Northeast stratum, with 76% of coverage, while in São Paulo this rate was 98%.
Sampling plan
The selected sampling plan is stratifi ed in multiple
stages, with unequal probabilities of inclusion of the events under analysis.
The four geographic strata established by the Ministry of Health were adopted: states of the North and North-east regions; of the Central-West and SouthNorth-east regions, excluding São Paulo; of the South region; and of the state of São Paulo.
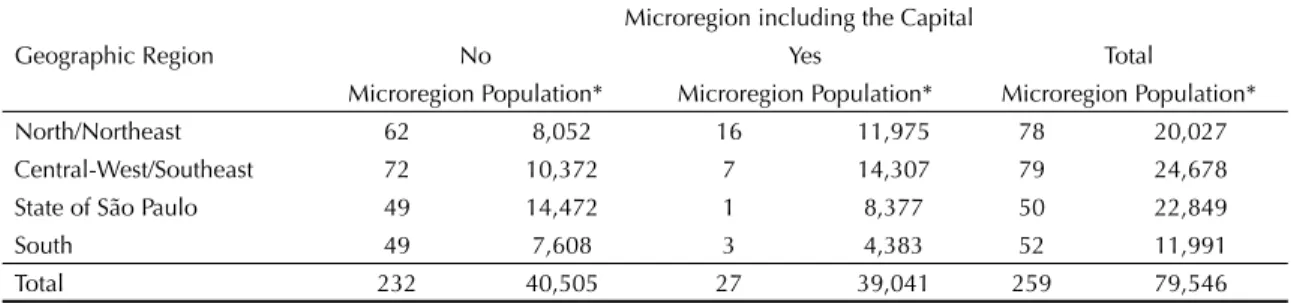
Besides producing reliable estimates for these four strata, the study attempted to produce good estimates concerning the behavior of the population of the Bra-zilian capitals. To achieve this, in the scope of each stratum, the microregions that contained the capitals were separated from the other microregions. Thus, the 259 microregions were distributed over the eight domains, as presented by Table 2.
However, in the sampling plan design, it was decided that all the microregions containing capitals should be represented in the sample. From the sampling point of view, this means that each one of this microregion was considered a stratum. Therefore, the survey popula-tion was divided into eight domains of interest to the analysis and 31 strata to the sampling plan design: four containing the inland microregions per geographic re-gion and 27 for each microrere-gion containing the capital of the respective state.
• due to the available budget and in view of the ob-jectives, it was established that the viable size of the sample would be 5,040 individuals;
• aiming to obtain the same precision in each stratum,
the size of the sample was fi xed at 1,260 households per stratum, an alternative that is more adequate for sub-populations with the same variability;
• estimates’ precision was based on the supposition of
a simple randomized sampling design, which would produce proportion estimates with sampling error of approximately 3% in each geographic stratum, and power to detect signifi cant differences between strata of around 4 percentage points.1
• assuming that the similarity between answers of
dwellers from the same census tract (intraclass correlation1-3) increases the sampling error,6 and
that investigations into the population’s social and economic characteristics have suggested that the optimum number per census tract should not surpass 15 households, the reference number for drawing
within each tract was fi xed at nine households.
This corresponded to the draw of 140 tracts per geographic stratum;
• each microregion containing the state capital
con-stituted a special substratum within the respective domain of interest. Thus, the study had 27 pre-se-lected microregions.
The selected sampling plan is stratified into four stages for the strata that do not include capitals, being reduced to three in those with the microregions of the capitals, due to the elimination of the draw of the microregion. The sampling units in each stage were defi ned as follows:
• primary sampling unit (PSU) – the microregion was
used;
• secondary sampling unit (SSU) – refers to the draw
in the second stage and corresponds to the urban census tract. For this purpose, the census tracts
defi ned by IBGE for the 2000 Demographic Census
were used;
• tertiary sampling unit (TSU) – corresponds to the
private household;
• quaternary sampling unit (QSU) – individual
be-tween 16 and 65 years old.
In sum, the initial sample of 5,040 units was equally divided into 1,260 units per geographic stratum, in order to obtain the same statistical precision for the estimates in each one of the four regional strata. The draw of nine households in each census tract, to control for conglomeration effects, implied the distribution of 560 census tracts over the four large geographic strata,
allocating 140 tracts per stratum. In consonance with the above-mentioned reasons and in order to obtain estimators with equal precision in the eight domains of interest, 70 census tracts should be used in each one of them. However, the particularity related to the composi-tion of the number of capitals existing in the different geographic domains determined some adaptations.
As the São Paulo-Capital stratum has only one mi-croregion and the South-Capital one has three, it was decided that 49 census tracts would be allocated to each of these strata. This measure, together with the draw of nine households in all the tracts, would guarantee 441 households in the scope of these strata, an adequate number to produce estimates with an acceptable reli-ability level. The difference of 91 tracts of this amount to 140 was attributed to the stratum that does not include the microregion of the capital. To each microregion of the sample, in the subsequent stage, seven census tracts were drawn.
To the North/Northeast Capital region, with 16 mi-croregions and a slightly larger population, it was decided that 77 census tracts would be assigned and the remaining 63 would be destined to the microregions that do not contain capitals. The combination of these decisions can be seen in Table 3, which describes the
fi nal allocation of the number of microregions, census
tracts and households assigned by the sample.
For the sample draw in each stratum of the micro-regions that did not include the capital, both the microregions and the census tracts were drawn with probabilities that were proportional to the respective sizes. For the microregions, the number of inhabit-ants and for the census tracts, the number of occupied households, both according to the data of the 2000 Demographic Census, were adopted as measures of their respective sizes. Households and dwellers were drawn with equal probability.
For the selected household, one person aged between 16 and 65 years was drawn by means of a drawing table
that had been previously attributed to the household.4
With this table, the total sample was balanced between men and women, and this balance was controlled by the age group.
The draw of the tracts within the microregion occurred in the following way:
• to each drawn microregion, seven census tracts were
allocated;
• the municipalities of the drawn microregion were
organized according to size; thus, seven implicit tract strata (zones) were created;
• to each zone corresponded the draw of one census
• the tract that was drawn in this way, whose prob-ability was proportional to its size in the year 2000, was recounted, so as to obtain the number of updated households, that is, its actual size. This count was performed before the draw of the tract’s households.
Therefore, a sample with a proportional representation of the cities’ size was guaranteed, and, consequently, a greater spread of the drawn units, called “fi rst selec-tion units”.
To each household, another one was drawn, within the same census tract and next to the fi rst. It served as a substitute in case of loss of the fi rst selection unit. In each one of the four great geographic strata, the number of census tracts in each capital was divided proportionally to their population. It was ensured, how-ever, that each capital had at least two tracts. After this allocation, the draw for each one of the 27 microregions of the capitals followed the same procedure described for the microregions that did not include capitals. Thus, the municipalities of each microregion containing the capital were organized by size, the census tracts were divided into zones and one tract of each zone was drawn. The process to select households and dwellers was the same one used for the inland strata, including the draw of substitution units.
SAMPLING RESULTS
To perform the data collection in the fi eld, a market
research company was hired to interview the 5,040 individuals. The development of the questionnaire
and the training of the interviewers and fi eld
coordi-nators were carried out and supervised by the survey coordination.
In the fi eldwork, 13 census tracts (2.3% of the total)
needed to be substituted: six in the North/Northeast
region, fi ve in the South region and two in São Paulo,
basically because they presented rural characteristics or due to impossibility of access (condominiums). These were substituted for tracts that were located near them and had similar characteristics (middle-income).
Tables 4 and 5 show the absolute and relative fi gures
to evaluate the sample’s behavior.
Approximately 70% of the sample was obtained with the fi rst selection households. The main reasons that de-termined the use of the reserve units were problems with the households (e.g. closed, used only in the summer, places not used for dwelling). The refusal proportion was around 10%, a proportion that can be considered low for surveys of this nature. Furthermore, 5% of the households were discarded because they did not have dwellers with ages complying with the survey’s inclusion criteria.
Evaluating the sample performance in the regions,
it was observed that the sample collected from fi rst
selection units was closer to what had been planned in the North/Northeast stratum, while in the other three regions the performances were very similar, and the substitution of fi rst selection units was more frequent.
The analysis of these fi gures suggests the absence of
relevant bias deriving from the data collection work, and it can be considered that these substitutions oc-curred at random.
The analysis of the data obtained by the complex sampling plan requires the use of techniques spe-cially developed to this purpose, mainly statistics with
Table 1. Population fi gures and the population percentage reached by the survey. Brazil, 2005.
Sampling stratum Population* Coverage (%) Brazil
Total population** 168,370,893 Urban population 137,015,685 Urban population aged
16 to 64 years*** 90,645,118
Target population 79,546,966 87.7 North/Northeast
Total population** 60,144,982 Urban population 41,722,290 Urban populationaged
16 to 64 years 26,348,629
Target population 20,027,545 76.6 Central-West/Southeast
Total population** 46,609,259 Urban population 40,769,874 Urban populationaged
16 to 64 years 27,339,181
Target population 24,678,821 90.3 State of São Paulo
Total population** 36,713,804 Urban population 34,332,375 Urban populationaged
16 to 64 years 23,415,976
Target population 22,849,375 97.6 South
Total population** 24,902,848 Urban population 20,191,146 Urban populationaged
16 to 64 years 13,541,332
Target population 11,991,225 88.6
* Source: Demographic Census 2000. Fundação IBGE. ** Population living in permanent private households. Elaborated by the authors.
weighted data for the non-biased, or almost non-biased,
estimation of the population parameters.5,6 The use of
estimators designed for simple randomized samples
may introduce relevant fl aws in these estimates6 and
the inadequacies would be even more remarkable if employed to calculate sampling errors. The majority of the computer programs available in the market have options for the calculation of weighted statistics. The same does not occur in the calculation of the sampling variances of estimators, which requires the presence of
special modules developed for that purpose.6
The survey’s data were used in the analysis of the sev-eral dimensions of the Brazilians’ sexual behavior, by different researchers and by means of distinct analysis techniques. The studies begin with the calculation of simple descriptive measures (means, proportions, ra-tios, indexes, linear combinations of variables, crossed tables and others). To obtain adequately precise esti-mates, the recommended procedures in the calculation of these statistics were:
• the use of a weighting system to produce
esti-mates;
• the intensive employment of ratio estimators;
• estimates of population totals in an indirect way,
and
• the use of specifi c SPSS packages to estimate
sam-pling errors.
Each interviewee was associated with a wi weight that is the inverse of his/her probability of inclusion. Although one person per household was drawn, the probability of including the household is not the same as that of the in-terviewee. Thus, another set of weights was constructed to estimate, whenever necessary, characteristics refer-ring to the household. Details of weights calculation can be found in the Appendix, which explains the statistical
procedures. Usually, the sum of these weights refl ects
the total domain described in the reference system. This sum corresponded to 5,040, which is the effective size of the collected sample. Therefore, we moved from one weighting system to another by means of the mul-tiplication of a constant. In short, each individual was associated with a wi weight so that Σwi=5040.
A key statistic in the calculation of several character-istics for a certain variable Y is its weighted total in the sample, given by the expression Ty=Σwiyi, where yi is the observed value of the Y characteristic for the ith individual of the sample. For example, a non-biased
estimator of the population mean is the weighted mean in the sample Σwiyi/Σwi. The employment of any of the two weighting systems would lead to the same estimate,
Table 2. Geographic regions according to the distribution of microregions over domains and population aged 16-64 years. Brazil, 2005.
Geographic Region
Microregion including the Capital
No Yes Total
Microregion Population* Microregion Population* Microregion Population*
North/Northeast 62 8,052 16 11,975 78 20,027
Central-West/Southeast 72 10,372 7 14,307 79 24,678
State of São Paulo 49 14,472 1 8,377 50 22,849
South 49 7,608 3 4,383 52 11,991
Total 232 40,505 27 39,041 259 79,546
* per 1,000 inhabitants
Table 3. Sample allocation. Brazil, 2005.
Sampling stratum
Number of
Hou-sehold
Micro-region
Census tract
Household per census
tract Total
North/
Northeast 1,260 25 140 9
Central-West/
Southeast 1,260 17 140 9
State of São
Paulo 1,260 14 140 9
South 1,260 16 140 9
Total 5,040 72 560
-Inland North/
Northeast 567 9 63 9
Central-West/
Southeast 630 10 70 9
State of São
Paulo 819 13 91 9
South 819 13 91 9
Total 2,835 45 315
-Capital North/
Northeast 693 16 77 9
Central-West/
Southeast 630 7 70 9
State of São
Paulo 441 1 49 9
South 441 3 49 9
Total 2,205 27 245
as the multiplication factor would appear simultane-ously in the numerator and in the denominator. The majority of the statistics employed in the analyses focused here can be expressed as being of the type ratio r=Ty/Tx, where T are estimators of the totals of the characteristics of interest X and Y. Therefore, they would also be adequate population estimators.
Proportion estimation is a direct application of the aforementioned ratio estimator. To exemplify: to esti-mate the proportion of women in the survey domain who, being between 30 and 60 years old, had more
than three children, one needs only to fi nd this value
in the sample. That is, the quotient px=Ty/Tx where
Tx= total number of women and Ty= total number of
women between 30 and 60 years old with more than three children, both estimated following the indicated recommendations.
The fi nding of estimates of totals for this population was based on data from population projections carried out by IBGE. In the previous example, to estimate the total number of women between 30 and 60 years old with more than three children, it would be necessary to obtain,
from the IBGE’s projections, the projected number Nx
of women existing in the universe of reference, and the
estimated total will then be Nx.px. Depending on the
available information about the populations, it would also be possible to use more refi ned methods, taking into account estimates produced for domains and strata.
Determining the sampling errors of the estimators in complex sampling plans requires special packages for their calculation. In this survey, the specifi c SPSS subroutines were used.
COMMENTS
The present paper briefl y described some
methodologi-cal procedures that are necessary to estimate popula-tion parameters and their respective sampling errors in studies on diverse aspects of the Survey of Sexual Behavior and HIV/AIDS Perceptions of the Brazilian Population, in 2005.
To perform the fi eld interviews in the 5,040 units
al-located in the diverse domains of the survey, it was nec-essary to have approximately 30% of substitute units, mainly due to refusals and to lack of dwellers with the
desired characteristics in the household. The behavior of these substitutions was very similar and did not imply relevant bias. The rate of interviews performance in the
fi rst selection households of the North/Northeast region was the highest, while in the other three regions these rates were lower and similar to one another.
Many of the studies described in this supplement com-pare the results found in 2005 with those of the 1998
survey. The results of the fi rst survey suggested that
the researchers should improve their data collection instruments. This was made in such a way as to ensure results comparability. Regarding the sampling plan, the
main changes introduced in 2005 were: the redefi nition
of the strata, aiming at other regional confi gurations, and the increase in the number of microregions eligible for the target population.
Despite the increase in the number of microregions, the same did not occur with the target population, dwellers with ages ranging between 16 and 64 years. The 1998 strata would have, in 2000, around 72 million people, while for the planning of 2005, this number, also in 2000, would be close to 79 million, corresponding to an increase of 7 million people (9.8%). Both surveys would have, therefore, a common universe of 90% of the population of interest with the data from the 2000 Demographic Census.
In the 1998 survey, the population was divided into three strata: North/Northeast (NONO), Expanded Cen-tral-West (COEX) and Expanded South (SULX), while the 2005 survey is distributed over four strata.
Table 4. Characteristics of the number and proportion of conducted interviews. Brazil, 2005.
Region Scheduled Conducted
1st Selection
Ineligible Household
Conducted Substitute
Outside the age group
Total of refusals
North/Northeast 1260 886 167 374 41 64
Central-West/Southeast 1260 732 200 528 60 121
State of São Paulo 1260 675 151 585 41 107
South 1260 674 193 586 81 118
Total 5040 2967 711 2073 223 410
Table 5. Some indicators of interviews performance in relation to the total number of eligible households. Brazil, 2005.
Region
Proportion of
Conducted in the 1st selected
household
Refusal
Outside the age group
North/Northeast 81.1% 5.9% 3.8% Central-West/
Southeast 69.1% 11.4% 5.7%
State of São
Paulo 60.9% 9.6% 3.7%
South 63.2% 11.1% 7.6%
With the purpose of comparing differences between the two analyzed domains, data from the 2000 Census
were used, that is, it was estimated how the fi gures
would be in 2000 with the conditions imposed in the 1998 design and in the 2005 one. The results are shown in Tables 6 and 7.
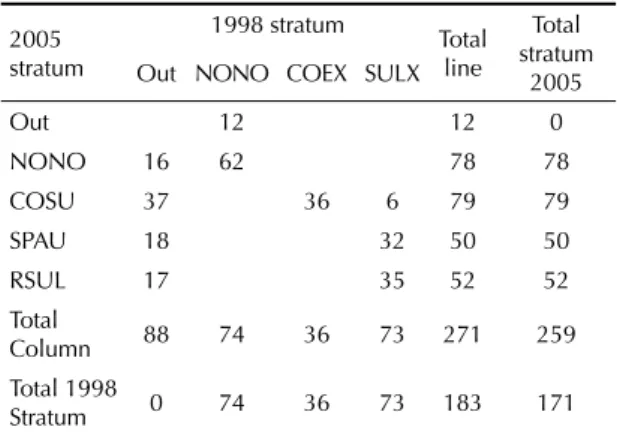
Observing the Tables, it can be verifi ed that in 1998
the domain was constituted by 183 microregions. This increase occurred due to the incorporation of 88 new microregions and to the exclusion of 12 former ones. The increase occurs mainly as a result of the incorpora-tion of new microregions of the most populated states
of Brazil: São Paulo, Minas Gerais, Rio de Janeiro, Rio Grande do Sul and Pernambuco.
Although comparisons between the two surveys are drawn based on distinct populations, signifi cant differ-ences observed in relation to the studied characteristics should be attributed to effective changes in behavior, rather than to possible differences between the popula-tions. Attributing a possible difference between results of the two surveys to the fact that we are dealing with different populations would only be possible if the behavior of these new 10% of the population were, for the most part, in the opposite course and direction compared to the results of the 1998 survey. Given the composition of these new microregions, it is very un-likely that this should occur.
Table 6. Distribution of the number of microregions and respective populations aged 16 to 65 years. Brazil, 1998 and 2005.
2005 stratum
1998 stratum
Total line
Total stratum
2005 Out NONO COEX SULX
Out 12 12 0
NONO 16 62 78 78
COSU 37 36 6 79 79
SPAU 18 32 50 50
RSUL 17 35 52 52
Total
Column 88 74 36 73 271 259
Total 1998
Stratum 0 74 36 73 183 171
Out, indicating that it did not belong to the stratum of that year, NONO=North and Northeast; COEX=Expanded Central-West; SULX = Expanded South; COSU=Central-West and Southeast; SPAU=São Paulo and RSUL=South.
Source: Data from the 2000 Demographic Census
Table 7. Distribution of the population aged 16 to 64 years over the 1998 and 2005 strata.
2005 stratum
1998 stratum*
Total Line*
Total Stratum*
2005 Out NONO COEX SULX
Out 990 990 0
NONO 1,358 18,670 20,027 20,027
COSU 3,376 12,827 8,475 24,679 24,679
SPAU 1,877 20,972 22,849 22,849
RSUL 1,498 10,493 11,991 11,991 Total
column 8,109 19,660 12,827 39,941 80,537 79,547
Total 1998 stratum
0 19,660 12,827 39,941 72,428 71,438
* per 1,000 inhabitants
1. Berquó E, Barbosa RM, Grupo de Estudos em População, Sexualidade e Aids. [Introdução]. Rev
Saude Publica. 2008;42(Supl 1):7-11.
2. Bolfarine H, Bussab WO. Elementos de amostragem. São Paulo: Edgard Blücher; 2005.
3. Kish L. Survey Sampling. New York: John Wiley & Sons; 1965.
4. Marques RM, Berquó ES. Seleção da unidade de informação em estudos de tipo “survey”: um método
para a construção das tabelas de sorteio. Rev Bras
Estat. 1976;37(145):81-92.
5. Pessoa DGC, Silva PLN. Análise de dados amostrais complexos. São Paulo: Associação Brasileira de Estatística; 1998.
6. United Nations. Department of Economic and Social Affairs. Statistics Division. Household sample surveys in developing and transition countries. New York; 2005. [Series F, 96]. Disponível em: http://unstats. un.org/unsd/HHsurveys/pdf/Household_surveys.pdf REFERENCES
Article based on the data from the survey “Comportamento sexual e percepções da população brasileira sobre HIV/Aids (Sexual behavior and perceptions of Brazilian population on HIV/AIDS)”, sponsored by the Brazilian Ministry of Health through the Centro Brasileiro de Análise e Planejamento (Process n. ED 213427/2004).
This article followed the same peer-review process as any other manuscript submitted to this journal, anonymity was guaranteed for both authors and reviewers.
APPENDIX
Probability of inclusion a. Nomenclature
(i). Variables
P = population between 16 and 64 years old (IBGE)
D = private households in the Census (IBGE)
D’= counted private households (obtained in the
fi eld)
a = number of census tracts allocated in the strata (sampling plan)
M = number of dwellers in the household (counted in the fi eld)
c = effective number of interviewed houses (fi
eld-work)
b = number of microregions drawn in the country’s inland (sampling plan)
(ii) Indexes
h = stratum
j = microregion (MR)
k = census tract (SC)
l = household
i = individual
(iii) Used conventions
Mhjkl = number of dwellers existing in the household l
of the SC k in the MR j of stratum h.
The suppression of an index indicates the sum of values of that variable for that indicator. Thus, Mhjk = ΣMhjkl indicates the total number of households in the SC k of the MR j of stratum k.
The same conventions apply to the other indexes and variables.
b. Estimates referring to the Capitals
In the capitals there is only one MR; thus, there is no index j.
Expected probability
P(Ihkli∈A) = ah . Dhk· · = Dh
9ah Mhkl. Dh
9
Dhk
1
Mhkl
Effective probability
P(Ihkli∈A) = 9ah · · = · MhklDh
Dhk Dhk
chk
9
ahchk MhklDh
Dhk Dhk
c. Estimates referring to the Inland
Theoretical probability
7.Dhjk
Dhj
63bh.Phj
PhDhjMhjkl
9
Dhjk
1
Mhjkl P(Ihkli∈A) = bhPhj· · · =
Ph
Effective probability
Dhjk Dhjk
63bh.Phj
PhDhjMhjkl
P(Ihkli∈A) = · · chk