1
Escola Superior de Hotelaria e Turismo do Estoril, Departamento das Ciências da Alimentação. Av. Condes de Barcelona, 808, 2769-510, Estoril, Portugal. Correspondência para/Correspondence to: CACL VIEGAS. E-mail: <[email protected]>.
2
Universidade Nova de Lisboa, Faculdade de Ciências Médicas, Departamento de Saúde. Lisboa, Portugal.
3
Universidade do Porto, Faculdade de Ciências da Nutrição e Alimentação, Departamento de Ciências da Nutrição. Porto, Portugal.
4
Universidade Nova de Lisboa, Instituto de Higiene e Medicina Tropical, Departamento de Epidemiologia e Estatística. Lisboa, Portugal.
Evaluation of salt content
in school meals
Avaliação do conteúdo de sal
em refeições escolares
Cláudia Alexandra Colaço Lourenço VIEGAS1
Jorge TORGAL2
Pedro GRAÇA3
Maria do Rosário Oliveira MARTINS4
A B S T R A C T
Objective
High blood pressure is a major rick factor for cardiovascular disease, and it is closely associated with salt intake. Schools are considered ideal environments to promote health and proper eating habits. Therefore the objective of this study was to evaluate the amount of salt in meals served in school canteens and consumers’ perceptions about salt.
Methods
Meals, including all the components (bread, soup, and main dish) were retrieved from school canteens. Salt was quantified by a portable salt meter. For food perception we constructed a questionnaire that was administered to high school students.
Results
A total of 798 food samples were analysed. Bread had the highest salt content with a mean of 1.35 g/100 g (SD=0.12). Salt in soups ranged from 0.72 g/100 g to 0.80 g/100 g (p=0.05) and, in main courses, from 0.71 g/100 to 0.97 g/100g (p=0.05). The salt content of school meals is high with a mean value of 2.83 to 3.82 g of salt per meal. Moreover, a high percentage of students consider meals neither salty nor bland, which shows they are used to the intensity/amount of salt consumed.
Conclusion
choices are only possible in environments where such choices are possible. Therefore, salt reduction strategies aimed at the food industry and catering services should be implemented, with children and young people targeted as a major priority.
Keywords: Health promotion. School feeding. Sodium chloride. Taste perception.
R E S U M O
Objetivo
Considerando que a pressão arterial elevada constitui um dos maiores fatores de risco para as doenças cardiovasculares e sua associação ao consumo elevado de sal, bem como o fato de as escolas serem considerados ambientes de excelência para fomentar a aquisição de bons hábitos alimentares e promover a saúde, o objetivo deste estudo foi avaliar o conteúdo de sal presente nas refeições escolares e a percepção dos consumidores sobre o sabor salgado.
Métodos
Foram recolhidas refeições nas cantinas das escolas, analisando-se todos os seus componentes (pão, sopa e prato principal). A quantificação de sal foi realizada com um medidor de sal portátil. Para a avaliar a percepção dos consumidores foi desenvolvido e aplicado um questionário aos alunos das escolas preparatórias e secundárias.
Resultados
Foram analisados 798 componentes de refeições. O pão apresentou o valor mais elevado de sal, com média de 1,35 g/100 g (SD=0.12). O conteúdo de sal nas sopas apresentou média de 0,72 g/100 g a 0,80 g/100 g (p=0,05) e, nos pratos principais, de 0,71 g/100 a 0,97 g/100 g (p=0,05). Em média, as refeições escolares disponibilizaram entre 2,83 e 3,82 g de sal por porção servida, o que representa de duas a cinco vezes mais em relação à dose diária recomendada para crianças e jovens. Para a maioria dos estudantes, o sabor das refeições foi percebido como sendo nem salgado nem insosso, o que parece demonstrar adaptação à intensidade/ quantidade de sal consumida.
Conclusão
Escolhas alimentares saudáveis e adequadas só são possíveis se sustentadas por um ambiente que as facilite. Considerando o impacto que o consumo de sal tem na saúde, em particular nas doenças crônicas, a implementação de estratégias de redução de sal - nas indústrias, serviços de catering e restaurantes -, é imperativa, em particular direcionada para o público mais jovem.
Palavras-chave: Promoção da saúde. Alimentação escolar. Cloreto de sódio. Percepção gustatória.
I N T R O D U C T I O N
Diet and nutrition are recognised as decisive factors for individual health with direct influence on one’s physical and psychological well-being both in the present and in the future1, which is why these factors are considered of particular importance in preventing diseases1,2.
Among chronic diseases, cardiovascular diseases continue to be the leading cause of death worldwide3,4. There are many risk factors that contribute to cardiovascular disease, among which high blood pressure is thought to have the biggest influence (12.8%), estimated to be responsible for 51.0% of mortality from stroke
and 45.0% of mortality due to coronary heart disease5.
Among the different factors that contribute to high blood pressure, salt intake has been extensively studied2,5. In recent years, several authors have reinforced the scientific evidence, suggesting that the influence of salt is far greater than that of other lifestyle factors, such as excess weight, low fruit and vegetable consumption, or physical inactivity. Animal, epidemiological, and population intervention studies have shown that blood pressure increases progressively with higher doses of salt, and decreases correspondingly when salt intake is reduced9-19. Studies of younger populations also clearly show the negative effect of salt on blood pressure and the future negative effect of high salt intake at young ages20,21. Hypertension represents a major challenge in terms of public health, and several researchers and official organizations have stated that prevention strategies, detection, treatment, and control should be prioritized22-24, particularly among the younger population8,25,26.
Portugal has a tradition for high salt consumption, which has become part of families’
eating habits, introducing salt at an early age. It is known that when individuals are exposed to large amounts of salt, the salt receptors are suppressed, whereby one becomes accustomed to the doses, which makes higher amounts of salt necessary for flavour perception27-29. Although we know that western societies consume about 10 to 12 g of salt, greatly exceeding the daily requirements (Table 1)30,31, there are few studies that have evaluated salt intake in young populations, which is important considering the
impact that salt consumption can have on the future blood pressure of individuals.
It is well known that the environment is crucial for individual behaviour and lifestyle, often conditioning our choices32-34. Schools are considered to be one of the best places to promote health35, to encourage proper eating habits, and to provide the environment for hands-on learning over time and repeatedly36.
As such, we conveyed two hypotheses: 1) Do school meals provide excessive salt? 2) What are the children’s perceptions about salt? The consumption of meals high in salt as well as the use of too much salt in cooking may contradict the information conveyed in the classroom, which led us to the last hypothesis, questioning the effect of school on salt intake and perception. Furthermore, the consumption of excess salt conditions the taste buds, thus constituting a less positive influence on younger generations, and not making a positive contribution to the public education of this population group. Therefore, the objective of this study was to: (1) evaluate the amount of salt in meals served in school canteens; (2) evaluate consumers’ perceptions about salt; (3) discuss the influence of the school on salt intake and taste perception.
M E T H O D S
This study used quantitative techniques to describe the salt content of meals served in schools and to understand consumer perceptions.
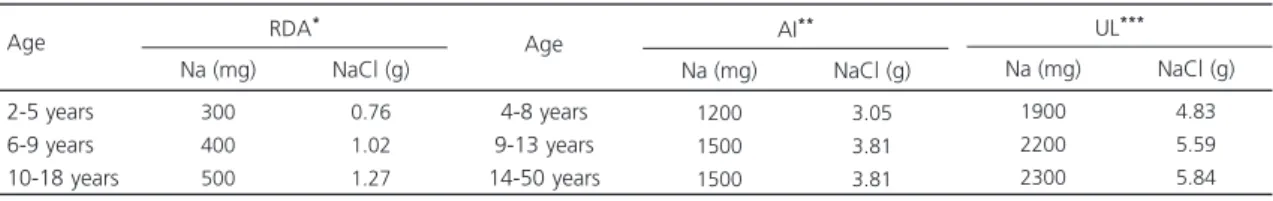
Table 1. Sodium (Na) and salt (NaCl) daily reference intakes.
2-5 years 6-9 years 10-18 years
Note: *Recommended Dietary Allowance (RDA) - corresponds to the amount of daily ingestion that is sufficient to cover the needs of 97 to 98% of the individuals of the same age and the same gender. **Adequate Intake (AI) - corresponds to a value based on the intake of a particular nutrient, adjusted experimentally or resulting from observation in populations in apparently healthy individuals. ***Tolerable Upper (TU) Limit intake level -corresponds to the highest continued daily ingestion of a nutrient that apparently does not have adverse effects on health in almost all individuals of the same age and the same gender.
Age
300 400 500
0.76 1.02 1.27 Na (mg) NaCl (g)
RDA*
4-8 years 9-13 years 14-50 years
Age
1900 2200 2300
4.83 5.59 5.84 Na (mg) NaCl (g)
UL***
1200 1500 1500
3.05 3.81 3.81 Na (mg) NaCl (g)
The study took place in the Cascais Region, which is one of the most well known regions in Portugal for tourism and considered to be one of the best places to live. To evaluate the amount of salt in school meals we included all the schools, from pre-schools to high schools; for consumers’
perceptions about salt we included all children and adolescents of both genders (N=10,924) from all eight high schools, due to the fact that children above ten years old were able to clearly read, understand, and answer the questionnaire.
Salt was quantified in all the kindergartens and elementary schools (Group 1 [G1]) and all high schools (Group 2 [G2]), which were assigned to two different companies, both of whom agreed to participate in the study anonymously. All the schools provided a single daily menu, which included bread, soup, a main dish, a salad, and dessert. Using sample size calculation for average estimation, we determined a minimum of 95 school meals. We collected 798 samples, which included all the components of the meals - bread (102), soup (265), main dish (384) and salad (47), excluding the dessert since it does not have any impact on the amount of salt intake.
Salt was analysed by a portable salt meter that uses electrical conductivity - PAL ES2 from ATAGO37. The selected salt meter is highly accurate, giving the same repeat results and having been compared with the Mohr method (laboratory reference method for salt analysis). These tests found slightly higher levels of salt in the samples than those provided by PAL ES2 since proteins, fats, and other food components, which do not have electrical conductivity, tend to mask salt. To overcome this problem, the sample should be diluted for more accurate results. We previously analysed 15 meals with both methods and performed statistical analyses to validate agreement of both methods using the Bland-Altman plot and t-test for mean difference38,39, concluding there was no difference between the methods (p<0.01). The mean difference between the two tests is 0.067 (Standard Deviation-SD=0.14); (Confidence Interval-CI=[-0.147, 0.013]) (p=0.05).
Questionnaire to evaluate food perception
Using similar studies40-42 to compose the questions, we drew up a questionnaire to assess food perceptions. The questionnaire was divided into two sections: (1) sociodemographic characterization; (2) eating habits and perceptions in school periods. Given that this survey involved a relatively young population, we sought to keep the questions simple and limit the technical language.
Each section of the questionnaire was developed in accordance with the objectives of the study, and the questions were split into four groups: sociodemographic characterization, eating habits and lifestyle, nutritional concerns and knowledge, and perceptions about the meals served in the cafeteria.
A pre-test was performed which included a page for students to record how long it took to fill in the form and to indicate the main difficulties completing the form, and also to detect errors. From the pre-test we reformulated questions for better understanding. The pre-test also allowed for validation of data input and appropriate statistical analysis, according to the study objectives and hypotheses.
Using sample size calculation we determined a maximum error of 2.88%, having administered the questionnaire to 1,049 students from high schools (ages 10 to 21). Parent and school consent was obtained to administer the questionnaire.
R E S U L T S
A total of 798 food samples were analysed, 102 bread samples, 265 soup samples (106 local cooking G1, 72 cook & chill G1, 87 local cooking G2), 384 main dishes (117 local cooking G1, 154 cook & chill G1, 113 local cooking G2), and 47 salads. There were no bread samples for the schools with cook and chill meals, or salads, because they were similar to the G1 schools with local cooking. The G2 schools did not fully comply with sample collection and did not save the bread and salad samples. Nevertheless, the bread suppliers are local, so we can expect to have similar results.
As shown in Table 2, the food item with the highest global salt value is bread with a mean value of 1.35 (±0.12). Soups and main courses
have a wider variability, local cooking presenting slightly higher values than cook and chill. The mean value for salt was 0.76 g/100 g (±0.22) for the local cooking GI, 0.72 g/100 g (±0.29) for the cook and chill G1, and 0.80 g/100 g (±0.21) for the local cooking G2. Tests for the mean difference were performed between all the groups showing there were no significant differences between soups from each group (Wilcoxon test, p<0.01).
For the main course we also found higher values on local cooking versus cook and chill. Local cooking G1 presents a mean value for salt of 0.97 g/100 g (±0.27), similar to local cooking G2 which is 0.92 g/100 g (±0.25) while cook and chill G1 presents a mean value of 0.71 g/100 g (±0.37). As expected there were significant differences between local cooking and cook and chill (Wilcoxon test, p<0.01).
Table 2. Salt per 100 g - food items and school groups. Cascais schools, 2011/2012.
Bread
Soup
Main course
Salad
G1 LC
G1 LC G1 CC G2 LC
G1 LC G1 CC G2 LC
G1 LC
1.35
0.76 0.72 0.80
0.97 0.71 0.92
0.55 Mean
0.12
0.26 0.29 0.21
0.27 0.37 0.25
0.33 SD
1.40
0.76 0.80 0.80
1.00 0.77 0.90
0.40 Median
0.20
0.29 0.42 0.35
0.30 0.40 0.30
0.20
Inter Quartile Range
±
± ± ±
± ± ±
± Food item School group
±
(g/100 g)
Note: G1: Group 1; G2: Group 2; LC: Local Cooking; CC: Cook and Chill; SD: Standard Deviation.
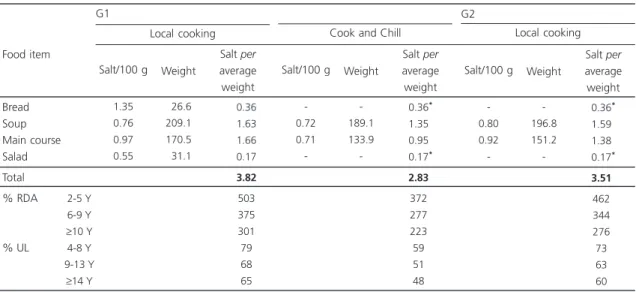
We also weighed all the samples and calculated the amount of salt per weight as shown in the boxplots of Figure 1 and Table 3. As we can see, although bread has the highest mean value of salt per 100 g (1.35 g), the average serving size is 27.6 g (±5.5), which accounts for 0.36 g/salt per portion, while soups and main courses have mean values of 0.72 g/100 g to 0.97 g/100 g, but account for much more salt intake, with mean values ranging from 0.95 to 1.7 g, maximum values going up to nearly 4 g of salt. Global mean values are shown in Table 3.
The food perception questionnaire obtained a total of 1,049 responses, 52.2% female and 42.8% male, with a mean age of 14 years (±1.93), ranging from 10 to 21. The most common places for children to eat their lunch are school (26.0 to 42,0%) and home (30.0 to 52.0%). The mother is usually responsible for the home cooking (70.0%).
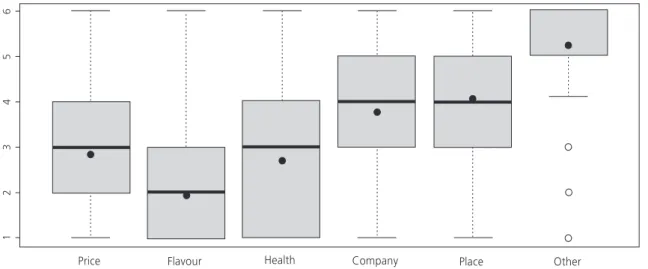
The main factor when choosing what to eat is flavour (µ=1.936), followed by health (µ=2.726), price (µ=2.83), company (µ=3.782), and ranked last is the place where the student chooses to eat (µ=4.083) (Figure 2). Among the other factors mentioned, the most frequent answers
Table 3. Mean salt content per average meal served/comparison to the Reference Daily Intake (RDA) and Upper Limit (UL). Cascais
schools, 2011/2012. Bread Soup Main course Salad Total % RDA % UL
Note: *Values used from the G1 (Group 1) local cooking.
y: years. Food item 1.35 0.76 0.97 0.55 026.6 209.1 170.5 031.1 0.36 1.63 1.66 0.17 3.82 503 375 301 79 68 65 Salt/100 g Weight
Salt per
average weight -0.72 0.71 -189.1 133.9 -0.36* 1.35* 0.95* 0.17* 2.83* 372* 277* 223* 59* 51* 48*
Salt/100 g Weight
Salt per
average weight -0.80 0.92 -196.8 151.2 -0.36* 1.59* 1.38* 0.17* 3.51* 462* 344* 276* 73* 63* 60*
Salt/100 g Weight
Salt per
average weight Local cooking Cook and Chill
G1
Local cooking G2
2-5 Y 6-9 Y ≥10 Y
4-8 Y 9-13 Y
≥14 Y
were the appearance, quantity, quality, and hygiene.
Sixty-two per cent of the students consider the degree of concern about nutrition to be important (50%) or very important (12%) when consuming a meal, but 29% are indifferent, while 9% consider it to be of low importance (5%) or not important at all (4%). Only 34% of the students frequently take nutritional aspects into account when choosing the meal, 40% take them into consideration sometimes and 26% rarely or never.
The large majority (96%) considers food to have a significant impact on health and cite obesity and diabetes as the diseases most related to food. In relation to salt, most students who had their last meal in the school canteen (29% of the total) found it neither salty nor bland (76%), 17% considered it very salty or salty, and 7% said it had no salt or very little salt.
D I S C U S S I O N
to 42%, these meals contribute with a significant amount of salt, often exceeding 50% of the UL, potentially placing at risk the health of the children and adolescents who consume these meals.
Apart from this risk it is also important to consider the context in which these meals take place since schools should ensure the development and acquisition of good eating habits, making sure that the dissemination of theoretical messages and knowledge36 is not confined merely to the theoretical context of the curriculum, but is part of the practices of the school environment, so as not to convey contradictory messages35.
Also, a very high percentage of students consider meals to be neither salty or lacking in salt, which shows they are accustomed to the intensity/amount of salt consumed. Several authors discuss the conditioning towards salt perception as a reflex of the amount of salt usually consumed and the importance of gradual reduction to decrease the threshold and enhance perception at lower intake levels31,47-49. So, the provision of these meals is not contributing to educate their consumers for a “less salty” taste, but in fact the opposite, which is unfortunate since young ages are considered to be crucial for taste definition and learning50.
We can also see that students show some concern about food and nutrition. Although most of this concern is related to calories, some
Figure 2. Main factors when deciding what/where to eat.
students are aware of salt. Not only awareness about nutrition is increasing, but we can also observe that students can relate nutrition to common diseases. Consumer concerns and awareness about food and nutrition are increasing51,52 and should be regarded as an opportunity to intervene, especially when considering a younger population25,26. At the same time we observe that taste (flavour) is the main factor when choosing a meal, which might override nutritional concerns. Cognition about food, diseases and nutrition is not enough when choosing foods, especially when considering young populations. Several authors have reached the conclusion that flavour is very important for food choice53-55 and that young people, although aware of nutritional aspects and concerns, consider that at their age it is not imperative to make the right choices56, which is why proper environments are so important in facilitating choices57. This means that sensory characteristics of food should always be taken into consideration when developing new foods or reformulating existing ones.
C O N C L U S I O N
The school meals evaluated in this study clearly account for a high intake of salt, reaching the upper level of tolerable intake, which might put children at risk of disease. Children and adolescents seem to be aware of nutritional concerns, but taste acts as a major factor in food choice. Knowing that food available to consumers determines individual choices and may provide an incentive or a barrier to good choices, we believe that there should be a greater effort from the catering service to provide healthy foods that are both tasty and appealing. Therefore salt reduction strategies, especially aimed at the food industry and catering services, should be implemented, targeting children and young people as a major priority.
A C K N O W L E D G E M E N T S
The authors acknowledge the support and cooperation provided by the school pupils, staff, and companies that supplied the school meals.
C O N T R I B U T O R S
CACL VIEGAS wrote the article. P GRAÇA, MRO MARTINS and J TORGAL supervised the article.
R E F E R E N C E S
1. World Health Organization, Food and Agriculture Organization. Diet nutrition and the prevention of chronic diseases; 2003 [cited 2008 Apr 12]. Available from: http://whqlibdoc.who.int/trs/ who_trs_916.pdf
2. World Health Organization. The european health report 2002: WHO regional publications. Copenhagen: WHO; 2002 [cited 2008 Apr 12]. Available from: http://www.euro.who.int/__data/ assets/pdf_file/0007/98296/E76907.pdf
3. World Health Organization. Deaths from CVD and diabetes. Geneva: WHO; 2012 [cited 2012 Oct 23]. Available from: http://www.who.int/gho/ncd/ mortality_morbidity/cvd/en/index.html
4. Beaglehole R, Ebrahim S, Reddy S, Voute J, Leeder S, Chronic Disease Action Group. Prevention of chronic diseases: A call to action. Lancet. 2008; 370(9605):2152-7.
5. World Health Organization. Global health risks: Mortality and burden of disease attributable to selected major risks. Geneva: WHO; 2009 [cited 2012 Oct 1]. Available from: http://www.who.int/ healthinfo/global_burden_disease/GlobalHealth Risks_report_full.pdf
6. Polónia J, Maldonado J, Ramos R, Bertoquini S, Duro M, Almeida C, et al. Estimation of salt intake by urinary sodium excretion in a portuguese adult population and its relationship to arterial stiffness. Rev Port Cardiol. 2006; 25(9):801-17.
7. Instituto Nacional de Estatística. Dados Estatísticos. Lisboa: Instituto Nacional de Estatística; 2011 [acesso 2012 nov 11]. Disponível em: http:// www.ine.pt/xportal/xmain?xpid=INE&xpgid= ine_base_dados
8. Espiga M, Macedo MJL, Silva AO, Alcântara P, Ramalhinho V, Carmona J. Prevalência, conheci-mento, tratamento e controlo da hipertensão em portugal. Estudo PAP [2]. Rev Port Cardiol. 2007; 26(1):21-39.
9. Forte JG, Miguel JM, Miguel MJ, Pádua F, Rose G. Salt and blood pressure: A community trial. J Hum Hypertens. 1989; 3(3):179-84.
10. Stamler J. The INTERSALT study: Background, methods, findings, and implications. Am J Clin Nutr. 1997; 65(2 Suppl):626S-42S.
populations. Circulation. 2007; 116(14):1563-8. http://dx.doi.org/10.1161/CIRCULATIONAHA.10 6.675579
12. Denton D, Weisinger R, Mundy NI, Wickings EJ, Dixson A, Moisson P, et al. The effect of increased salt intake on blood pressure of chimpanzees. Nat Med. 1995; 1(10):1009-16.
13. Vollmer WM, Sacks FM, Svetkey LP. New insights into the effects on blood pressure of diets low in salt and high in fruits and vegetables and low-fat dairy products. Curr Control Trials Cardiovasc Med. 2001; 2(2):71-4.
14. Shay CM, Stamler J, Dyer AR, Brown IJ, Chan Q, Elliott P, et al. Nutrient and food intakes of middle-aged adults at low risk of cardiovascular disease: The international study of macro-/micronutrients and blood pressure (INTERMAP). Eur J Nutr. 2011; 51(8):917-26. http://dx.doi.org/10.1007/s00394-0 11-0268-2
15. Cook NR, Cutler JA, Obarzanek E, Buring JE, Rexrode KM, Kumanyika SK, et al. Long term effects of dietary sodium reduction on cardiovascular disease outcomes: Observational follow-up of the Trials of Hypertension Prevention (TOHP). BMJ. 2007; 334(7599):885-8. http://dx.doi.org/10.1 136/bmj.39147.604896.55
16. Khaw KT, Bingham S, Welch A, Luben R, O’Brien E, Wareham N, et al. Blood pressure and urinary sodium in men and women: The norfolk cohort of the european prospective investigation into cancer (epic-norfolk). Am J Clin Nutr. 2004; 80(5):1397-403. 17. Tuomilehto J, Jousilahti P, Rastenyte D, Moltchanov V, Tanskanen A, Pietinen P, et al. Urinary sodium excretion and cardiovascular mortality in finland: A prospective study. Lancet. 2001; 357(9259): 848-51. http://dx.doi.org/10.1016/S0140-6736 (00)04199-4
18. Sacks FM, Svetkey LP, Vollmer WM, Appel LJ, Bray GA, Harsha D, et al. Effects on blood pressure of reduced dietary sodium and the Dietary Approaches to Stop Hypertension (DASH) diet. DASH-Sodium collaborative research group. N Engl J Med. 2001; 344(1):3-10. http://dx.doi.org/ 10.1056/NEJM200 101043440101
19. MacGregor GA, Markandu ND, Sagnella GA, Singer DR, Cappuccio FP. Double-blind study of three sodium intakes and long-term effects of sodium restriction in essential hypertension. Lancet. 1989; 2(8674):1244-7.
20. He FJ, Marrero NM, Macgregor GA. Salt and blood pressure in children and adolescents. J Hum Hypertens. 2008; 22(1):4-11. http://dx.doi.org/ 10.1038/sj.jhh.1002268
21. Geleijnse JM, Hofman A, Witteman JC, Hazebroek AA, Valkenburg HA, Grobbee DE. Long-term effects of neonatal sodium restriction on blood pressure. Hypertension. 1997; 29(4):913-7.
22. Frisoli TM, Schmieder RE, Grodzicki T, Messerli FH. Salt and hypertension: Is salt dietary reduction worth the effort? Am J Med. 2012; 125(5):433-9. http://dx.doi.org/10.1016/j.amjmed.2011.10.023 23. Webster J, Dunford E, Huxley R, Li N, Nowson CA, Neal B. The development of a national salt reduction strategy for Australia. Asia Pac J Clin Nutr. 2009; 18(3):303-9.
24. Kearney PM, Whelton M, Reynolds K, Muntner P, Whelton PK, He J. Global burden of hypertension: Analysis of worldwide data. Lancet. 2005; 365(9455):217-23. http://dx.doi.org/10.1016/ S0140-6736(05)17741-1
25. Kawada T, Suzuki S. Attention of salt awareness to prevent hypertension in the young. J Clin Hypertens. 2011; 13(12):933-4. http://dx.doi.org/ 10.1111/j.1751-7176.2011.00555.x
26. Spagnolo A, Giussani M, Ambruzzi AM, Bianchetti M, Maringhini S, Matteucci MC, et al. Focus on prevention, diagnosis and treatment of hypertension in children and adolescents. Ital J Pediatr. 2013; 39:20. http://dx.doi.org/10.1186/ 1824-7288-39-20
27. Freeman DA, Petitti DB. Commentary: Salt, blood pressure and public policy. Int J Epidemiol. 2002; 31(2):319-20.
28. Dötsch M, Busch J, Batenburg M, Liem G, Tareilus E, Mueller R, et al. Strategies to reduce sodium consumption: A food industry perspective. Crit Rev Food Sci Nutr. 2009; 49(10):841-51. http://dx. doi.org/10.1080/10408390903044297
29. Morris MJ, Na ES, Johnson AK. Salt craving: The psychobiology of pathogenic sodium intake. Physiol Behav. 2008; 94(5):709-21. http://dx.doi.org/ 10.1016/j.physbeh.2008.04.008
30. Food and Nutrition Board, Institute of Medicine, National Academies. Dietary Reference Intakes (DRIs): Estimated Average Requirements. Washington (DC): Institute of Medicine [cited 2012 Nov 11]. Available from: http://www.iom.edu/ Activities/Nutrition/SummaryDRIs/~/media/Files/ Activity%20Files/Nutrition/DRIs/5_Summary %20Table%20Tables%201-4.pdf
31. Food Safety Authority of Ireland. Salt and health: Review of the scientific evidence and recommendations for public policy in Ireland. Dublin: Food Safety Authority of Ireland; 2005 [cited 2007 May 11]. Available from: http:// www.fsai.ie/uploadedFiles/Science_and_Health/ salt_report-1.pdf
32. Stokols D. Establishing and maintaining healthy environments. Toward a social ecology of health promotion. Am Psychol. 1992; 47(1):6-22. 33. Hill JO. Understanding and addressing the epidemic
34. Hill O. Environmental contributions to the obesity epidemic. Science. 1998; 280(5368):1371-4. http:// dx.doi.org/10.1126/science.280.5368.1371 35. World Health Organization. Promoting health
through schools: Report of a Who Expert Committee on Comprehensive School Health Education and Promotion. Geneva: WHO; 1997 [cited 2008 Apr 12]. Available from: http:// whqlibdoc.who.int/trs/WHO_TRS_870.pdf 36. Gross SM, Cinelli B. Coordinated school health
program and dietetics professionals: Partners in promoting healthful eating. J Am Diet Assoc. 2004; 104(5):793-8. http://dx.doi.org/10.1016/j.jada. 2004.02.024
37. ATAGO. Products/Digital Salt-meter-saltmeter, PAL-ES2, PAL-ES3, ES-421. Japão: ATAGO; 2012 [cited 2012 Nov 14]. Available from http://www.atago. net/english/products_salt.php
38. Krouwer JS, Monti KL. A simple, graphical method to evaluate laboratory assays. Eur J Clin Chem Clin Biochem. 1995; 33(8):525-28.
39. Altman DG, Bland JM. Measurement in medicine: The analysis of method comparison studies. The Statistician. 1983; 32:307-17.
40. Olstad DL, Downs SM, Raine KD, Berry TR, McCargar LJ. Improving children’s nutrition environments: A survey of adoption and implementation of nutrition guidelines in recreational facilities. BMC Public Health. 2011; 11:423. http://dx.doi.org/10.1186/ 1471-2458-11-423.
41. Timperio A, Ball K, Roberts R, Campbell K, Andrianopoulos N, Crawford D. Children’s fruit and vegetable intake: Associations with the neighbourhood food environment. Prev Med. 2008; 46(4):331-5. http://dx.doi.org/10.1016/ j.ypmed.2007.11.011
42. Pettinger C, Holdsworth M, Gerber M. Meal patterns and cooking practices in southern france and central england. Public Health Nutr. 2007; 9(08):1020-6. http://dx.doi.org/10.1017/PHN2006 945
43. Venables WN, Smith DM, Core Team R. An introduction to R: Notes on R: A programming environment for data analysis and graphics. Wien: Wirtschaftsuniversität Wien; 2008.
44. He FJ, MacGregor GA. Importance of salt in determining blood pressure in children: Meta-analysis of controlled trials. Hypertension. 2006; 48(5):861-9. http://dx.doi.org/10.1161/01.HYP.00 00245672.27270.4a
45. Conselho Nacional de Alimentação e Nutrição. Recomendações para a educação alimentar da população portuguesa. Lisboa: Instituto Nacional de Saúde Dr. Ricardo Jorge; 1997.
46. Cruz JAA, Pereira A, Miguel JMP, Conselho Nacional de Alimentação e Nutrição. Contribuição para uma
política alimentar e nutricional em portugal: situação alimentar e nutricional portuguesa, reco-mendações do CNAN para a melhoria da situação existente. Lisboa: Conselho Nacional de Alimen-tação e Nutrição; 1989.
47. He FJ, Markandu ND, MacGregor GA. Modest salt reduction lowers blood pressure in isolated systolic hypertension and combined hypertension. Hypertension. 2005; 46(1):66-70. http://dx.doi.org/ 10.1161/01.HYP.0000171474.84969.7a
48. He FJ, MacGregor GA. How far should salt intake be reduced? Hypertension. 2003; 42(6):1093-9. http://dx.doi.org/10.1161/01.HYP.000010286 4.05174.E8
49. Hoption Cann SA. Salt in food. Lancet. 2005; 365(9462):845-6. http://dx.doi.org/10.1016/S0 140-6736(05)71038-2
50. Sellen DW. Evolution of infant and young child feeding: Implications for contemporary public health. Annu Rev Nutr. 2007; 27:123-48. http:// dx.doi.org/10.1146/annurev.nutr.25.050304.0 92557
51. van Trijp HC, van der Lans IA. Consumer perceptions of nutrition and health claims. Appetite. 2007; 48(3):305-24. http://dx.doi.org/10.1016/j.appet.20 06.09.011
52. Cowburn G, Stockley L. Consumer understanding and use of nutrition labelling: A systematic review. Public Health Nutr. 2005; 8(1):21-8. http://dx. doi.org/10.1079/PHN2004666
53. Lai Yeung WL. Gender perspectives on adolescent eating behaviors: A study on the eating attitudes and behaviors of junior secondary students in hong kong. J Nutr Educ Behav. 2010; 42(4):250-8. http:// dx.doi.org/10.1016/j.jneb.2009.05.008
54. Clark JE. Taste and flavour: Their importance in food choice and acceptance. Proc Nutr Soc. 1998; 57(4):639-43.
55. Shannon C, Story M, Fulkerson JA, French SA. Factors in the school cafeteria influencing food choices by high school students. J Sch Health. 2002; 72(6):229-34.
56. Croll JK, Neumark-Sztainer D, Story M. Healthy eating: What does it mean to adolescents? J Nutr Educ. 2001; 33(4):193-8.
57. Story M, Kaphingst KM, Robinson-O’Brien R, Glanz K. Creating healthy food and eating environments: Policy and environmental approaches. Annu Rev Public Health. 2008; 29:253-72. http://dx.doi.org/ 10.1146/annurev.publhealth.29.020907.090926