FREE THEMES
1 Departamento de Educação Física, Centro de Desportos, Universidade Federal de Santa Catarina. Campus Universitário, Trindade. 88040-900 Florianópolis SC Brasil. [email protected] 2 Departamento de Educação Física, Universidade Federal do Paraná.
3 Grupo de Pesquisa em Atividade Física e Saúde na Escola. Instituto de Educação Física e Esportes. Universidade Federal do Ceará.
Isolated and combined presence of elevated anthropometric
indices in children: prevalence and sociodemographic correlates
Abstract This study analyzed the prevalence and sociodemographic factors associated to the isolat-ed and combinisolat-ed presence of elevatisolat-ed anthropo-metric indices among children. A cross-sectional study was performed with 2,035 children (aged 6-11 years, 50.1% of girls) who were randomly selected in schools from Colombo, Brazil. Body Mass Index (BMI), Waist Circumference (WC) and Waist-to-Height Ratio (WHtR) were clas-sified using reference values. Age, gender, type of school, shift, and residence area were potential risk factors. Binary logistic regression was used (p < 0.05). The prevalence of children with isolated presence of elevated BMI, WHtR or WC was ob-served in 9.4% (confidence interval [CI] of 95%: 3.3; 15.7), 8.7% (CI 95%: 1.7; 15.9) and 4.4% (CI 95%: 1.0; 7.9), 8.7% of children, respectively. The presence of one or more elevated anthropo-metric index was observed in 16.9% (CI 95%: 5.4; 28.5) of children. Boys (BMI), younger children (WC) and children from public schools (BMI, WC or WHtR) were high-risk subgroups to the isolated presence of elevated anthropometric indi-ces. Children from public schools and rural areas were high-risk subgroup to the combined presence of elevated anthropometric indices. In conclusion, Public policies to combat childhood obesity may be more effective whether they targeted at children from public schools and rural areas.
Key words Obesity, Cross-sectional study, Child
health, Risk factors
Valter Cordeiro Barbosa Filho 1
Wagner de Campos 2
Ricardo Rosa Fagundes 2
Adair da Silva Lopes 1
B
ar
b
osa
Filho V
Introduction
Obesity is a serious public health problem, which has been recognized since the late 1990s1, but obesity rates have grown in various locations, speciically in developing countries and young-er ages2,3. For example, the prevalence rates of general obesity exceed 10% among children aged 5–9 years in Brazil4. Additionally, central obesity (excessive fat accumulation in the central region of the body) has also grown in children from dif-ferent countries5,6.
Different anthropometric indices have been used to identify the presence of general (especial-ly, body mass index [BMI]) or centralized (e.g., waist circumference [WC], and waist-to-height ratio [WHtR]) obesity1,7,8. BMI is an example of an indicator of general obesity that is often used in clinical and epidemiological practice due to easy application, low cost and good screening of cardiovascular risk factors (e.g., high blood pressure and hyperglyceridemia) in children1,7. WC represents the accumulation of abdominal fat and can predict cardiovascular risk as well as or even better than BMI8,9. Other studies have highlighted that WHtR is an important indica-tor of central obesity in children, and it increases the prediction of cardiovascular risk when com-bined with BMI classiication10,11. Therefore, the diagnosis of obesity based on the combination of these anthropometric indices can provide a more reliable estimate of the cardiovascular risk among children9,10.
Although Brazilian literature often discuss-es the epidemiology of general obdiscuss-esity among adolescents12,13, assessing the presence of central obesity in Brazilian children requires more re-search14. Additionally, epidemiological studies with children have used only one anthropomet-ric index to identify obesity15-17. Therefore, stud-ies that include children to assess the presence of general and central obesity are encouraged. Finally, the association between sociodemo-graphic factors (such as gender, age, living area or school system) with the general15,16,18-20 and central15,17,18,21-24 obesity in children and adoles-cents has been researched, but the association between sociodemographic factors and the com-bined presence of general and central obesity is unknown. Studies in this direction are important for indicating whether there are differences in the child subgroups regarding a higher risk of having
different manifested forms of obesity – general or abdominal obesity, or a combination of these two. This evidence may help to target public strategies to combat childhood obesity.
In this perspective, this study aimed to identi-fy the isolated and combined presence of elevated anthropometric indices (BMI, WC and WHtR), and the sociodemographic factors associated with these conditions among children of a Bra-zilian municipality.
Method
Population and sample
This cross-sectional study was conducted in the city of Colombo, Parana, southern Brazil, which is located in the metropolitan area of Curi-tiba and has a Human Development Index (HDI, 2010) of 0.733, which is 73rd in the Parana state. In 2010, the city of Colombo had 27,000 children regularly enrolled from 1st to 5th grades in pub-lic and private elementary schools. This was the study population. Data collection was conducted from March to September 2012.
The following statistical parameters were adopted to calculate the sample size: (i) a coni-dence level of 95%; (ii) a sampling error of three percentage points; (iii) a prevalence of the out-come of interest (at least one indicator of obesi-ty) of 50.0%, which considers a maximum vari-ance and overestimates the sample size; and (iv) a design effect of 2.025. Based on these parameters, the minimum sample size of the study was esti-mated to be 1,978 children. A margin of about 20% for possible losses and refusals during data collection was added. Therefore, the sample was estimated to be 2,400 children.
vis-aúd
e C
ole
tiv
a,
21(1):213-224,
2016
ited (seven from public schools in urban areas, two public and ive in rural areas of the private network), for a total of 138 classes.
Children without informed consent (IC), who refused to participate in the study or who were outside the age range of interest (6–11 years old) were not evaluated or were excluded from the inal sample.
The estimate of the statistical power of the sample was performed a posteriori, considering the conidence level of 95% ( = 0.05) and 80% power ( = 0.20). With a inal sample of 2,035 teenagers, it was possible to detect statistical sig-niicance for odds ratios > 1.36 as risk and < 0.64 as protection for elevated BMI> 1.53 as risk and <0.47 as protection for elevated WC, > 1.42 as risk and < 0.58 as protection for elevated WHtR, and > 1.30 as risk and <0.70 as protection for the combination of elevated anthropometric indices. In these calculations, we used the prevalence of 9.2%, 4.2%, 7.7%, and 16.5% for non-exposed groups with elevated BMIs, WCs, or WHtRs, and the combination of elevated anthropometric in-dices, respectively.
Instruments and procedures
Data collection was based on anthropometric measures (weight, height and WC). The children were initially organized in the reserved room for anthropometric assessment. Each child was assessed individually, aiming to minimize con-straints. All measurements were performed by a single experienced evaluator. Two scholars of Physical Education assisted in recording the an-thropometric data.
The materials used in this study were: a tape measure (scale of 0.1 cm, Easyread® brand and Cateb model) ixed on a lat wall with no base-board to determine height; a digital scale (resolu-tion of 100 g and capacity of 150 kg, Wiso® model and W903 brand) to measure body mass; and a metal tape (scale of 0.1 cm, Cescorf® brand) to measure WC. Height and body mass were mea-sured according to standards proposed by Gor-don et al.26. Height was measured without shoes, heels together and head oriented to the Frankfurt plane.
To determine body mass, the children were evaluated in a standing position, without shoes and wearing their Physical Education uniform. Body mass and height were used to calculate
BMI (kg/m²). The z-score of BMI for children, speciic for gender and age, was calculated us-ing the World Health Organization’s ANTHRO Plus program (Centers for Disease Control and Prevention, Atlanta, USA). Children with BMI z-score values equal to or greater than two were considered to have elevated BMIs7.
WC was measured with the children stand-ing, with a relaxed abdomen, arms lateral along the body, and body weight distributed equally on both legs. The tape was placed horizontally at the midpoint between the lower border of the last rib and the iliac crest27. Two measurements were ob-tained from each child and the average of the two was calculated (intraclass correlation coeficient = 0.99). Subsequently, WC was classiied accord-ing to speciic cutoff points for gender and age, as proposed by Fernández et al.28. The 90th per-centile for age and gender determined elevated WC28. Finally, WHtR was obtained by calculating the ratio of WC and height8. WHtR less than 0.50 was considered elevated10.
The isolated presence of elevated anthropo-metric indices was analyzed considering BMI, WC, and WHtR separately. To analyze the com-bined presence of elevated anthropometric in-dices, a new variable was created to record the amount of elevated anthropometric indices of each child (none, one, two or three). In explor-atory analyses, the outcome was analyzed as whether or not there was at least one elevated an-thropometric index (BMI, WC, and/or WHtR).
Age was calculated as the difference between the date of birth and date of collection. During the analysis of the explanatory variables, children were grouped into three age groups: 6–7, 8–9 and 10–11 years. The variables gender (male and fe-male), school system (public or private), study shift (morning or afternoon), grades (1st, 2nd, 3rd, 4th or 5th) and living area (urban or rural) were determined according with the information passed on by the school administration and the school.
Data analysis
anthro-B
ar
b
osa
Filho V
pometric variables). Student’s t-test for indepen-dent samples was used to compare continuous variables between genders. The chi-square test for heterogeneity or linear trends, as appropriate, was used to identify possible discrepancies be-tween genders in the distribution of categorical variables (age, type of school, turn series, housing zone). The 95% conidence interval (95% CI) was calculated for the isolated (BMI, WC and WHtR analyzed separately) and combined (pooled BMI classiication, WC and WHtR) prevalence of high anthropometric indices, separately by gender.
Crude and adjusted logistic regression mod-els were used to identify factors associated (gen-der, age, school system, shift, number, and hous-ing zone) with the isolated or combined presence of elevated anthropometric indices among chil-dren. The crude and adjusted odds ratios, as well as their respective 95% Cis, were calculated. All variables were entered simultaneously in a mul-tivariate regression model, independent of the p-value of the crude analysis. The level of signif-icance was set at 5% (p < 0.05) for the inal anal-ysis. Statistical procedures for complex samples were included in all analyses by adding the preix “svyset” to ponder stratum, conglomerates and sample weights using the software STATA version 11 (Stata Corp., College Station, TX, USA).
Ethical aspects
The study was approved by the Ethics Com-mittee of the Federal University of Parana, fol-lowing the norms of the National Health Council (Resolution 196/96). All children received per-mission from parents/guardians to participate in the study.
Results
The selection process resulted in 2,750 children who were invited to participate in this study. Of these, 20.0% did not return the informed con-sent form signed by parents/guardians and 6% refused to participate in the study. A child was excluded from the inal sample because he was 15 years old. There was no sample loss due to in-complete data. Thus, the inal sample consisted of 2,035 children (1,016 boys and 1,019 girls). The proportion of the population represented by this sample was 11.6%, 12.2%, 11.3%, 14.9% and
13.3% for children from 1st, 2nd, 3rd, 4th, and 5th grades, respectively. The average age was 8.87 years, with a standard deviation of 1.35 years.
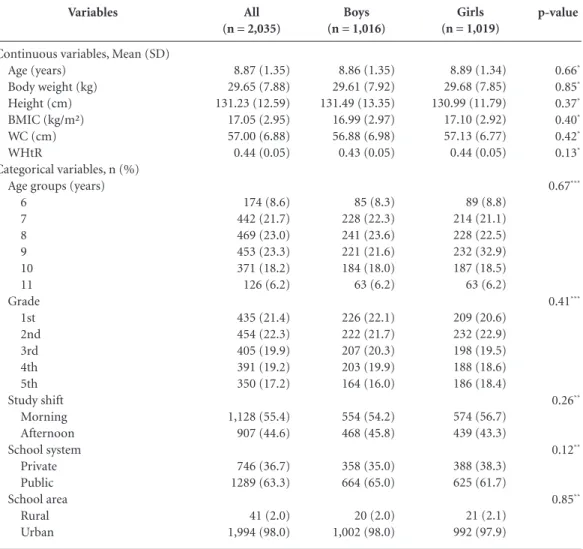
Most children were from 1st and 2nd grades (21.4% and 22.3%, respectively), were enrolled in classes in the morning period (55.4%) and attended public (63.3%) schools. Additionally, 98.0% of children were studying in schools in the urban area. There were no signiicant differenc-es between genders for the ddifferenc-escriptive variabldifferenc-es studied (p > 0.05, Table 1).
Figures 1A and 1B show the prevalence and 95% isolated and combined presence of elevated anthropometric indices between boys and girls. The prevalence of these indices was similarly present between genders (there was an overlap of 95% CIs). The elevated BMI was present in 9.4% (95% CI: 3.3, 15.7) of children. The elevated WHtR was observed in 8.7% (95% CI: 1.7, 15.9) of children, while 4.4% (95% CI: 1.0, 7.9) had el-evated WCs.
The presence of at least one elevated anthro-pometric index (BMI, WC, and/or WHtR com-bined) was observed in 16.9% (95% CI: 5.4, 28.5) of children. However, the accumulation of two or three elevated anthropometric indices was less than 5% in both boys and girls (Figure 1B).
In the crude analysis, gender and school sys-tem were associated with elevated BMI among children. The odds ratios remained signiicant after adjusting for other independent variables (p < 0.05). After adjusting for confounders, girls and children from private schools had lower odds ratios for having elevated BMIs (Table 2).
The age group and the school system were factors associated with elevated WC among chil-dren, both in crude and adjusted analyses. Eight and nine-year-olds had lower odds ratios for having elevated WCs when compared to children aged six and seven years. Children from private schools had a lower odds ratio for having ele-vated WCs in comparison with their peers from public schools (Table 3).
The age group and the school system were as-sociated with elevated WHtRs in the crude anal-ysis. In the adjusted analysis, only the school sys-tem remained associated with high WHtRs. Chil-dren from private school had a 90% lower odds ratio for having elevated WHtRs in comparison to their peers from public schools (Table 3).
aúd
e C
ole
tiv
a,
21(1):213-224,
2016
or WHtR combined), the crude and adjusted analyses showed that school system and resi-dence area were signiicantly associated with the combined presence of elevated anthropometric indices (p<0.05). Private school children had a lower odds ratio for the combined presence of el-evated anthropometric indices. In contrast, rural children had a higher odds ratio for having the combined presence of elevated anthropometric indices in comparison to their peers from urban areas (Table 4).
Discussion
This study identiied the prevalence of isolated anthropometric indices in around 10% of chil-dren in Colombo, Brazil. These were lower prev-alence rates in comparison to those found in oth-er pediatric populations when considoth-ering the isolated presence of elevated BMI4,15,16,18 (ranging from 19.2%15 to 32.0%4), WC17,18,21 (ranging from 10.9%21 to 30%17), or WHtR15-18,21 (ranging from 11.9%16 to 18.3%21). This evidence indicated that, while the isolated presence of some
elevat-p-value
0.66*
0.85*
0.37*
0.40*
0.42*
0.13*
0.67***
0.41***
0.26**
0.12**
0.85**
Variables
Continuous variables, Mean (SD) Age (years)
Body weight (kg) Height (cm) BMIC (kg/m²) WC (cm) WHtR
Categorical variables, n (%) Age groups (years)
6 7 8 9 10 11 Grade
1st 2nd 3rd 4th 5th Study shift
Morning Afternoon School system
Private Public School area
Rural Urban
All (n = 2,035)
8.87 (1.35) 29.65 (7.88) 131.23 (12.59) 17.05 (2.95) 57.00 (6.88) 0.44 (0.05)
174 (8.6) 442 (21.7) 469 (23.0) 453 (23.3) 371 (18.2) 126 (6.2)
435 (21.4) 454 (22.3) 405 (19.9) 391 (19.2) 350 (17.2)
1,128 (55.4) 907 (44.6)
746 (36.7) 1289 (63.3)
41 (2.0) 1,994 (98.0)
Table 1. Characteristics of the sample. Colombo, Parana, Brazil (2012
Boys (n = 1,016)
8.86 (1.35) 29.61 (7.92) 131.49 (13.35) 16.99 (2.97) 56.88 (6.98) 0.43 (0.05)
85 (8.3) 228 (22.3) 241 (23.6) 221 (21.6) 184 (18.0) 63 (6.2)
226 (22.1) 222 (21.7) 207 (20.3) 203 (19.9) 164 (16.0)
554 (54.2) 468 (45.8)
358 (35.0) 664 (65.0)
20 (2.0) 1,002 (98.0)
Girls (n = 1,019)
8.89 (1.34) 29.68 (7.85) 130.99 (11.79) 17.10 (2.92) 57.13 (6.77) 0.44 (0.05)
89 (8.8) 214 (21.1) 228 (22.5) 232 (32.9) 187 (18.5) 63 (6.2)
209 (20.6) 232 (22.9) 198 (19.5) 188 (18.6) 186 (18.4)
574 (56.7) 439 (43.3)
388 (38.3) 625 (61.7)
21 (2.1) 992 (97.9)
B
ar
b
osa
Filho V
ed anthropometric indices (especially BMI and WHtR) was worrisome in children of Colombo, their estimates were lower than the prevalence rates found in other locations.
The literature has shown that prevalence rates of general or central obesity could vary ac-cording to location/region2,4, which might partly explain the differences between the studies. Mul-tifactorial issues (genetic, social, behavioral, and/ or economic) may also contribute to the differ-ence in obesity estimates between populations29.
Also, the use of different classiication criteria may explain such distinctions. Barbosa Filho et al.30 found that the use of different BMI classi-ication criteria could double the prevalence of obesity in the same sample. Additionally, Moraes et al.31 observed the use of 18 different criteria for WC classiication in studies on central obesity, which makes understanding the real distinctions of this condition among child populations dif-icult. Finally, the studies included different age groups (which implies different stages of life) and adopted different sampling procedures that made it impracticable to accurately compare the prevalence rates of elevated anthropometric in-dices between studies.
The presence of at least one elevated anthro-pometric indices (BMI, WC, and/or WHtR) was observed in 16.9% of children. Studies with simi-lar estimates are rare and focused only on adoles-cents18 or only on the combined presence of WC and high WHtR21. This made the comparison impracticable.
The overall and central obesity represent-ed a risk to the children’s health9-11, especially when they were combined. Janssen et al.9 showed that the combination of elevated WC and BMI improved the prediction of cardiovascular risk factors in children, such as high blood pressure, hyperglyceridemia and hypercholesterolemia. Mokha et al.10 showed that WHtR detected not only cardiovascular risk among children with normal weight, but pointed to the lack of risk among those with overweight and obesity. Al-though the estimate of children with general and central obesity combined was low (less than 5%, see Figure 1B), combining BMI, WHtR and CC was important to indicate more precisely the pro-portion of children with health risks through the different manifestations of obesity. Boys were a subgroup associated with high BMI in this study. Systematic reviews indicated that the direction of the association between gender and general obesity (elevated BMI) might vary between stud-ies12,13. These differences might be due to behav-ioral and sociocultural variations between coun-tries/regions, so that children of a speciic gender adopted some behaviors that were obesogenic, which might not have happened in other places3. However, these differences between boys and girls were not relected when centralized obesity indi-ces (WC and WHtR) were evaluated, as observed in this study. Therefore, more studies are needed to identify the behavioral and socio-cultural me-diators of the relationship between gender and general and central obesity. Also, the distinctions
Figure 1. Prevalence and conidence interval of 95%
of the isolated (A) and combined (B) presence of elevated BMI, WC, and/or WHtR among boys and girls. Colombo, Parana, Brazil (2012).
BMI: body mass index; WC: waist circumference; WHtR: waist-to-height ratio.
A
Boys Girls
30 25 20 15 10 5 0
%
Elevated BMI (kg/m2)
Elevated WC (cm)
Elevated WHtR 11.4
7.5
4.3 4.5
7.7 9.9
B
100 80 60 40 10 0
%
0 1 3
82.4 83.6
1.1 0.7 2
Number of elevated anthropometric indices 12.7 11.6
aúd
e C
ole
tiv
a,
21(1):213-224,
2016
between countries/regions should be considered in the implementation of gender-speciic strate-gies to combat childhood obesity.
Age was inversely associated with the isolated presence of elevated WC. The higher presence of abdominal obesity common in younger children was also found in a study of Chinese children17. This result concerned the fact that the assess-ment of central obesity at younger ages has not been suficiently considered in clinical and epi-demiological practice, often due to the dificul-ty of knowing which reference values were used for the diagnosis29. Therefore, these results sup-ported the early anthropometric monitoring for centralized obesity identiication, both in clinical and public health practices.
In this study, children from public schools were a subgroup associated with elevated anthro-pometric indices – general (BMI) and central (WC and WHtR) obesity, as well as the accumu-lation of elevated anthropometric indices. This result differed from another study that showed an increased risk of general and central obesity in children from private schools20. Another wor-rying result was the largest combined presence of elevated anthropometric indices in rural
chil-dren. This inding was similar to that observed in a study of Iranian19 and South African24 children, although other studies indicated a higher preva-lence of general4,20 and central20 obesity in urban areas.
General2 and central31 obesity emerged in the poorest populations of children and developing countries, as conirmed in the above results. In families that lived in rural areas and had low i-nancial conditions (and enrolled their children in public schools), there was an increase in the acquisition and access to energy-dense foods (such as candies and soft drinks), as well as great-er access to more sedentary activities in daily living3. Unsafe neighborhoods or simply more comfortable transport alternatives (e.g., a school bus instead of walking or biking) were other as-pects that favored a sedentary lifestyle3. This sit-uation was compounded by lower coverage and more dificult access to health and primary care services among the families with lower inancial conditions3, which increased the negative impact of socio-cultural and structural changes in public health problems such as childhood obesity.
These indings have important practical im-plications, as they indicate the need to expand
Adjusted OR
(IC 95%)*
1.0 0.63 (0.50;0.81)
1.0 0.74 (0.23;2.38) 0.94 (0.37;2.43)
1.0 0.62 (0.28;1.33)
1.0 0.12 (0.05;0.25)
1.0 1.72 (0.55;5.34) Variables
Gender Boys Girls
Age groups (years) 6-7
8-9 10-11 Study shift
Morning Afternoon School system
Public Private School area
Urban Rural
n (%)
117 (11.4) 76 (7.5)
59 (9.6) 75 (8.1) 59 (11.9)
123 (10.9) 70 (7.7)
180 (14.0) 13 (1.7)
184 (9.2) 9 (22.0)
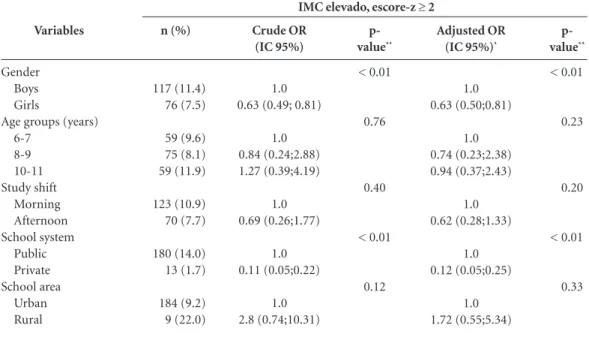
Table 2. Factors associated with elevated body mass index among children. Colombo, Parana, Brazil (2012).
Crude OR (IC 95%)
1.0 0.63 (0.49; 0.81)
1.0 0.84 (0.24;2.88) 1.27 (0.39;4.19)
1.0 0.69 (0.26;1.77)
1.0 0.11 (0.05;0.22)
1.0 2.8 (0.74;10.31)
p-
value**
< 0.01
0.76
0.40
< 0.01
0.12
BMI: body mass index; OR (IC 95%): odds ratio ad conidence interval of 95%. * Odds ratio and CI 95% adjusted to other independent variables. ** P-values obtained using binary logistic regression with crude and adjusted models.
p-
value**
< 0.01
0.23
0.20
< 0.01
0.33
B
ar
b
osa
Filho V
policies that combat childhood obesity to cover populations in rural areas and those attending public schools.
Some strengths can be highlighted in this study. First, the representativeness of the sample, as children were selected from different regions (urban and rural) and education systems (public
or private), allowed for the analysis to be extrap-olated to the pediatric population of the mu-nicipality. Another strong point was the use of three different anthropometric indices of obesi-ty, which contributed to the diagnosis of general and centralized obesity in children as well as their potential sociodemographic correlates. Finally, it
Table 3. Factors associated with elevated waist circumference and waist-to-height ratio among children.
Colombo, Parana, Brazil (2012).
WC: waist circumference; WHtR: waist-to-height ratio; OR (IC 95%): odds ratio and conidence interval of 95%. * Odds ratio and CI 95% adjusted to other independent variables. ** P-values obtained using binary logistic regression with crude and adjusted models.
Adjusted OR
(IC 95%)*
1.0 1.07 (0.87; 1.52)
1.0 0.54 (0.32; 0.90) 1.10 (0.59; 2.05)
1.0 0.63 (0.34; 1.15)
1.0 0.11 (0.05; 0.28)
1.0 2.61 (0.41; 9.35) Variables
Gender Boys Girls
Age groups (years) 6-7 8-9 10-11 Study shift Morning Afternoon School system Public Private School area Urban Rural n (%) 44 (4.3) 46 (4.5) 40 (6.5) 26 (2.8) 24 (4.8) 54 (4.8) 36 (4.0) 84 (6.5) 6 (0.8) 83 (4.2) 7 (17.1) Crude OR (IC 95%) 1.0 1.05 (0.61; 1.83)
1.0 0.41(0.24; 0.73) 0.73 (0.42; 1.25)
1.0 0.82 (0.41; 1.62)
1.0 0.12 (0.04; 0.28)
1.0 4.74 (0.61; 9.99)
p- value** 0.83 0.02 0.54 < 0.01 0.13 p- value** 0.75 0.02 0.12 < 0.01 0.28
Elevated WC, ≥ 90th
Adjusted OR
(IC 95%)*
1.0 0.83 (0.58; 1.19)
1.0 0.84 (0.49; 1.45) 1.39 (0.96; 2.00)
1.0 0.88 (0.45; 1.72)
1.0 0.09 (0.02; 0.33)
1.0 2.45 (0.50; 11.92) Variables
Gender Boys Girls
Age groups (years) 6-7 8-9 10-11 Study shift Morning Afternoon School system Public Private School area Urban Rural n (%) 79 (7.7) 100 (9.9) 58 (9.4) 74 (8.0) 47 (9.5) 101 (9.0) 78 (8.6) 169 (13.1) 10 (1.3) 168 (8.4) 11 (26.8) Crude OR (IC 95%) 1.0 1.31 (0.91; 1.88)
1.0 0.84 (0.55; 0.73) 1.00 (0.73; 1.39)
1.0 0.96 (0.52; 1.76)
1.0 0.10 (0.03; 0.31)
1.0 3.99 (0.79;10.12) p- value** 0.13 0.57 0.88 < 0.01 0.09 p- value** 0.08 0.30 0.70 < 0.01 0.24
aúd
e C
ole
tiv
a,
21(1):213-224,
2016
is important to highlight the evaluation of po-tential factors associated with the simultaneous presence of anthropometric indices of obesity; an analysis with little evidence in the literature.
This study also has limitations. The irst, based on the study sample evaluated in a Brazilian city, makes it impossible to extrapolate these results to children elsewhere. Another limitation refers to the use of anthropometric indices rather than objective measures (e.g., DXA or plethysmogra-phy), in the estimation of body fat in children. However, these indices have high precision and are important clinical and epidemiological tools when evaluating general obesity and abdominal identiication in children8. Finally, although it is a criterion commonly used in Brazilian studies13,14, the cutoff points proposed by Fernandéz et al.28 were based on the WC percentile of American children and adolescents, and may not adequate-ly relect the presence of abdominal obesity in Brazilian children.
Conclusion
Overall, prevalence rates for elevated anthropo-metric indices (BMI, WC, or WHtR) ranged from 4.4% (elevated WC) to 9.4% (elevated BMI). However, about two in 10 children had at least a high anthropometric index. Being a female or an older child was associated with a lower odds ratio for having an elevated BMI and WC, respec-tively. However, children from public schools had higher odds ratios for the isolated presence of el-evated BMI, WC, and WHtR; the public school system and rural residence were positively asso-ciated with the accumulation of elevated anthro-pometric indices.
These indings suggest that, for some popu-lations, the vulnerable context and living in areas far from urban centers may worsen the factors as-sociated with general and central obesity. Public policies for child health in this region must direct their attention to these peculiarities. Promoting
Adjusted OR
(IC 95%)*
1.0 0.96 (0.75; 1.22)
1.0 0.78 (0.50; 1.21) 0.95 (0.61; 1.48)
1.0 0.77 (0.58; 1.02)
1.0 0.10 (0.05; 0.18)
1.0 1.90 (1.02; 3.54) Variables
Gender Boys Girls
Age groups (years) 6-7
8-9 10-11 Study shift
Morning Afternoon School system
Public Private School area
Urban Rural
n (%)
179 (17.5) 166 (16.4)
107 (17.4) 138 (15.0) 100 (20.1)
204 (18.1) 141 (15.5)
322 (25.0) 23 (3.1)
329 (16.5) 16 (39.0)
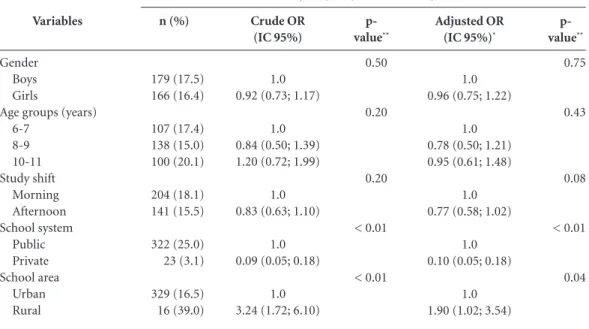
Table 4. Factors associated with the combined presence of elevated anthropometric indices among children.
Colombo, Parana, Brazil (2012).
Crude OR (IC 95%)
1.0 0.92 (0.73; 1.17)
1.0 0.84 (0.50; 1.39) 1.20 (0.72; 1.99)
1.0 0.83 (0.63; 1.10)
1.0 0.09 (0.05; 0.18)
1.0 3.24 (1.72; 6.10)
p-
value**
0.50
0.20
0.20
< 0.01
< 0.01
BMI: body mass index; WC: waist circumference; WHtR: waist-to-height ratio. OR (IC 95%): odds ratio and conidence interval of 95%. * Odds ratio and CI 95% adjusted to other independent variables. ** P-values obtained using binary logistic regression with crude and adjusted models.
p-
value**
0.75
0.43
0.08
< 0.01
0.04 Combined presence of elevated anthropometric indices
B
ar
b
osa
Filho V
a positive school community, children’s healthy eating and an active lifestyle can be promising strategies for health promotion and obesity pre-vention in this population.
Collaborations
aúd
e C
ole
tiv
a,
21(1):213-224,
2016
References
World Health Organization (WHO). Obesity: Preven-ting and managing the global epidemic. Geneva: WHO; 2000.
De Onis M, Blössner M, Borghi E. Global prevalence and trends of overweight and obesity among preschool children. Am J Clin Nutr 2010; 92(5):1257-1264. Dinsa G, Goryakin Y, Fumagalli E, Suhrcke M. Obesity and socioeconomic status in developing countries: A systematic review. Obes Rev 2012; 13(11):1067-1079. Instituto Brasileiro de Geograia e Estatística (IBGE). Pesquisa de Orçamentos Familiares: Antropometria e estado nutricional de crianças, adolescentes e adultos no Brasil. Rio de Janeiro: IBGE; 2010.
Garnett SP, Baur LA, Cowell CT. The prevalence of in-creased central adiposity in Australian school children 1985 to 2007. Obes Rev 2011; 12(11):887-896. McCarthy H, Jarrett K, Emmett P, Rogers I. Trends in waist circumferences in young British children: A com-parative study. Int J Obes 2005; 29(2):157-162. World Health Organization (WHO). Growth reference data for 5-19 years. Geneva: WHO; 2007.
World Health Organization (WHO). Waist circumfe-rence and waist-hip ratio: Report of a WHO expert con-sultation. Geneva: WHO; 2008.
Janssen I, Katzmarzyk PT, Srinivasan SR, Chen W, Malina RM, Bouchard C, Berenson GS. Combined in-luence of body mass index and waist circumference on coronary artery disease risk factors among children and adolescents. Pediatr 2005; 115(6):1623-1630. Mokha JS, Srinivasan SR, DasMahapatra P, Fernandez C, Chen W, Xu J, Berenson GS. Utility of waist-to-hei-ght ratio in assessing the status of central obesity and related cardiometabolic risk proile among normal weight and overweight/obese children: The bogalusa heart study. BMC Pediatr 2010;10:73.
Adair L, Gordon Larsen P, Du S, Zhang B, Popkin B. The emergence of cardiometabolic disease risk in chi-nese children and adults: Consequences of changes in diet, physical activity and obesity. Obes Rev 2014; 15(Supl. 1):49-59.
Araújo VC, Konrad LM, Rabacow FM, Graup S, Ambo-ni R, Farias JúAmbo-nior JC. Prevalência de excesso de peso em adolescentes brasileiros: Um estudo de revisão sis-temática. Rev Bras Ativ Fís Saúde 2012; 12(3):79-87. Tassitano RM, Tenório MCM, Hallal PC. Revisão sis-temática sobre obesidade em adolescentes brasilei-ros. Rev Bras Cineantropom Desempenho Hum 2009; 11(4):449-456.
Cavalcanti CB, Carvalho SC, Barros MVG. Indicadores antropométricos de obesidade abdominal: revisão dos artigos indexados na biblioteca Scielo. Rev Bras Cinean-tropom Desempenho Hum 2009; 11(2):217-225. Rafraf M, Mohamadi E, Gargari B. Prevalence of ove-rall and abdominal obesity among adolescent high school girls in Tabriz, Iran. Int Med J Malaysia 2013; 12(1):27-32.
Ricardo GD, Gabriel CG, Corso ACT. Anthropometric proile and abdominal adiposity of school children aged between 6 and 10 years in southern Brazil. Rev Bras Cineantropom Desempenho Hum 2012; 14(6):636-646.
1.
2.
3.
4.
5.
6.
7. 8.
9.
10.
11.
12.
13.
14.
15.
16. Acknowledgments
B
ar
b
osa
Filho V
Xiong F, Garnett SP, Cowell CT, Biesheuvel C, Zeng Y, Long C-L, Wang Q, Wang D-G, Luo Y-H, Luo S-Q. Waist circumference and waist-to-height ratio in Han Chinese children living in Chongqing, south-west Chi-na. Public Health Nutr 2011; 14(1):20-26.
Pinto ICS, Arruda IKG, Diniz AS, Cavalcanti AMT. Pre-valência de excesso de peso e obesidade abdominal, se-gundo parâmetros antropométricos, e associação com maturação sexual em adolescentes escolares. Cad Saude Publica 2010; 26(9):1727-1737.
Maddah M, Nikooyeh B. Obesity among Iranian ado-lescent girls: Location of residence and parental obesi-ty. J Health Popul Nutr 2010; 28(1):61-66.
Misra A, Shah P, Goel K, Hazra DK, Gupta R, Seth P, Tallikoti P, Mohan I, Bhargava R, Bajaj S. The high bur-den of obesity and abdominal obesity in urban Indian schoolchildren: A multicentric study of 38,296 chil-dren. Ann Nutr Metab 2011; 58(3):203-211.
Bamoshmoosh M, Massetti L, Aklan H, Al-Karewany M, Al Goshae H, Modesti PA. Central obesity in Yeme-ni children: A population based cross-sectional study. World J Cardiol 2013; 5(8):295-304.
Pedroni JL, Rech RR, Halpern R, Marin S, Roth LR, Sir-toli M, Cavalli A. Prevalência de obesidade abdominal e excesso de gordura em escolares de uma cidade serrana no sul do Brasil. Cien Saude Colet 2013; 18(5):1417-1425.
Silva DAS, Pelegrini A, Silva AF, Grigollo LR, Petroski EL. Obesidade abdominal e fatores associados em ado-lescentes: comparação de duas regiões brasileiras di-ferentes economicamente. Arq Bras Endocrinol Metab 2012; 56(5):291-299.
Toriola A, Moselakgomo V, Shaw B, Goon D, Anyanwu F. Are rural south african children abdominally obese? Pak J Med Sci 2013; 29(3):740-743.
Luiz R, Magnanini M. The logic of sample size deter-mination in epidemiological research. Cad Saúde Colet 2000; 8(2):9-28.
17.
18.
19.
20.
21.
22.
23.
24.
25.
Gordon C, Chumlea W, Roche A. Stature, recumbent length, and weight. In: Lohman TG, Martorell R, ed. Anthropometric standardization reference manual. Champaign: Human kinetics Books. 1988:3-8.
Callaway CW, Chumlea WC, Bouchard C, Himes JH, Lohman TG, Martin AD, Mitchell CD, Mueller WH, Roche AF, Seefeldt VD. Circumferences. In: Lohman TG, Martorell R, editors. Anthropometric standardiza-tion reference manual. Champaign: Human Kinetics Books; 1988. p. 39-54.
Fernández JR, Redden DT, Pietrobelli A, Allison DB. Waist circumference percentiles in nationally represen-tative samples of African-American, European-Ameri-can, and Mexican-American children and adolescents. J Pediatr 2004; 145(4):439-444.
Barbosa Filho VC, Campos W, Fagundes RR, Lopes AS. Anthropometric indices among schoolchildren from a municipality in southern Brazil: A descriptive analy-sis using the LMS method. Rev Paulista Pediatr 2014; 32(4):333-341.
Barbosa Filho VC, Quadros TMB, Souza EA, Gordia AP, Campos W. A utilização do critério da Organização Mundial de Saúde para classiicação do estado nutri-cional em crianças. Motr Rev Educ Fís 2010; 16(4):811-819.
Moraes AC, Fadoni R, Ricardi L, Souza T, Rosaneli C, Nakashima A, Falcão M. Prevalence of abdominal obe-sity in adolescents: A systematic review. Obes Rev 2011; 12(2):69-77.
Article submitted 27/04/2014 Approved 15/04/2015
Final version submitted 17/04/2015 26.
27.
28.
29.
30.