Wilfried Dinh, Reiner Füth, Mark Lankisch, Georg Hess, Dietmar Zdunek, Thomas Scheffold, Frank Kramer, Rolf
Michael Klein, Michael Coll Barroso, Werner Nickl
Institute for Heart and Circulation Research, University Witten/Herdecke - Germany; Helios Clinics Wuppertal, Department of Cardiology, Wuppertal - Germany; CoroVital, Institute for Sports Medicine, Wuppertal - Germany; Universität Mainz, Medical department,
Langenbeckstrasse 1, Mainz - Germany; Roche Diagnostics, Forrenstrasse in CH Rotkreuz - Switzerland; Institut für Herzinfarktforschung Ludwigshafen (IHF) - Germany; Global Biomarker Research, Bayer Schering Pharma, Wuppertal - Germany; Augusta Hospital Düsseldorf, Department of Cardiology, Düsseldorf - Germany
Mailing address: Wilfried Dinh •
Arrenberger Street, 20 - 42113 - Wuppertal - NRW E-mail: [email protected], [email protected]
Manuscript received October 06, 2010, revised manuscript received Decem-ber 15, 2010, accepted January 03, 2011.
Abstract
Background: Growth differentiation factor-15 (GDF-15), a stress-responsive transforming growth factor-ß-related cytokine, is elevated and independently related to an adverse prognosis in systolic heart failure.
Objective: This study aimed to investigate plasma levels of GDF-15 in patients with preclinical diastolic dysfunction or heart failure with normal ejection fraction (HFnEF).
Methods: We evaluated 119 patients with normal ejection fraction referred for an elective coronary angiography, 75
(63%) of whom had coronary artery disease. Subjects were classified as having either mild left ventricular diastolic dysfunction (LVDD grade I, n = 61), HFnEF (LVDD grade II or III, n = 38) or normal diastolic function (controls, n = 20). In a subgroup of 20 subjects, changes in cardiac output (CO) were measured by inert gas rebreathing (InnocorTM) in response to an orthostatic hemodynamic test.
Results: Growth differentiation factor-15 levels in HFnEF [median 1.08, interquartile range (0.88-1.30) ng/ml] were significantly higher than in controls [0.60 (0.50-0.71) ng/ml, p = 0.003] and in patients with LVDD grade I [0.78 (0.62-1.04) ng/ml, p < 0.001]. In addition, GDF-15 was significantly elevated in patients with LVDD grade I compared to controls (p = 0.003). Furthermore, GDF-15 was correlated with echocardiographic markers of diastolic dysfunction and was correlated with the magnitude of CO response to the change in body position from standing to supine (r = -0.67, p = 0.005).
Conclusion: Growth differentiation factor-15 levels are elevated in subjects with HFnEF and can differentiate normal
diastolic function from asymptomatic LVDD. In addition, GDF-15 is associated with a reduced cardiac output response in the orthostatic hemodynamic test. (Arq Bras Cardiol. 2011; [online].ahead print, PP.0-0)
Keywords: Growth differentiation factor 15; heart failure; stroke volume; ventricular dysfunction.
Introduction
Nearly half of the patients presenting with symptoms and signs of heart failure have a normal ejection fraction (EF)1,2, a
condition termed “heart failure with normal ejection fraction (HFnEF)”. Recent data suggest that overall mortality due to HFnEF is equivalent to that of systolic heart failure (SHF)1,2. In
the general population, asymptomatic left ventricular diastolic dysfunction (LVDD), which is considered as a precursor of HFnEF3, is a powerful and independent predictor of death4.
Nevertheless, clinical trials in HFnEF have been frequently disappointing, including those with drugs approved for SHF5-7. Notwithstanding the same overall mortality, this is
at least in part due to the lower proportion of heart failure-related death in the overall population of patients with HFnEF8. The discrepancies in mortality rates from heart
failure-related deaths may be attributed to the considerable heterogeneity among patients with HFnEF, which can be explained by the use of different recruitment criteria9 or
the complexity of echocardiographic diagnosis. Even though a specific guideline has been proposed recently by the American Society of Cardiology10, establishing this medical
condition is difficult in clinical practice. Echocardiography can be misleading or inconclusive and will not always be sufficient to establish the diagnosis. Better characterization of patients with HFnEF at greatest risk for heart failure-related complications and death could allow more effective use of specific interventions.
Growth differentiation factor 15 (GDF-15) is a member of the transforming growth factor ß (TGF-ß) cytokine super-family and was first cloned as macrophage-inhibitory cytokine-111. Previous
studies have shown that patients with SHF have increased circulating levels of GDF-1512, and it has been demonstrated
that GDF-15 provides prognostic information beyond that established by clinical and biochemical risk factors13,14.
The aim of the present study was to test the diagnostic value of GDF-15 in identifying patients with preclinical, asymptomatic LVDD or HFnEF. Moreover, we analyzed the association of GDF-15 levels to different preload conditions.
Methods
One hundred-nineteen consecutive subjects referred to elective coronary angiography for stable or suspected coronary artery disease (CAD) or diagnostic workup of heart failure were enrolled in the study. Patients that needed coronary revascularization with either angioplasty or coronary bypass surgery were not enrolled in the study. The protocol was approved by the local Ethics Committee, and signed informed consent was obtained from all patients. Exclusion criteria were left ventricular EF < 50%, known CAD with progressive chest pain within the last month, coronary angioplasty or myocardial infarction < 6 weeks, hypertrophic cardiomyopathy, moderate-to-severe valvular heart disease, uncontrolled hypertension, atrial fibrillation or other severe arrhythmias, or serum-creatinine > 2,0 mg/dl. In patients without diabetes, a standardized oral glucose tolerance test (oGTT) was performed (75 g glucose) according to the World Health Organization protocol as previously described15. Body
mass index (BMI) was calculated as weight (kg)/height (m²).
Echocardiography
Echocardiography was performed using a standard ultrasound system (Vivid 7, General Electric, Milwaukee, Wisconsin). Left ventricular EF was measured based on the modified biplane Simpson’s method. The left atrium volume index16 was calculated using the biplane area-length method16.
Dimensions were recorded by standard techniques according to current guidelines17. Left ventricular mass index (LVMi) was
calculated by the Devereux formula indexed to the body surface area17. Conventional transmitral flow was measured
with pw-Doppler. Early (E), late atrial (A) transmitral peak flow velocities and the ratio (E/A) were measured and three consecutive beats were averaged. Pulsed wave tissue Doppler imaging (TDI) was performed at the junction of the septal and lateral mitral annulus and three consecutive beats were averaged. Early diastolic velocities (E’ medial, E’ lateral) were recorded; the mean value (E’ average) of E’ at the medial and lateral mitral annulus was determined. Ratios of E/E’ medial, E/E’ lateral and average E/E’ ratio were calculated. Diastolic dysfunction was classified according to the common consensus study by the American and European Society of Echocardiography (ASE, ESC)10.
Inert gas-rebreathing (Innocor™)
A spirometry (Innocor™ device INNO0500) was performed to exclude relevant pulmonary dysfunction. Cardiac output
(CO) was measured using an inert gas rebreathing (IGR) device (Innocor™, Innovision A/S, Denmark) in a subgroup with either normal diastolic function or asymptomatic mild LVDD (LVDD grade I, n = 10) and patients with HFnEF (LVDD grade II or III, n = 10). The method has been described in details elsewhere18 and has been validated in heart failure patients
at rest and exertion19,20. For the IGR method, O
2-enriched
test gas with 0.5% N2O (blood soluble gas) and 0.1% SF6 (blood insoluble gas) was used. The gas volume was adjusted to meet the physiological demand during rest. Use of SF6 enabled the measurement of the volume of lungs, valve and rebreathing bag. The test gas concentration was decreased during the rebreathing maneuver, with a rate proportional to pulmonary blood flow (PBF). The slope of the N20 washout kinetics correlates with PBF and CO in the absence of pulmonary shunt.
Prior to the measurements, patients were instructed on the rebreathing technique. The interval for measurements was a minimum of 3 minutes to allow complete inert gas clearance. CO was measured in different body positions as a model of ventricular load change and indexed for body surface area (BSA, COi). After 5 minutes of rest in supine position, CO was measured 3 times, and then body position was changed from supine to upright. After a three-minute period prior to the minimum period necessary to achieve a hemodynamic equilibrium, three consecutive measurements were performed. The measurements were averaged in each position.
Laboratory analysis
Blood samples were drawn at rest for the analysis of routine laboratory parameters and were stored at -80°C for later analysis. After thawing, GDF-15 was measured in plasma with a pre-commercial electrochemiluminescence immunoassay and NT-proBNP with a commercially available electrochemiluminescence immunoassay on an automated Elecsys™ analyzer (all Roche Diagnostics GmbH, Mannheim, Germany) by an investigator blinded to patient characteristics.
Statistical analysis
All analyses were performed using SPSS statistical software (SPSS 17.0, Chicago, IL). The data are presented as medians (interquartile range) for continuous variables or absolute numbers (%) for categorical variables, unless otherwise specified. Log-transformed values were used for analysis as appropriate. A p value < 0.05 was considered statistically significant. Non-parametric tests for group differences between categories were performed. We used the Kruskal-Wallis test to test the equality of medians among more than two distinct groups. The Wilcoxon-Mann-Whitney U-test was used to analyze differences between the medians of two groups and the χ2 test to evaluate differences in proportions in more than 2 sets of categorical variables. Fisher´s Test was used for the comparison of two sets of binary variables.
and logistic regression models, including most predictive variable for the dependent variables were built. Multiple linear regression analysis was applied to identify factors that were independently associated with GDF-15 levels.
Results
Patient characteristics
We included 119 patients with normal EF (66 years [59-73]) in the study (45% woman), 63% of whom had CAD without the need for revascularization. Subjects were classified as having either mild LVDD (grade I, n = 61), HFnEF (LVDD grade II or III, n = 38) or normal diastolic function (normal DF, n = 20). Patients with HFnEF were older, had a higher mean NYHA functional class, higher systolic and mean arterial blood pressure values, a lower resting heart rate and were more likely to have diabetes compared to the group with normal DF (all p < 0.005). An oGTT was performed in 80 individuals, of whom 35 (29%) had a normal glucose tolerance (NGT), 31 (26%) had impaired glucose tolerance (IGT) and 24 (20%) had newly detected diabetes. Twenty-nine patients had a history of type 2 diabetes mellitus before inclusion in the study; therefore, 53 (45%) individuals included in the study were identified as having type 2 diabetes mellitus (T2DM).Metabolic syndrome (MetS) was diagnosed in 51% of patients according to the amended National Cholesterol Education Program’s Adult Treatment Panel III (ATP-III)21. The clinical characteristics in
patients classified as to the presence or absence of LVDD or HFnEF are shown in Table 1, the laboratory data and parameters of cardiac assessment are highlighted in Table 2.
GDF-15 and diastolic function
In the whole study group, GDF-15 was significantly elevated in HFnEF patients (1.08 [0.88-1.30]) compared to those with normal diastolic function (0.60 [0.50-0.71], p < 0.001) or mild LVDD (0.78 [0.62-1.04], p < 0.001). In addition, GDF-15 plasma levels were higher in subjects with mild LVDD compared to patients with normal diastolic function (p=0.003, Figure 1). When excluding subjects with CAD, GDF-15 levels remained significantly associated with the severity of diastolic dysfunction (p < 0.001). The GDF-15 levels were closely related to the New York Heart Association (NYHA) functional class. In a multivariate lineal regression model including variables known to be associated with the presence of LVDD, age (ß = 0.456, p < 0.001) and the presence of mild LVDD or HFnEF (ß = 0.315, p = 0.001) were identified as variables predictive of higher GDF-15 levels. Female gender, the presence or absence of CAD, BMI, a history of T2DM, a previous myocardial infarction, left ventricular muscle mass and hypertension did not add significantly to the model (adjusted r2 = 0.39, p < 0.001 for overall model).
The relationship between GDF-15 quartiles and clinical echocardiographic characteristics and NT-pro-BNP levels is shown in Table 3. Increasing quartiles of GDF-15 levels were associated with a higher EF, a higher LAi, a higher E/E’ septal and E/E’ average ratio and a lower E’ septal, lateral and average E’ ratio. In addition, GDF-15 quartiles were associated with higher NT-pro-BNP levels. Particularly among the association
with echocardiographic parameters of diastolic dysfunction, GDF-15 levels were significantly increased across the LAi and the average E/E’ ratio, with both being indicative of elevated left atrial filling pressures (Figure 2a and Figure 2b). There was a weak linear correlation between the LAi (r = 0.354, p < 0.001) and the average E/E’ ratio with GDF-15 levels (r = 0.613, p < 0.001).
In contrast, the global longitudinal strain values, a very sensitive tool to detect subtle systolic dysfunction disregarding a normal EF, were not associated with GDF 15 levels. In addition, parameters of left ventricular geometry (left ventricular mass index, relative wall thickness and left ventricular end diastolic volume index) were not related to GDF-15 concentrations (Table 3).
GDF15 and hemodynamic orthostatic test
In a substudy, COi was measured with inert gas- rebreathing technique, in supine and upright body positions, as a model of ventricular load change. In subjects with HFnEF, COi was 1.96 [1.8-2.23] l/m2 in the upright position vs 1.90
[1.6-1.93] l/min in subjects with normal DF or mild LVDD. After changes in body position from upright to supine, the HFnEF group increased COi by 7% [3-16%], whereas the non HFnEF group increased COi by 28% [23-16%], p = 0.002 (Figure 3a). The COi response plotted against GDF-15 quartiles is shown in Figure 3b. GDF-15 was negatively correlated with the magnitude of COi response (r = -0.67, p = 0.005).
Discussion
Growth differentiation factor-15 plasma levels are associated with the diagnosis of HFnEF and LVDD. Furthermore, GDF-15 levels are increased with more severe grades of LVDD and can differentiate subjects with normal DF and asymptomatic LVDD. Growth factor differentiation factor-15 levels correlates with the echocardiographic criteria implemented in the current guidelines for the diagnosis and classification of LVDD. This is the first study to show an association between GDF-15 levels and cardiac output response to different preload conditions serving as a functional parameter of hemodynamic reserve.
Experimental studies have shown that GDF-15 expression significantly increases in the heart after various forms of stress, including pressure overload22,23. Animal studies have shown
that GDF-15 promotes protective, antiapoptotic and anti-hypertrophic effects in the heart23. Considering the fact that
GDF-15 is produced by several other cell types in addition to cardiomyocytes (endothelial cells, adipocytes, macrophages, vascular smooth muscle cells), it is likely that this biomarker integrates information from different disease pathways, providing a pathophysiological insight in patients with HFnEF.
The human GDF-15 promoter contains two p53 and two Egr1 consensus binding sites24. Increased expression of p53 has
been detected in the failing human myocardium, and it has been suggested that it plays a role in the transition from cardiac hypertrophy to systolic heart failure25. Erg1 is induced in
human atherosclerotic plaques26 and is a mediator of pressure
overload hypertrophy in a mice model27. Therefore, GDF-15
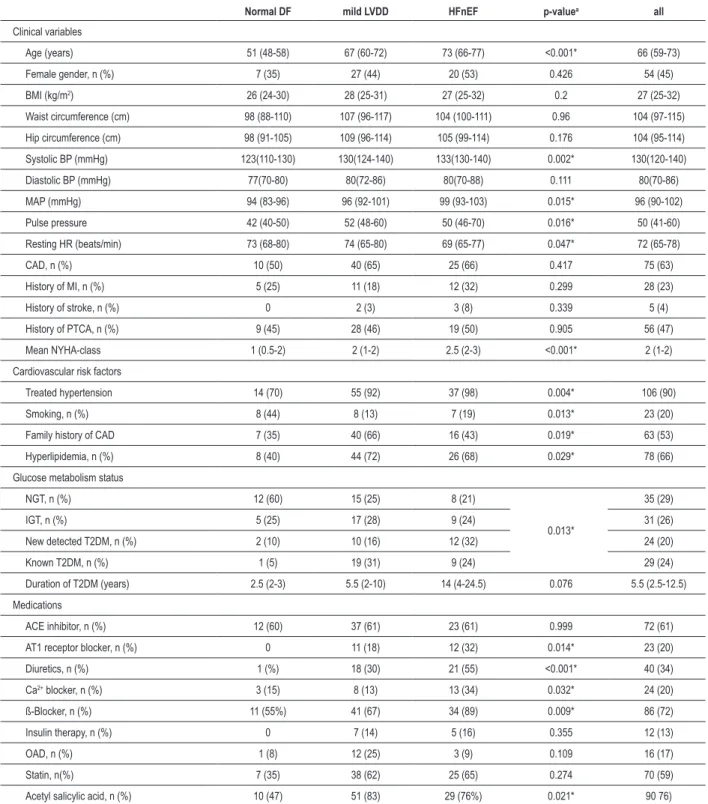
Table 1 - Clinical characteristics
Normal DF mild LVDD HFnEF p-valuea all
Clinical variables
Age (years) 51 (48-58) 67 (60-72) 73 (66-77) <0.001* 66 (59-73)
Female gender, n (%) 7 (35) 27 (44) 20 (53) 0.426 54 (45)
BMI (kg/m2) 26 (24-30) 28 (25-31) 27 (25-32) 0.2 27 (25-32)
Waist circumference (cm) 98 (88-110) 107 (96-117) 104 (100-111) 0.96 104 (97-115)
Hip circumference (cm) 98 (91-105) 109 (96-114) 105 (99-114) 0.176 104 (95-114)
Systolic BP (mmHg) 123(110-130) 130(124-140) 133(130-140) 0.002* 130(120-140)
Diastolic BP (mmHg) 77(70-80) 80(72-86) 80(70-88) 0.111 80(70-86)
MAP (mmHg) 94 (83-96) 96 (92-101) 99 (93-103) 0.015* 96 (90-102)
Pulse pressure 42 (40-50) 52 (48-60) 50 (46-70) 0.016* 50 (41-60)
Resting HR (beats/min) 73 (68-80) 74 (65-80) 69 (65-77) 0.047* 72 (65-78)
CAD, n (%) 10 (50) 40 (65) 25 (66) 0.417 75 (63)
History of MI, n (%) 5 (25) 11 (18) 12 (32) 0.299 28 (23)
History of stroke, n (%) 0 2 (3) 3 (8) 0.339 5 (4)
History of PTCA, n (%) 9 (45) 28 (46) 19 (50) 0.905 56 (47)
Mean NYHA-class 1 (0.5-2) 2 (1-2) 2.5 (2-3) <0.001* 2 (1-2)
Cardiovascular risk factors
Treated hypertension 14 (70) 55 (92) 37 (98) 0.004* 106 (90)
Smoking, n (%) 8 (44) 8 (13) 7 (19) 0.013* 23 (20)
Family history of CAD 7 (35) 40 (66) 16 (43) 0.019* 63 (53)
Hyperlipidemia, n (%) 8 (40) 44 (72) 26 (68) 0.029* 78 (66)
Glucose metabolism status
NGT, n (%) 12 (60) 15 (25) 8 (21)
0.013*
35 (29)
IGT, n (%) 5 (25) 17 (28) 9 (24) 31 (26)
New detected T2DM, n (%) 2 (10) 10 (16) 12 (32) 24 (20)
Known T2DM, n (%) 1 (5) 19 (31) 9 (24) 29 (24)
Duration of T2DM (years) 2.5 (2-3) 5.5 (2-10) 14 (4-24.5) 0.076 5.5 (2.5-12.5)
Medications
ACE inhibitor, n (%) 12 (60) 37 (61) 23 (61) 0.999 72 (61)
AT1 receptor blocker, n (%) 0 11 (18) 12 (32) 0.014* 23 (20)
Diuretics, n (%) 1 (%) 18 (30) 21 (55) <0.001* 40 (34)
Ca2+ blocker, n (%) 3 (15) 8 (13) 13 (34) 0.032* 24 (20)
ß-Blocker, n (%) 11 (55%) 41 (67) 34 (89) 0.009* 86 (72)
Insulin therapy, n (%) 0 7 (14) 5 (16) 0.355 12 (13)
OAD, n (%) 1 (8) 12 (25) 3 (9) 0.109 16 (17)
Statin, n(%) 7 (35) 38 (62) 25 (65) 0.274 70 (59)
Acetyl salicylic acid, n (%) 10 (47) 51 (83) 29 (76%) 0.021* 90 76)
Values are median (interquartile range) or n (%). aMann-Whitney-Test, Jonckheere-Terpstra test, Fisher or χ2- test were used as appropriate, * statistically signiicant (p
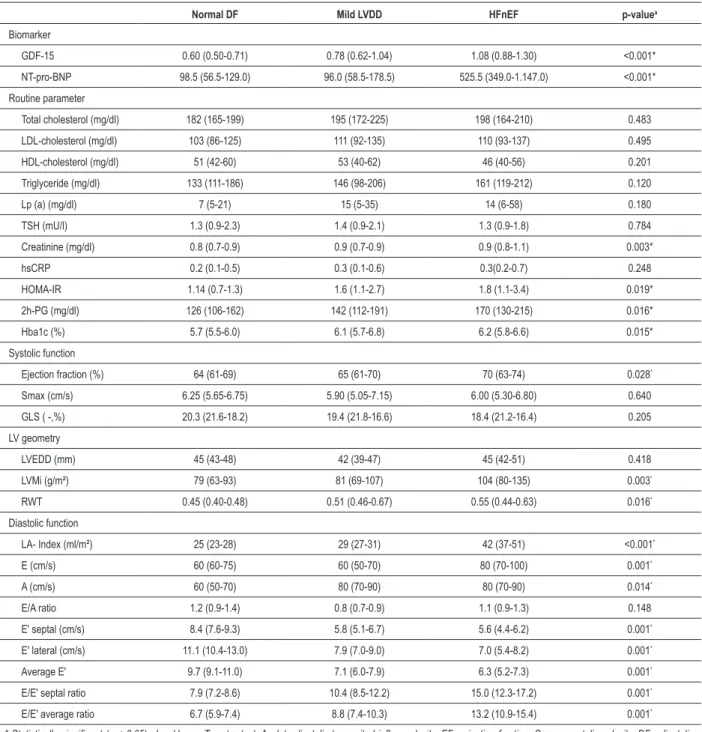
Table 2 - Laboratory data and Parameter of cardiac assessment according to diastolic function
Normal DF Mild LVDD HFnEF p-valuea
Biomarker
GDF-15 0.60 (0.50-0.71) 0.78 (0.62-1.04) 1.08 (0.88-1.30) <0.001*
NT-pro-BNP 98.5 (56.5-129.0) 96.0 (58.5-178.5) 525.5 (349.0-1.147.0) <0.001*
Routine parameter
Total cholesterol (mg/dl) 182 (165-199) 195 (172-225) 198 (164-210) 0.483
LDL-cholesterol (mg/dl) 103 (86-125) 111 (92-135) 110 (93-137) 0.495
HDL-cholesterol (mg/dl) 51 (42-60) 53 (40-62) 46 (40-56) 0.201
Triglyceride (mg/dl) 133 (111-186) 146 (98-206) 161 (119-212) 0.120
Lp (a) (mg/dl) 7 (5-21) 15 (5-35) 14 (6-58) 0.180
TSH (mU/l) 1.3 (0.9-2.3) 1.4 (0.9-2.1) 1.3 (0.9-1.8) 0.784
Creatinine (mg/dl) 0.8 (0.7-0.9) 0.9 (0.7-0.9) 0.9 (0.8-1.1) 0.003*
hsCRP 0.2 (0.1-0.5) 0.3 (0.1-0.6) 0.3(0.2-0.7) 0.248
HOMA-IR 1.14 (0.7-1.3) 1.6 (1.1-2.7) 1.8 (1.1-3.4) 0.019*
2h-PG (mg/dl) 126 (106-162) 142 (112-191) 170 (130-215) 0.016*
Hba1c (%) 5.7 (5.5-6.0) 6.1 (5.7-6.8) 6.2 (5.8-6.6) 0.015*
Systolic function
Ejection fraction (%) 64 (61-69) 65 (61-70) 70 (63-74) 0.028*
Smax (cm/s) 6.25 (5.65-6.75) 5.90 (5.05-7.15) 6.00 (5.30-6.80) 0.640
GLS ( -,%) 20.3 (21.6-18.2) 19.4 (21.8-16.6) 18.4 (21.2-16.4) 0.205
LV geometry
LVEDD (mm) 45 (43-48) 42 (39-47) 45 (42-51) 0.418
LVMi (g/m²) 79 (63-93) 81 (69-107) 104 (80-135) 0.003*
RWT 0.45 (0.40-0.48) 0.51 (0.46-0.67) 0.55 (0.44-0.63) 0.016*
Diastolic function
LA- Index (ml/m²) 25 (23-28) 29 (27-31) 42 (37-51) <0.001*
E (cm/s) 60 (60-75) 60 (50-70) 80 (70-100) 0.001*
A (cm/s) 60 (50-70) 80 (70-90) 80 (70-90) 0.014*
E/A ratio 1.2 (0.9-1.4) 0.8 (0.7-0.9) 1.1 (0.9-1.3) 0.148
E' septal (cm/s) 8.4 (7.6-9.3) 5.8 (5.1-6.7) 5.6 (4.4-6.2) 0.001*
E' lateral (cm/s) 11.1 (10.4-13.0) 7.9 (7.0-9.0) 7.0 (5.4-8.2) 0.001*
Average E' 9.7 (9.1-11.0) 7.1 (6.0-7.9) 6.3 (5.2-7.3) 0.001*
E/E' septal ratio 7.9 (7.2-8.6) 10.4 (8.5-12.2) 15.0 (12.3-17.2) 0.001*
E/E' average ratio 6.7 (5.9-7.4) 8.8 (7.4-10.3) 13.2 (10.9-15.4) 0.001*
* Statistically signiicant (p < 0.05). Jonckheere-Terpstra test. A - late diastolic transmitral inlow velocity, EF - ejection fraction. Smax - systolic velocity, DF - diastolic function, GPS - global longitudinal strain, LA - left atrial, E - early diastolic transmitral inlow velocity, E´septal - early diastolic tissue Doppler velocity septal, E´ lateral - early diastolic tissue Doppler velocity lateral, HFnEF - heart failure with normal ejection fraction, HOMA-IR - Homeostasis Model Assessment of Insulin Resistance, hsCRP - high sensitive c-reactive protein, LVEDD - left ventricular end-diastolic diameter, Lp (a) - Lipoprotein (a), LV - left ventricular, LVMi - left ventricular muscle mass index, NT-pro BNP - amino-terminal pro-B-type natriuretic peptide, PG - postprandial glucose, RWT - relative wall thickness, Smax - systolic velocity.
and higher levels are associated with adverse cardiovascular outcomes. Accordingly, higher levels of GDF-15 in patients with more advanced stages of LVDD (HFnEF, LVDD grad II or III) may reflect an adaptive response that is outweighed by the severity of the underlying disease. As GDF-15 predicts cardiac mortality in patients with CAD28, acute myocardial infarction29
or SHF13, GDF-15 might be a future biomarker in patients with
HFnEF, probably indicating prognosis.
According to the current guidelines, patients can be classified as having HFnEF or LVDD without the need for objective evidence of hemodynamic limitation in exercise tolerance as a result of increasing preload or afterload conditions. Incoherent in the current diagnostic approach is that leading symptoms of patients with HFnEF are related to physical activity30, whereas ventricular performance obtained
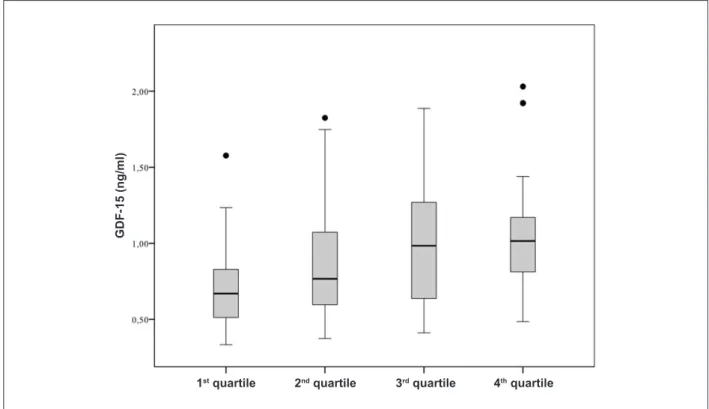
Figure 1 -Growth differentiation factor-15 levels in patients with normal diastolic function, mild diastolic dysfunction and heart failure with normal ejection fraction. GDF-15
levels are presented as box (25th percentile, median, 75th percentile), and whiskers plots and upper outliers are presented as black dots. DF - diastolic function, GDF-15
- growth differentiation factor-15, LVDD - left ventricular diastolic dysfunction.
HFnEF
Normal DF Mild LVDD
G
D
F
-1
5
(n
g
/m
l)
Figure 2a -Growth differentiation factor-15 levels stratiied according to left atrial volume index quartiles. Growth differentiation factor 15 (GDF-15) levels are presented
as box (25th percentile, median, 75th percentile), and whiskers plots and upper outliers are presented as black dots. GDF-15 - growth differentiation factor 15. The left
atrial volume index in the irst quartile ranged from 19.3 - 26,7 ml/m2 body surface area (BSA), in the second quartile from 26,7 - 30,2 ml/m2, in the third quartile from 30,2 - 37,5 ml/m2 and in the fourth quartile from 37,2 - 82,0 ml/m2 (p < 0.001 in the Jonckheere-Terpstra-Test).
3rd quartile
1st quartile 2nd quartile
G
D
F
-1
5
(n
g
/m
l)
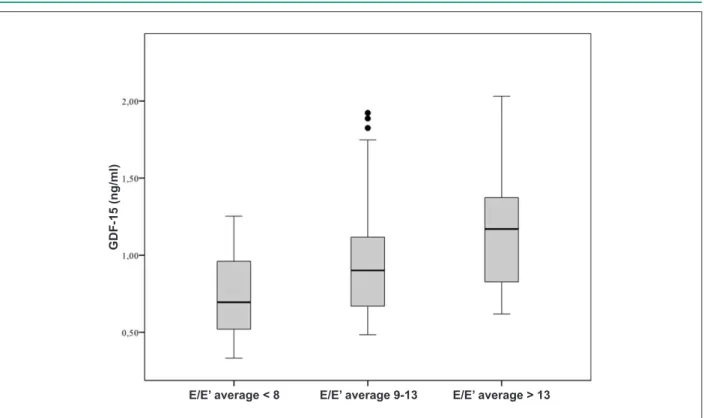
Figure 2b -Growth differentiation factor-15 levels plotted against the E/E´ average ratio. GDF-15 levels are presented as box (25th percentile, median, 75th percentile), and whiskers plots and upper outliers are presented as black dots (p < 0.001for trend by Jonckheere-Tepstra). GDF-15 - growth differentiation factor-15.
E/E’ average < 8
G
D
F
-1
5
(n
g
/m
l)
E/E’ average 9-13 E/E’ average > 13
Table 3 - Parameters of cardiac assessment according to GDF-15 levels
GDF-15 1rd quartile GDF-15 2nd quartile GDF-15 3rd quartile GDF-15 4th quartile p- valuea
Systolic function
Ejection fraction (%) 65 (62-70) 63 (59-68) 65 (61-72) 70 (64-73) 0.021*
Smax (cm/s) 6.60 (5.70-7.15) 5.90 (5.30-7.00) 5.65 (5.00-6.50) 6.10 (5.10-6.90) 0.283
GLS (-,%) 19.0 (21.3-16.9) 18.9 (21.4-16.6) 18.9 (20.5-17.5) 19.0 (22.0-17.1) 0.956
LV geometry
LVEDD (mm) 43 (41-47) 45 (41-49) 44 (39-50) 44 (41-48) 0.851
LVMi (g/m²) 79 (64-96) 96 (72-108) 83.1 (71-127) 92 (67-117) 0.326
RWT 0.50 (0.40-0.60) 0.49 (0.44-0.62) 0.54 (0.45-0.63) 0.51 (0.45-0.69) 0.145
Diastolic function
LA- Index (ml/m²) 27 (25-30) 29 (24-34) 34 (28-40) 36 (30-46) <0.001*
E (cm/s) 60 (60-70) 70 (60-70) 60 (50-70) 70 (60-90) 0.047*
A (cm/s) 70 (60-80) 80 (70-90) 80 (70-90) 80 (65-95) 0.129
E/A ratio 0.9 (0.8-0.9) 0.9 (0.8-1.0) 0.8 (0.7-1.2) 0.9 (0.7-1.2) 0.978
E' septal (cm/s) 6.8 (5.3-7.9) 6.1 (5.3-7.6) 5.8 (4.8-6.5) 5.7 (4.1-6.2) 0.002*
E' lateral (cm/s) 9.9 (8.2-10.9) 8.2 (6.9-10.5) 7.6 (7.0-8.6) 7.3 (5.6-8.8) <0.001*
Average E' 8.3 (7.0-9.6) 7.3 (6.1-8.7) 6.8 (6.0-7.7) 6.3 (5.0-7.3) <0.001*
E/E' septal ratio 8.8 (8.0-11.4) 10.5 (8.5-12.7) 11.4 (8.3-14.1) 14.5 (11.5-17.1) <0.001*
E/E' average ratio 7.4 (6.7-9.3) 9.0 (7.4-10.5) 9.4 (7.5-11.3) 12.1 (10.1-15.4) <0.001*
Laboratory
NT-pro BNP (pg/ml) 98 (64-189) 120 (90-253) 183 (65-502) 406 (117-773) <0.001*
* Statistically signiicant (p < 0.05). aJonckheere-Terpstra test. A - late diastolic transmitral inlow velocity, EF - ejection fraction. GLS - global longitudinal strain, LA - left
Figure 3a -Change in cardiac output response from upright to supine position. The y-axis shows the change in the cardiac output index by changes in body position
from upright to supine measured by inert gas rebreathing techniques. Cardiac output index is presented as box (25th percentile, median, 75th percentile), and whiskers
plots, upper outliers are presented as black dots. HFnEF - heart failure with normal ejection fraction.
Controls
C
h
a
n
g
e
i
n
c
a
rd
ia
c
o
u
tp
u
t
re
s
p
o
n
s
e
(%
)
HFnEF
Figure 3b -Change in cardiac output response from upright to supine position stratiied according to growth differentiation factor-15 quartiles. The y-axis shows the
change in the cardiac output index caused by changes in body position from upright to supine measured non-invasively by inert gas rebreathing techniques. Cardiac
output index is presented as box (25th percentile, median, 75th percentile), and whiskers plots, upper outliers are presented as black dots. The growth differentiation
factor-15 (GDF-15) levels in the irst quartile ranged from 0.33 - 0.83ng/ml, in the second quartile from 0.83 - 1.13 ng/ml, in the third quartile from 1.13 - 1.54 ng/ml and in the fourth quartile from 1.54 - 2.03 ng/ml (p = 0.005 in the Jonckheere-Terpstra-Test).
1st quartile
C
h
a
n
g
e
i
n
c
a
rd
ia
c
o
u
tp
u
t
re
s
p
o
n
s
e
(%
)
symptomatic status of patients with heart failure31. Consistent
with the fact that GDF-15 expression is activated in response to stress27, our data showed a significant negative correlation
between the magnitude of COi response to the changes in body position from upright to supine, which can be considered a model of preload change. The association of a reduced cardiac output response to preload stress and increased GDF-15 levels confirmed the hypothesis that the adaptive response of GDF-expression is countermanded by the severity of the underlying disease. This is further reinforced particularly by the correlation of GDF-15 and the LAi, a parameter that indicates severe diastolic function abnormalities over a longer period of time. An increased LAi without concomitant mitral valve disease reflects an enduring cumulative effect of different contributors to the development of LVDD and is therefore less vulnerable to intermittent changes in preload (e.g. volume status) or afterload (e.g. blood pressure). Acute changes in these conditions during echocardiographic diagnosis might lead to misclassifications of diastolic function abnormalities.
The finding of an association between GDF-15 and LVDD is in line with a recent study of Stahrenberg et al32 that assessed
the relationship in a community based trial. Nevertheless, there are some concerns about methodological issues that might have influenced the results presented in this interesting study. Most important, there was no general screening for the presence of CAD with either noninvasive stress testing or coronary angiography. Since CAD has been shown to be associated both with elevated GDF-15 levels28,33 and LVDD34,
the lack of information on coronary morphology is a potential source of bias towards increased plasma levels of GDF-15 and toward an increased prevalence and/or severity of LVDD. In accordance with the uncertainties about the presence of CAD, the E/E’ ratio was not averaged based on medial and lateral velocities, as recommended by the current guidelines10.
Because some of the patients likely had regional wall motion abnormalities, tethering effects might have been a possible source of bias. Moreover, patients were not screened with an oral glucose tolerance test for undetected diabetes, which have been associated both with increased GDF-15 levels35,36
and the presence and severity of LVDD, especially in subjects with newly detected diabetes on oGTT37.
In contrast, the present study followed the current guidelines for the diagnosis of LVDD in subjects well characterized for the degree of abnormality in plasma glucose levels and coronary morphology. Therefore, we were able to
reinforce the data of Stahrenberg et al32. in a different cohort
of patients with known coronary morphology and metabolic status. Furthermore, we extended the findings to a functional hemodynamic parameter, as we were able to demonstrate an association of GDF-15 levels with an impairment of the hemodynamic response to different preload conditions.
Limitations
The number of patients, especially with normal DF in our cohort, was relatively small, resulting in a limited statistical power. Furthermore, the rates of CAD and cardiovascular risk factors were high in this study population. Therefore, the present results may not readily represent the general population. In addition, patients with HFnEF were older than those with normal diastolic function, a potential source of bias towards increased plasma levels of GDF-15. Nevertheless, association between LVDD and GDF-15 remains significant after adjustment for CAD, age, glucose metabolism and hypertension as covariates into multivariate regression models. Although we based the diagnosis of LVDD on current guidelines which have recently been published, their clinical value has yet to be prospectively validated. Furthermore, the rate of patients on antihypertensive treatment was higher in the HFnEF group. Nevertheless, a significant relation of any of these drugs to the increased GDF-15 plasma levels has never been identified. Lastly, our cross sectional study design does not permit any conclusions on causality.
Conclusion
GDF-15 is a novel promising biomarker in HFnEF that is elevated in subjects with either mild or moderate to severe LVDD regardless of the presence of CAD or other established risk factors frequently associated with HFnNF. Considering the fact that GDF-15 appears to have cardioprotective functions, we hypothesize that higher levels of GDF-15 may reflect an adaptive response that is outweighed by the severity of the underlying disease. Incorporating a biomarker to aid in diagnosis, and risk prediction in HFnEF may enhance the ability to accurately and early identify patients at greatest risk for heart failure-related complications. Better characterization of patients with HFnEF could allow a more effective use of specific therapeutic and prevention strategies. Further studies are needed to determine the value of GDF-15 for diagnosis and therapy monitoring in diastolic heart failure.
References
1. Bhatia RS, Tu JV, Lee DS, Austin PC, Fang J, Haouzi A, et al. Outcome of heart failure with preserved ejection fraction in a population-based study. N Engl J Med. 2006;355(3):260-9.
2. Owan TE, Hodge DO, Herges RM, Jacobsen SJ, Roger VL, Redfield MM. Trends in prevalence and outcome of heart failure with preserved ejection fraction. N Engl J Med. 2006;355(3):251-9.
3. Redfield MM, Jacobsen SJ, Burnett JC Jr, Mahoney DW, Bailey KR, Rodeheffer RJ. Burden of systolic and diastolic ventricular dysfunction in the
community: appreciating the scope of the heart failure epidemic. JAMA. 2003;289(2):194-202.
4. Mogelvang R, Sogaard P, Pedersen SA, Olsen NT, Marott JL, Schnohr P, et al. Cardiac dysfunction assessed by echocardiographic tissue Doppler imaging is an independent predictor of mortality in the general population. Circulation. 2009;119(20):2679-85.
mortality and cardiovascular hospital admission in elderly patients with heart failure (SENIORS). Eur Heart J. 2005;26(3):215-25.
6. Massie BM, Carson PE, McMurray JJ, Komajda M, McKelvie R, Zile MR, et al. Irbesartan in patients with heart failure and preserved ejection fraction. N Engl J Med. 2008;359(23):2456-67.
7. Persson H, Lonn E, Edner M, Baruch L, Lang CC, Morton JJ, et al. Diastolic dysfunction in heart failure with preserved systolic function: need for objective evidence:results from the CHARM Echocardiographic Substudy-CHARMES. J Am Coll Cardiol. 2007;49(6):687-94.
8. Hobbs FD, Roalfe AK, Davis RC, Davies MK, Hare R. Prognosis of all-cause heart failure and borderline left ventricular systolic dysfunction: 5 year mortality follow-up of the Echocardiographic Heart of England Screening Study (ECHOES). Eur Heart J. 2007;28(9):1128-34.
9. Paulus WJ, van Ballegoij JJ. Treatment of heart failure with normal ejection fraction: an inconvenient truth! J Am Coll Cardiol. 2010;55(6):526-37.
10. Nagueh SF, Appleton CP, Gillebert TC, Marino PN, Oh JK, Smiseth OA, et al. Recommendations for the evaluation of left ventricular diastolic function by echocardiography. Eur J Echocardiogr. 2009;10(2):165-93.
11. Bootcov MR, Bauskin AR, Valenzuela SM, Moore AG, Bansal M, He XY, et al. MIC-1, a novel macrophage inhibitory cytokine, is a divergent member of the TGF-beta superfamily. Proc Natl Acad Sci U S A. 1997;94(21):11514-9.
12. Kempf T, Horn-Wichmann R, Brabant G, Peter T, Allhoff T, Klein G, et al. Circulating concentrations of growth-differentiation factor 15 in apparently healthy elderly individuals and patients with chronic heart failure as assessed by a new immunoradiometric sandwich assay. Clin Chem. 2007;53(2):284-91.
13. Kempf T, von Haehling S, Peter T, Allhoff T, Cicoira M, Doehner W, et al. Prognostic utility of growth differentiation factor-15 in patients with chronic heart failure. J Am Coll Cardiol. 2007;50(11):1054-60.
14. Kempf T, Wollert KC. Growth-differentiation factor-15 in heart failure. Heart Fail Clin. 2009;5(4):537-47.
15. Rathmann W, Haastert B, Icks A, Lowel H, Meisinger C, Holle R, et al. High prevalence of undiagnosed diabetes mellitus in Southern Germany: target populations for efficient screening. The KORA survey 2000. Diabetologia. 2003;46(2):182-9.
16. Peterson LR, Waggoner AD, Schechtman KB, Meyer T, Gropler RJ, Barzilai B, et al. Alterations in left ventricular structure and function in young healthy obese women: assessment by echocardiography and tissue Doppler imaging. J Am Coll Cardiol. 2004;43(8):1399-404.
17. Lang RM, Bierig M, Devereux RB, Flachskampf FA, Foster E, Pellikka PA, et al. Recommendations for chamber quantification: a report from the American Society of Echocardiography’s Guidelines and Standards Committee and the Chamber Quantification Writing Group, developed in conjunction with the European Association of Echocardiography, a branch of the European Society of Cardiology. J Am Soc Echocardiogr. 2005;18(12):1440-63.
18. Clemensen P, Christensen P, Norsk P, Gronlund J. A modified photo- and magnetoacoustic multigas analyzer applied in gas exchange measurements. J Appl Physiol. 1994;76(6):2832-9.
19. Agostoni PG, Wasserman K, Perego GB, Guazzi M, Cattadori G, Palermo P, et al. Non-invasive measurement of stroke volume during exercise in heart failure patients. Clin Sci (Lond). 2000;98(5):545-51.
20. Saur J, Fluechter S, Trinkmann F, Papavassiliu T, Schoenberg S, Weissmann J, et al. Noninvasive determination of cardiac output by the inert-gas-rebreathing method--comparison with cardiovascular magnetic resonance imaging. Cardiology. 2009;114(4):247-54.
21. Executive Summary of The Third Report of The National Cholesterol Education Program (NCEP) Expert Panel on Detection, Evaluation, And
Treatment of High Blood Cholesterol In Adults (Adult Treatment Panel III). JAMA. 2001;285(19):2486-97.
22. Kempf T, Eden M, Strelau J, Naguib M, Willenbockel C, Tongers J, et al. The transforming growth factor-beta superfamily member growth-differentiation factor-15 protects the heart from ischemia/reperfusion injury. Circ Res. 2006;98(3):351-60.
23. Xu J, Kimball TR, Lorenz JN, Brown DA, Bauskin AR, Klevitsky R, et al. GDF15/ MIC-1 functions as a protective and antihypertrophic factor released from the myocardium in association with SMAD protein activation. Circ Res. 2006;98(3):342-50.
24. Tan M, Wang Y, Guan K, Sun Y. PTGF-beta, a type beta transforming growth factor (TGF-beta) superfamily member, is a p53 target gene that inhibits tumor cell growth via TGF-beta signaling pathway. Proc Natl Acad Sci U S A. 2000;97(1):109-14.
25. Sano M, Minamino T, Toko H, Miyauchi H, Orimo M, Qin Y, et al. p53-induced inhibition of Hif-1 causes cardiac dysfunction during pressure overload. Nature. 2007;446(7134):444-8.
26. McCaffrey TA, Fu C, Du B, Eksinar S, Kent KC, Bush H Jr, et al. High-level expression of Egr-1 and Egr-1-inducible genes in mouse and human atherosclerosis. J Clin Invest. 2000;105(5):653-62.
27. Buitrago M, Lorenz K, Maass AH, Oberdorf-Maass S, Keller U, Schmitteckert EM, et al. The transcriptional repressor Nab1 is a specific regulator of pathological cardiac hypertrophy. Nat Med. 2005;11(8):837-44.
28. Kempf T, Sinning JM, Quint A, Bickel C, Sinning C, Wild PS, et al. Growth-differentiation factor-15 for risk stratification in patients with stable and unstable coronary heart disease: results from the AtheroGene study. Circ Cardiovasc Genet. 2009;2(3):286-92.
29. Khan SQ, Ng K, Dhillon O, Kelly D, Quinn P, Squire IB, et al. Growth differentiation factor-15 as a prognostic marker in patients with acute myocardial infarction. Eur Heart J. 2009;30(9):1057-65.
30. Kitzman DW, Higginbotham MB, Cobb FR, Sheikh KH, Sullivan MJ. Exercise intolerance in patients with heart failure and preserved left ventricular systolic function: failure of the Frank-Starling mechanism. J Am Coll Cardiol. 1991;17(5):1065-72.
31. Franciosa JA, Park M, Levine TB. Lack of correlation between exercise capacity and indexes of resting left ventricular performance in heart failure. Am J Cardiol. 1981;47(1):33-9.
32. Stahrenberg R, Edelmann F, Mende M, Kockskamper A, Dungen HD, Scherer M, et al. Association of glucose metabolism with diastolic function along the diabetic continuum. Diabetologia. 2010;53(7):1331-40.
33. Wollert KC, Kempf T, Lagerqvist B, Lindahl B, Olofsson S, Allhoff T, et al. Growth differentiation factor 15 for risk stratification and selection of an invasive treatment strategy in non ST-elevation acute coronary syndrome. Circulation. 2007;116(14):1540-8.
34. Ohara T, Little WC. Evolving focus on diastolic dysfunction in patients with coronary artery disease. Curr Opin Cardiol. 2010;25(6):613-21.
35. Dostalova I, Roubicek T, Bartlova M, Mraz M, Lacinova Z, Haluzikova D, et al. Increased serum concentrations of macrophage inhibitory cytokine-1 in patients with obesity and type 2 diabetes mellitus: the influence of very low calorie diet. Eur J Endocrinol. 2009;161(3):397-404.
36. Lajer M, Jorsal A, Tarnow L, Parving HH, Rossing P. Plasma growth differentiation factor-15 independently predicts all-cause and cardiovascular mortality as well as deterioration of kidney function in type 1 diabetic patients with nephropathy. Diabetes Care. 2010;33(7):1567-72.