ARTICLE DOI: 10.1590/0004-282X20130003
Magnetic resonance imaging study cannot
individually distinguish individuals with
mild cognitive impairment, mild Alzheimer’s
disease, and normal aging
Estudo por ressonância magnética não pode diferenciar individualmente os indivíduos
com declínio cognitivo leve, doença de Alzheimer leve e envelhecimento normal
Terce Liana Menezes, Luciana Patrízia A. Andrade-Valença, Marcelo Moraes Valença
Elderly individuals with mild cognitive impairment (MCI) are part of a continuum between normal aging with its cognitive diiculties and fully-ledged dementia. However, there is a grow-ing body of evidence suggestgrow-ing that MCI might precede the on-set of Alzheimer’s disease (AD). Longitudinal studies have dem-onstrated that subjects with MCI present a progression rate of 10–15% per year to AD, contrasting with 1–2%, in a similar analy-sis, in the general population using a similar age range1.
Declarative memory is related to the involvement of mesial structures of the temporal lobe, especially the
hippocampus2,3. Studies using magnetic resonance imaging
(MRI) may provide in vivo analysis of speciic regions of the temporal lobe showing a strong correlation between abnor-mal neuroimaging indings and the scores obtained on cog-nitive tests4,5. A number of authors have reported that
volu-metric-structural study and spectroscopy analysis might be useful in the investigation of patients with MCI in order to diagnose patients with a higher risk of developing AD6-8.
In advanced phases of AD, major hippocampus atrophy with a decrease in N-acetyl aspartate (NAA) and an increase
MD, PhD; Neurology and Neurosurgery Unit, Department of Neuropsychiatry, Federal University of Pernambuco, Recife, Brazil.
Correspondence: Marcelo M. Valença; Neurology and Neurosurgery Unit, Department of Neuropsychiatry, Federal University of Pernambuco; Cidade Universitária; 50670-420 Recife PE - Brasil; E-mail: [email protected]
Conlict of interest: There is no conlict of interest to declare.
Received 11 March 2012; Received in inal form 22 October 2012; Accepted 30 October 2012. ABSTRACT
Objective: To evaluate the volumetric and spectroscopy aspects of hippocampus in patients with mild Alzheimer’s disease (AD) and mild cognitive impairment (MCI). Methods: A series of patients older than 65 years and with memory deicit were studied. Results: The evocation of words test presented a signiicant reduction in the number of words recalled by the patients with MCI and mild AD as compared with the control group. Bilateral reduction of the hippocampus volume in the AD group was observed when compared to the control group. There were no statistical differences in the values of NAA/Cr, mI/Cr, Cho/Cr and mI/NAA between the groups. Conclusions: Magnetic resonance imaging study failed to individually distinguish patients with MCI, mild AD and normal aging. However, patients with mild AD presented loss of asym-metry between the right and left hippocampus, and a reduction in hippocampus volume.
Key words: Alzheimer disease, dementia, mild cognitive impairment, hippocampus, magnetic resonance imaging, spectroscopy.
RESUMO
Objetivo: Avaliar volume e espectroscopia do hipocampo em pacientes com doença de Alzheimer leve e declínio cognitivo leve. Métodos: Foi es-tudada uma série de pacientes com 65 anos de idade ou mais, com déicit de memória. Resultados: O teste de evocação de palavras mostrou redução signiicativa no número de palavras lembradas pelos pacientes com declínio cognitivo leve e doença de Alzheimer leve, em compa-ração com o grupo controle. Foi observada redução bilateral do volume do hipocampo no grupo com doença de Alzheimer quando comparado com o grupo controle. Não houve diferença estatística nos valores de NAA/Cr, mI/Cr, Cho/Cr e mI/NAA entre os grupos. Conclusão: Estudo pela ressonância magnética não diferencia individualmente os pacientes com declínio cognitivo leve, doença de Alzheimer leve e envelhecimen-to normal. No entanenvelhecimen-to, pacientes com quadro leve de doença de Alzheimer apresentam perda de assimetria entre os hipocampos direienvelhecimen-to e esquerdo e redução no volume do hipocampo.
in mio-inositol (mI) is a common inding7,9. Furthermore, the
reduction in the concentration of NAA is inversely propor-tional to the number of senile plaques10.
Studies during mild or initial stages of AD show that the MRI alterations are discrete, and some have reported con-troversial results regarding the expected reduction in hippo-campus volume11-16 and the changes in proton spectroscopy
parameters7,17-21. his controversy has stimulated new
stud-ies aimed at a more precise diferential diagnosis between: (a) patients with MCI, (b) patients with MCI as a preclinical form of AD, and (c) patients at the initial stage of AD.
his study was performed with the aim of investigating patients with MCI and mild AD using volumetric-structural MRI and spectroscopy analysis, to evaluate volumetric analy-sis of the hippocampus and possible alterations in NAA, mI and choline (Cho) in the hippocampus.
METHODS
We studied a series of 22 right-handed patients over 65 years of age, with memory deicit complaints, evaluated for the irst time during the years of 2002 and 2003 at the Cognitive Neurology Unit, Federal University of Pernambuco Hospital, comprising 11 patients with MCI and 11 with mild AD, based on NINCDS-ADRDA22. Patients with mild AD scored 1 in the
Clinical Dementia Rating(CDR)23. To evaluate the staging
se-verity of de cognitive deicit, CDR score of 0.5 was used for MCI patients whose cognitive deicit was not severe enough to in-terfere with the day-to-day life and usual activities. he AD pa-tients presented memory impairment associated with one or more cognitive disorders such as dysphasia, apraxia, agnosia or disturbance in executive functioning; progressive social or occupational impairment and a clear decline from previous level of functioning and reported continuing cognitive decline. No speciic treatment for the cognitive impairment was used until after the MRI evaluation.
Patients with moderate/severe AD stages and those with pre-vious chronic/degenerative or psychiatric disorders and those on neuropsychiatry medication were excluded. he control group consisted of 15 healthy subjects, also over 65 years of age.
All the participants (or their legal representative) gave their formal written consent. he research protocol was approved by the Ethics Committee of the Federal University of Pernambuco.
Acquisition and analysis of MRI
MRI was performed using a Magnetom Sonata 1.5 Tesla (Siemens). he clinical proile of the patient was unknown to the examiner during the analysis of the MRI data.
We used a volumetric sequence with images in T1, MP-RAGE (time repetition, TR=9.7 ms; echo time, ET=4 ms; inclination an-gulations 12o), matrix of 256x128 mm, vision range of 200 mm,
with coronal sections 3 mm thick obtained perpendicularly to the
longer axis of the hippocampus. A sequence with approximate-ly 12 to 15 slices across the entire extension of the hippocampus was obtained24.
Hippocampal atrophy was considered when the volume was smaller than the mean minus two standard deviations (mean – 2SD), calculated using the data of the control group11.
he experimental parameters of MRI used were a STEAM se-quence (ET=20 ms; TR=1.500 ms; number of acquisitions=128).
he major photonic resonance was identiied and read from right to left: (a) NAA (2.03 ppm); (b) creatine (Cr, 3.03 ppm); (c) Cho (3.23 ppm); (d) mio-inositol (mI) (3.56 ppm). he ratios of NAA/Cr, mI/Cr, Cho/Cr, mI/Cr and mI/NAA were analyzed.
RESULTS
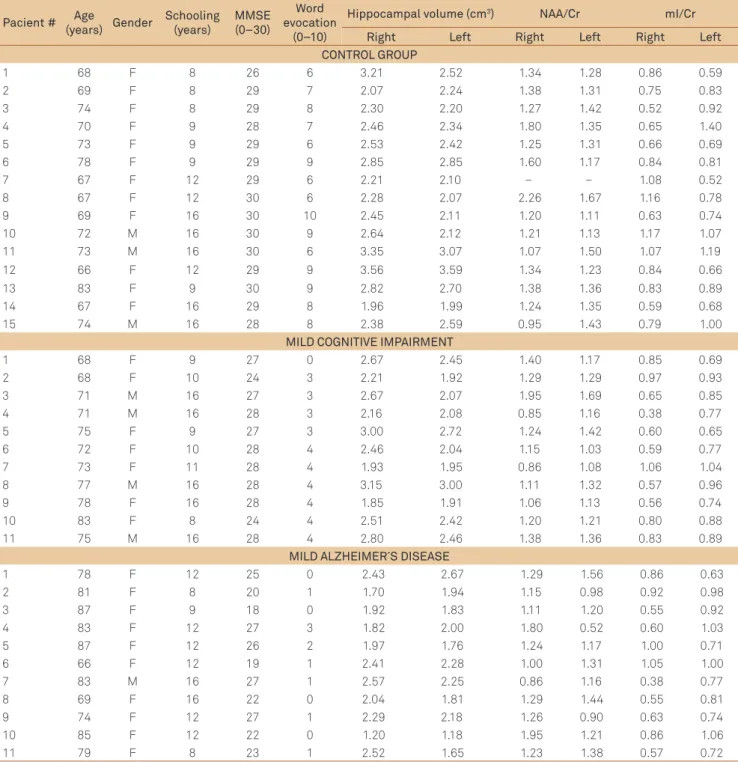
he individual data are shown in Table 1. Table 2 shows de-mographic variables, the total Mini-Mental State Examination (MMSE) scores, and the results of the evocation of words test in the three evaluated groups. he statistical analysis did not show any signiicant diferences between genders and educa-tional background. Regarding age, there was a signiicant dif-ference (p<0.05) between the control group and the group with mild AD, but there were no statistical diferences between the control group and the group with MCI. here were also statisti-cal diferences between ages, when the MCI and the AD groups were compared (p=0.0451, Mann-Whitney test).
he total MMSE scores obtained for MCI and AD signii-cantly decreased compared with the control group (p<0.05). he word evocation test presented a signiicant reduction in the number of words recalled by the patients with MCI (3.3±1.2; p<0.01) and with mild AD (0.9±0.9; p<0.001) as com-pared to the control group (7.6±1.4). here was also a statis-tical diference between the groups with MCI and mild AD (p=0.0013, Mann-Whitney test).
Volumetric study of hippocampus
Both groups presented a smaller volume of the left hip-pocampus, when compared with the contralateral right hippocampus (p=0.0049, Wilcoxon paired test). Patients with mild AD presented no signiicant diferences between the right and left hippocampi. Regarding the control group values, hippocampal atrophy was considered to be present when the right hippocampus was smaller than 1.67 cm3 and
the left hippocampus smaller than 1.58 cm3. Using this
cri-terion, it was observed that only one of the patients with mild AD presented bilateral hippocampal atrophy (patient #10 in Table 1, right 1.20 cm3 and left 1.18 cm3).
Figure shows a bilateral reduction of the hippocampus volume in the AD group as compared to the control group (right side: 2.08±0.42 cm3versus 2.61±0.47 cm3, respectively; left
side: 1.96±0.39 cm3versus 2.46
he left and right hippocampi of the group with mild AD pre-sented reductions of 20.3 and 20.3%, respectively, compared with the control group. here was no statistically signiicant diference between groups.
Proton spectroscopy of hippocampus
here were no statistical diferences in the values of NAA/Cr, mI/Cr, Cho/Cr and mI/NAA between the right and left hippocampi in each group or between the groups them-selves (Tables 3 and 4).
DISCUSSION
Patients with MCI and mild AD displayed an involvement of declarative memory, which suggests a progressive degen-erative process.
Similar studies showed great discrepancy in sensitivity and speciicity regarding the determination of hippocampus volumetry11,14,25. he inclusion of patients in moderate and
advanced phases might have contributed to the clear pres-ence of hippocampus atrophy previously reported25.
Table 1. Individual data obtained in the control, mild cognitive impairment and mild Alzheimer´s disease groups.
Pacient # Age
(years) Gender
Schooling (years)
MMSE (0–30)
Word evocation
(0–10)
Hippocampal volume (cm3) NAA/Cr mI/Cr
Right Left Right Left Right Left
CONTROL GROUP
1 68 F 8 26 6 3.21 2.52 1.34 1.28 0.86 0.59
2 69 F 8 29 7 2.07 2.24 1.38 1.31 0.75 0.83
3 74 F 8 29 8 2.30 2.20 1.27 1.42 0.52 0.92
4 70 F 9 28 7 2.46 2.34 1.80 1.35 0.65 1.40
5 73 F 9 29 6 2.53 2.42 1.25 1.31 0.66 0.69
6 78 F 9 29 9 2.85 2.85 1.60 1.17 0.84 0.81
7 67 F 12 29 6 2.21 2.10 – – 1.08 0.52
8 67 F 12 30 6 2.28 2.07 2.26 1.67 1.16 0.78
9 69 F 16 30 10 2.45 2.11 1.20 1.11 0.63 0.74
10 72 M 16 30 9 2.64 2.12 1.21 1.13 1.17 1.07
11 73 M 16 30 6 3.35 3.07 1.07 1.50 1.07 1.19
12 66 F 12 29 9 3.56 3.59 1.34 1.23 0.84 0.66
13 83 F 9 30 9 2.82 2.70 1.38 1.36 0.83 0.89
14 67 F 16 29 8 1.96 1.99 1.24 1.35 0.59 0.68
15 74 M 16 28 8 2.38 2.59 0.95 1.43 0.79 1.00
MILD COGNITIVE IMPAIRMENT
1 68 F 9 27 0 2.67 2.45 1.40 1.17 0.85 0.69
2 68 F 10 24 3 2.21 1.92 1.29 1.29 0.97 0.93
3 71 M 16 27 3 2.67 2.07 1.95 1.69 0.65 0.85
4 71 M 16 28 3 2.16 2.08 0.85 1.16 0.38 0.77
5 75 F 9 27 3 3.00 2.72 1.24 1.42 0.60 0.65
6 72 F 10 28 4 2.46 2.04 1.15 1.03 0.59 0.77
7 73 F 11 28 4 1.93 1.95 0.86 1.08 1.06 1.04
8 77 M 16 28 4 3.15 3.00 1.11 1.32 0.57 0.96
9 78 F 16 28 4 1.85 1.91 1.06 1.13 0.56 0.74
10 83 F 8 24 4 2.51 2.42 1.20 1.21 0.80 0.88
11 75 M 16 28 4 2.80 2.46 1.38 1.36 0.83 0.89
MILD ALZHEIMER´S DISEASE
1 78 F 12 25 0 2.43 2.67 1.29 1.56 0.86 0.63
2 81 F 8 20 1 1.70 1.94 1.15 0.98 0.92 0.98
3 87 F 9 18 0 1.92 1.83 1.11 1.20 0.55 0.92
4 83 F 12 27 3 1.82 2.00 1.80 0.52 0.60 1.03
5 87 F 12 26 2 1.97 1.76 1.24 1.17 1.00 0.71
6 66 F 12 19 1 2.41 2.28 1.00 1.31 1.05 1.00
7 83 M 16 27 1 2.57 2.25 0.86 1.16 0.38 0.77
8 69 F 16 22 0 2.04 1.81 1.29 1.44 0.55 0.81
9 74 F 12 27 1 2.29 2.18 1.26 0.90 0.63 0.74
10 85 F 12 22 0 1.20 1.18 1.95 1.21 0.86 1.06
11 79 F 8 23 1 2.52 1.65 1.23 1.38 0.57 0.72
Table 2. Demographic characteristics and the scores on the Mini-Mental State Examination (MMSE) and number of words recalled in the control, mild cognitive impairment (MCI) and mild Alzheimer’s disease (AD) groups.
Control (n=15) MCI (n=11) AD (n=11)
Age (years) 71±5 74±5 79±7a,b
Gender (man) 3/15 (20%) 4/11 (36%) 1/11 (9%)
Schooling (years) 12±3 13±4 12±3
MMSE (0–30) 29±1 27±2a 24±4a,b
Word evocation 7.6±1.4 3.3±1.2a 0.9±0.9a,b ap<0.05 versus control (Dunn’s test); bp<0.05 versus MCI (Mann-Whitney’s test)
Figure. Right and left hippocampal volumes observed in the control, mild cognitive impairment (MCI), and mild Alzheimer’s disease (AD) groups. The upper panels show individual values and in the lower panels data are shown as means±standard error of the mean (SEM) in the respective groups.
*p<0.05 versus control group.
V
olume (mL)
V
olume (mL)
V
olume (mL)
CONTROL MCI AD
3
2
1
0
*
V
olume (mL)
CONTROL MCI AD
3
2
1
0
* right hippocampus
CONTROL MCI AD
5
4
3
2
1
0
left hippocampus
CONTROL MCI AD
5
4
3
2
1
0
Our study showed that the right hippocampus was larger than the left one in the control group, thus conirming previous reports26. he group with MCI maintained asymmetry of volume
between the right and left hippocampi, as did the control group. he comparison of hippocampal volume between the three groups in this study demonstrated that the patients with mild AD presented a bilateral decrease in volume, although the ma-jority (91%) still did not present signiicant hippocampus atro-phy, when studied individually, considering the methods em-ployed in the present study. Curiously, Sullivan et al.27 reported
that the reduction in the gray matter of the temporal lobe relat-ed to aging relatively sparrelat-ed the hippocampus in a study com-prising 72 healthy subjects aged between 21 and 70 years.
As far as the patients with MCI are concerned, the results of our study are in agreement with that of Soininen et al.12,
who studied 16 patients with age-associated memory impair-ment and did not ind any diferences in hippocampal volume as compared to a control group. It is important to stress that the concept of age-associated memory impairment difers from MCI, because it is established by comparing the results of memory tests in young adults. hus, maybe this group of patients is at the lowest level of performance for normal aging. However, other studies have demonstrated that the presence of hippocampus atrophy does not necessarily indicate demen-tia progression13 and that patients with MCI that did not
prog-ress to dementia did not present any reduction in hippocam-pus volume in comparison with controls16.
A common limitation is that some neuropsychological tests still lack standard analysis in such disorders. Another important is-sue is the need of a standard nomenclature for the structural and anatomical limits of the hippocampus in order to better interpret results obtained by various groups of investigators6,11,14. Serial
lon-gitudinal time measurements of the hippocampus have also been regarded as particularly relevant in this kind of study8. However,
Table 3. Values of NAA/Cr, mI/Cr, Cho/Cr and mI/NAA obtained on proton spectroscopy of hippocampus in control, mild cognitive impairment (MCI), and mild Alzheimer’s disease (AD) groups.
Control (n=15) MCI (n=11) AD (n=11)
Right Left Right Left Right Left
NAA/Cr 1.38±0.33 1.33±0.15 1.23±0.30 1.26±0.19 1.29±0.32 1.17±0.29
mI/Cr 0.81±0.20 0.85±0.24 0.72±0.20 0.83±0.12 0.75±0.23 0.85±0.14
Cho/Cr 0.87±0.18 0.87±0.14 0.83±0.16 0.78±0.15 0.84±0.13 0.90±0.14
mI/NAA 0.61±0.20 0.64±0.17 0.61±0.24 0.68±0.14 0.61±0.22 0.70±0.18
NAA: N-acetyl aspartate; Cr: creatine; mI: mio-inositol; Cho: choline.
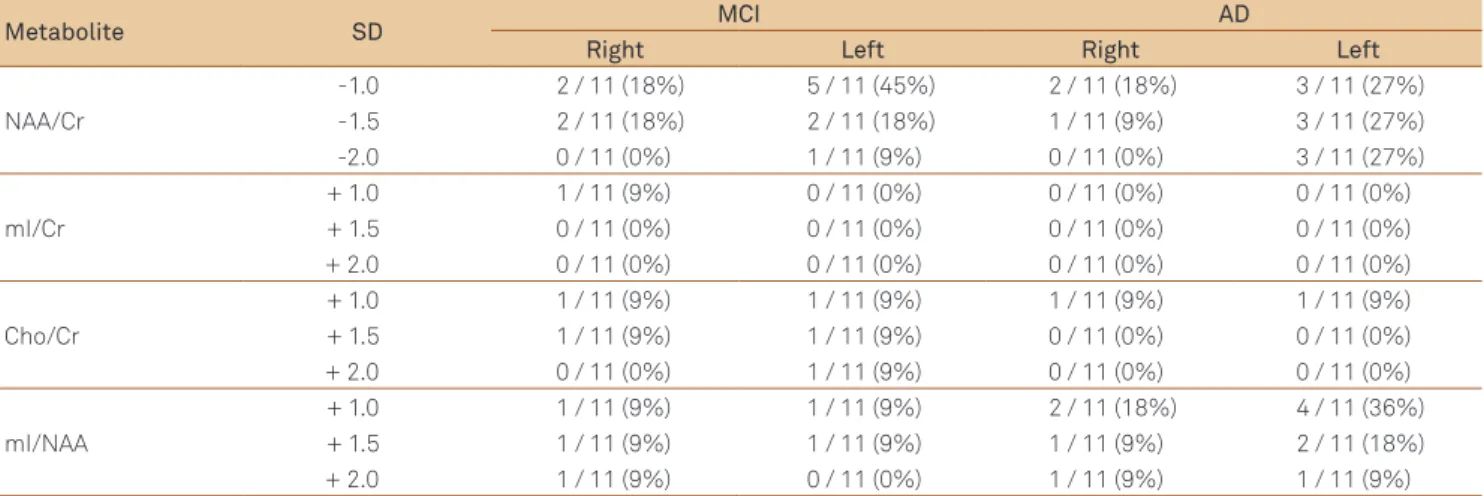
Table 4. Frequency of patients with mild cognitive impairment (MCI) or mild Alzheimer’s disease (AD) using different values of the mean±1.0, 1.5, and 2.0 standard deviations (SD) of each of the hippocampal metabolites analyzed.
Metabolite SD MCI AD
Right Left Right Left
NAA/Cr
-1.0 2 / 11 (18%) 5 / 11 (45%) 2 / 11 (18%) 3 / 11 (27%)
-1.5 2 / 11 (18%) 2 / 11 (18%) 1 / 11 (9%) 3 / 11 (27%)
-2.0 0 / 11 (0%) 1 / 11 (9%) 0 / 11 (0%) 3 / 11 (27%)
mI/Cr
+ 1.0 1 / 11 (9%) 0 / 11 (0%) 0 / 11 (0%) 0 / 11 (0%)
+ 1.5 0 / 11 (0%) 0 / 11 (0%) 0 / 11 (0%) 0 / 11 (0%)
+ 2.0 0 / 11 (0%) 0 / 11 (0%) 0 / 11 (0%) 0 / 11 (0%)
Cho/Cr
+ 1.0 1 / 11 (9%) 1 / 11 (9%) 1 / 11 (9%) 1 / 11 (9%)
+ 1.5 1 / 11 (9%) 1 / 11 (9%) 0 / 11 (0%) 0 / 11 (0%)
+ 2.0 0 / 11 (0%) 1 / 11 (9%) 0 / 11 (0%) 0 / 11 (0%)
mI/NAA
+ 1.0 1 / 11 (9%) 1 / 11 (9%) 2 / 11 (18%) 4 / 11 (36%)
+ 1.5 1 / 11 (9%) 1 / 11 (9%) 1 / 11 (9%) 2 / 11 (18%)
+ 2.0 1 / 11 (9%) 0 / 11 (0%) 1 / 11 (9%) 1 / 11 (9%)
NAA: N-acetyl aspartate; Cr: creatine; mI: mio-inositol; Cho: choline.
he ratio value of metabolites NAA/Cr, mI/Cr, Cho/Cr and mI/NAA did not show any signiicant diferences be-tween controls vs. MCI or mild AD patients. Additionally, there was no asymmetry in the metabolic relations be-tween the two hippocampi. Various studies have mentioned the inding of a fall in NAA/Cr7,19,20,28, with an increase in
mI/Cr7,19, favoring the diagnosis of AD. Some authors report
that in the MCI patients there is an initial reduction in the NAA/Cr ratio20,21. However, others have reported an initial
in-crease in the mI/Cr ratio7,18.
We conclude that the MRI study failed to individually distinguish patients with MCI, mild AD and normal aging.
However, if we consider the three groups of patients, the mild AD ones presented: 1) advanced age; 2) lower scores on the MMSE; 3) lower scores on the word evocation test; 4) loss of asymmetry between the right and left hippocampi; and 5) re-duction in the volume of the hippocampi.
ACKNOWLEDGMENT
he authors wish to acknowledge H. Cartaxo, MD and P.B. Santos Filho, PhD,for their help during the volumetric and spectroscopic MRI evaluation.
1. Petersen RC, Smith GE, Waring SC, et al. Mild cognitive impairment: clinical characterization and outcome. Arch Neurol 1999;56:303-308. 2. Squire LR. Memory and the hippocampus: a synthesis from indings
with rats, monkeys and humans. Psychol Rev 1992;99:195-231. 3. Rombouts SA, Barkhof F, Veltman DJ, et al. Functional MR imaging in
Alzheimer’s disease during memory encoding. AJNR Am J Neuroradiol 2000;21:1869-1875.
4. Scheltens P, Leys D, Barkhof F, et al. Atrophy of medial temporal lobes on MRI in “probable” Alzheimer’s disease and normal ageing: diagnostic value and neuropsychological correlates. J Neurol Neurosurg Psychiatry 1992;55:967-972.
5. Wang H, Shu L, Xie J, Zhang H, Zhang D. Diagnostic utility of neuropsychological performance and quantitative MRI-based
measurement in Alzheimer’s disease. Alzheimer Dis Asssoc Disord 2004;18:163-170.
6. Jack CR Jr, Petersen RC, Xu YC, et al. Medial temporal atrophy on MRI in normal aging and very mild Alzheimer’s disease. Neurology 1997;49:786-794.
7. Kantarci K, Jack CR Jr., Xu YC, et al. Regional metabolic patterns in mild cognitive impairment and Alzheimer’s disease: a 1HMRS study. Neurology 2000;55:210-217.
8. Metlzer CC. Imaging markers for dementia and neurodegenerative disease. Symposium 2004: Integration of Imaging Strategies in Neuroradiology. ASNR 2004;63-64.
9. Ross BD. The Biochemistry of living tissues: Examination by MRS. NMR Biomed 1991; 4:59-63.
10. McClure RJ, Kanfer JN, Panchalingam K, Klunk WE, Pettegrew JW. Magnetic resonance spectroscopy and its application to aging and Alzheimer’s disease. Neuroimaging Clinics of North American 1995;5:69-87.
11. Jack CR Jr, Petersen RC, O’Brien PC, Tangalos EG. MR-based hippocampal volumetry in the diagnosis of Alzheimer’s disease. Neurology 1992;42:183-188.
12. Soininen HS, Partanen K, Pitkänen A, et al. Volumetric analysis of the amygdala and the hippocampus in subjects with age-associated memory impairment: correlation to visual and verbal memory. Neurology 1994;44:1660-1668.
13. Swann A, O’Brien J, Ames D, Schweitzer I, Desmond P, Tress B. Does hippocampal atrophy on MRI predict cognitive decline? Prospective follow-up study. Int J Geriatr Psychiatry 1997;12:1182-1188. 14. Laakso MP, Soininen H, Partanen K, et al. MRI of the hippocampus
in Alzheimer’s disease: sensitivity, speciicity, and analysis of the incorrectly classiied subjects. Neurobiol Aging 1998;19:23-31. 15. Petersen RC, Jack CR Jr, Xu YC, et al. Memory and MRI-based
hippocampal volumes in aging and AD. Neurology 2000;54:581-587. 16. Chao LL, Schuff N, Kramer JH, et al. Reduced medial temporal
lobe N-acetylaspartate in cognitively impaired but non-demented patients. Neurology 2005;64:282-289.
17. Stoppe G, Bruhn H, Pouwels PJ, Hanicke W, Frahm J. Alzheimer disease: absolute quantiication of cerebral metabolites in vivo using localized proton magnetic resonance spectroscopy. Alzheimer Dis Assoc Disord 2000;14:112-119.
18. Huang W, Alexander GE, Chang L, et al. Brain metabolite concentration and dementia severity in Alzheimer’s disease. Neurology 2001;57:626-632. 19. Martinez-Bisbal MC, Arana E, Marti-Bonmati L, Molla E, Celda B.
Cognitive impairment: classiication by 1H magnetic resonance spectroscopy. Eur J Neurol 2004;11:187-193.
20. Frederick BD, Lyoo IK, Satlin A, et al. In vivo proton magnetic resonance spectroscopy of the temporal lobe in Alzheimer’s disease. Prog Neuropsychopharmacol Biol Psychiatry 2004;28:1313-1322.
21. Chantal S, Braun CM, Bouchard RW, Labelle M, Boulanger Y. Similar 1H magnetic resonance spectroscopic metabolic pattern in the medial temporal lobes of patients with mild cognitive impairment and Alzheimer disease. Brain Res 2004;1003:26-35.
22. McKhann G, Drachman D, Folstein M, Katzman R, Price D, Stadlan EM. Clinical diagnosis of Alzheimer’s disease: report of the NINCDS-ADRDA work group under the auspices of the Department of Health and Human Services Task Force on Alzheimer’s disease. Neurology 1984;34:839-944.
23. Berg L. Clinical Dementia Rating (CDR). Psychopharmacol Bull 1988; 24: 637-639.
24. Free SL, Bergin DR, Fish MJ, et al. Methods for normalization of hippocampal volumes measured with magnetic resonance. Am J Neuroradiol 1995;16:637-643.
25. Kesslak JP, Nalcioglu OS, Cotman CW. Quantiication of magnetic resonance scans for hippocampal and parahippocampal atrophy in Alzheimer’s disease. Neurology 1991;41:51-54.
26. Watson C, Andermann F, Gloor P, et al. Anatomic basis of amygdaloid and hippocampal volume measurement by magnetic resonance imaging. Neurology 1992;42:1743-1750.
27. Sullivan EV, Marsh L, Mathalon DH, Lim KO, Pfefferbaum A. Age-related decline in MRI volumes of temporal lobe gray matter but not hippocampus. Neurobiol Aging 1995;16:591-606.