Journal of Housing for the Elderly, 2016, available online: http://www.tandfonline.com/10.1080/02763893.2016.1224791 For citation purposes please refer to the published version
Almeida, M. F. (2016). Age-Friendly Walkable Urban Spaces: A Participatory Assessment Tool. Journal of Housing For the Elderly, 30(4), 396–411. https://doi.org/10.1080/02763893.2016.1224791
Title:
Age-friendly walkable urban spaces: A participatory assessment tool
Author: Mariana F. Almeida1Abstract: Creating active living age-friendly communities requires new methods to assess public spaces and to engage older citizens in healthy urban planning. The paper presents the development and piloting of a participatory group tool to evaluate and rate the quality of streets for walking from the viewpoint of older adults, designed as a simple and practical perceived built environment measure for action and research purposes. The pilot study, undertaken in two Lisbon Region cities, in Portugal, involved 32 older residents and local partners.
Keywords: Walking, Older adults, Healthy communities, Built Environment, Participation, Healthy Urban Planning
BACKGROUND
“Creating healthy and supportive environments for health and well-being for all ages” is a priority area in World Health Organization’s (WHO) strategy for healthy ageing in Europe 2012-2020 and for Health 2020 (WHO, 2012, p. 10), and a goal gradually capturing the attention of a wide range of actors and disciplines. Ensuring a ‘better fit’ between ageing populations and urban environments is recognized as a matter of urgency within social policy, an important strategy for local action on health equity, and a key issue for sustainable inclusive urban planning (Barton et al., 2009; Buffel et al., 2012; Kendig & Phillipson, 2014; Lui et al., 2009; Phillipson, 2011).
An increasing body of research is showing the influence of the environment, namely at neighbourhood level, on older adults’ health, functioning and wellbeing (Clarke & Nieuwenhuijsen, 2009; Yen et al., 2009). The relevant dimensions and features, and, more generally, how to conceptualize and implement
1
Affiliation: University of Lisbon, Institute of Social Sciences, Instituto do Envelhecimento Contact: Mariana F. Almeida [email protected]
friendly communities (Buffel et al., 2012; Cachadinha, 2012; Greenfield, 2011; Lui et al., 2009; Menec et al., 2011; Phillipson, 2011; Plouffe, Kalache, 2010; Wahl et al., 2012), are nonetheless still an open discussion, with WHO Age-friendly Cities concept and network probably being the most widely adopted model worldwide (WHO, 2007).
One area that is receiving significant attention in recent years is the creation of walkable public spaces and active living communities (Sallis et al., 2006). Mounting evidence on the importance of social and physical environment variables for physical activity, mobility and participation, health, independence, ability to ‘age in place’ and quality of life of older adults (Van Cauwenberg et al., 2011; Cunningham & Michael, 2004; Kerr et al., 2012; Moran et al., 2014; Richard et al., 2009; Rosso et al., 2011), underline the gains of an alliance between public health and urban planning to design and adapt streets that support safe walking for people of all ages and abilities. There are however gaps and inconsistences in the findings, as well as insufficient progress in implementation (Kerr et al., 2012), leading to calls for innovative methods and measurement development. Improvement in measures of built environment features is pointed as essential to advance this domain, covering spatially rooted subjective and objective measures, including a focus on local microscale data, and attention to the relevance to specific population subgroups (Brownson et al., 2009; Burton et al., 2011; Rosso et al., 2011; Schaefer-McDaniel et al., 2010; Yen et al., 2009; Van Cauwenberg et al., 2011; Weiss et al., 2010). The creation of simple and reliable measures usable by community groups is also pointed to as a useful endeavour (Brownson et al., 2009). Such tools are crucial for research but also to support evidence-based decision-making, allowing for prioritizing, baseline assessment and evaluation of change. If additionally conceived as a means to involve older adults in the planning process - a critical
prerequisite for developing ‘age-friendly cities’ – measurement tools will simultaneously add to the repertoire of new methods more suitable for participatory research, intervention and advocacy work that are being called for (Buffel et al., 2012; Buman et al., 2011; Yen et al., 2009).
Environmental measurement tools with regard to walkability have been described and categorized according to several attributes, including: objective vs perceived measures (Rosso et al., 2011; Van Cauwenberg et al., 2011; Yen et al., 2009), indoor individual or focus group interviews vs spatial methods (Moran et al., 2014), unit of observation (e.g. predetermined spatial unit vs the individual residential environment - Burton et al., 2011), qualitative vs quantitative data, and individual vs group methods (e.g. Moran et al., 2014). Although there is a growing and diversified range of measures, including some designed specifically with older adults in mind or at least sensitive to this group’s needs, those currently available do not yet cover all the desirable combinations of characteristics. Existing instruments designed to collect primary data on built environment might be grouped in three broad sets, each having its own applicability and limitations:
Observational audit tools typically aim to capture descriptive, objective data (e.g. presence and qualities) on specific street-level attributes. These outdoor measures permit systematic coding and quantification as well as georeferencing of observations (e.g. Brownson et al., 2009; Chaudhury et al., 2011). Examples of such tools designed with older adults in mind are the CDC-HAN “Environmental Audit Tool – HEAT” (CDC-HAN, v2009), the “Revised Senior Walking Environmental Audit Tool - SWEAT-R” (Michael et al., 2009), “The Neighbourhood Design Characteristics Checklist – NeDeCC” (Burton et al., 2011), and the “Walking Route Audit Tool – WRATS” (Kerr e Rosenberg, v2009). Usually trained observers are used, although older adults might also be involved in collecting audit data with such instruments. But in any case the goal is to obtain an objective assessment (inter-rating reliability being a central property of observational audit tools), and as such this type of methodology does not, by definition, capture older adults’ subjective perceptions and evaluations of the environment –an obvious handicap from a participatory perspective.
There is a well-established tradition of perceived-environment measures that directly questions citizens on their (subjective) perceptions, using surveys (via interview or self-administered
questionnaire) to collect self-reported, quantitative data. The “Neighborhood Environment
Walkability Scale” (NEWS, or the abbreviated NEWS-A) is cited as the tool of this type most frequently used internationally (Brownson et al., 2009), with modified versions for seniors also existing (e.g. Paisana-Morais et al., 2014; Starnes et al., 2015). These are indoor interview methods, that typically focus on the respondent’s (self-defined) neighbourhood, thus not primarily adapted to an in-depth analysis of a particular geographical unit. Moreover by favouring standardized, quantitative, individual data collection this type of tool presents significant shortcomings in terms of opportunities for
meaningful input and participatory engagement of older adults.
Spatial qualitative methods could be identified as a third, more heterogeneous, group of tools, comprising techniques such as photo-voice, walk-along interviews, or virtual reality experiments, as exemplified in a recent review of qualitative studies by Moran et al. (2014), as well as other outdoor methods and techniques used in the context of urban planning and community participation
processes (e.g., WHO, 2002). While allowing for georeferencing, and a rich, open-ended input from older citizens, these methods tend to be resource-demanding not only in terms of time but also of training of the organizers and the results don’t lend themselves easily to comparisons (e.g. across time, sites).
Thus for planning and research purposes it was considered useful to develop a tool to collect information on public space walkability that, unlike the above methods, allows for gathering
subjective perceptions of older people regarding specific spatial units, while simultaneously offering enough standardization so as to simplify coding and interpretation, as well as implementation by local agents with no training or experience in participatory and/or urban planning methods. A health and
ageing ecological theoretical framework (Greenfield, 2011; Menec et al., 2011; Sallis et al., 2006; Wahl et al., 2012) and an action-oriented health promoting approach recommend methods that allow for combining objective and perceived environment measures (e.g. Van Cauwenberg et al., 2011), promote active and meaningful involvement of community members and deliver actionable outputs (Buman et al., 2011).
This paper presents the development and piloting of SeGAPe (Seniors’ Group Assessment of Pedestrian Environment), a participatory instrument to evaluate and rate the quality of streets for walking from the viewpoint of older adults in a Portuguese urban context. The tool aims to be a practical, systematic method to assist in conducting a structured assessment of walkability conditions and improvement opportunities, acknowledging older citizen’s experience, and directly engaging them in the planning process of age-friendly urban public spaces. Producing quantified results
comparable across different sites and time points and applicable to delimited small scale geographical units, such a subjective assessment tool can directly support decision-making processes, as well as facilitate combination with other georeferenced data, including objective measures of built environment.
SeGAPe is based on the Community Street Review (CSR) methodology supported by the New Zealand Transport Agency (Abley et al., 2010). Adaptations were made to account for specificities of
Portuguese context and the user perspective of older pedestrians. Pilot testing was carried out in 6 urban neighbourhoods in the Region of Lisbon, Portugal. The goals of this piloting study are twofold: to examine the ease of use, satisfaction and perceived usefulness of the tool from the participants and stakeholders perspective; and to explore measurement properties and underlying structure of the evaluation of walkability made by older adults.
METHODS The tool: SeGAPe
SeGAPe was developed following an extensive review of literature on walkability, and instruments and methods to conduct street audits. The Community Street Review, commissioned by New Zealand governmental agencies and developed by transportation and health experts (Abley et al., 2010), was identified as a useful template “where a community street audit and a rating system are combined”, creating an easy to use “nationally recognized standard for measuring walkability using peoples’ perceptions” (ibidem, pp. 6, 8). After obtaining the authors permission, the original CSR tool was translated into Portuguese and adapted, with some items being introduced or modified taking into account features that research has identified as relevant for walkability of older adults. Consultation
with experts (practitioners and researchers from social and urban planning areas) at various stages of the development process, and a field pre-test (with participants aged between 56 and 71 years), led to further refinement of the tool.
The resulting version of SeGAPe, like the original CSR, includes two forms, Street Segment and Crossing, for assessing two types of sections: Street Segments (corresponding usually, but not necessarily, to a sidewalk length between two intersections or one block-face) and pedestrian
Crossings. Both forms have the same three-part structure: Evaluation of walkability dimensions (rated on 7 points scales, from Very bad to Very good); Improvement items (opinion on potential impact of each modification on walkability, using 3 levels: None, A little, A lot); Comments (open answers regarding existing Problems and possible Improvements). The forms used in the pilot tests2 included the following items:
i) The Street Segment form comprises a total of 27 questions:
- 10 Evaluation scales: Overall walkability scale and 9 sub-dimensions (Safety from traffic; Safety from falling; Safety from crime; Obstacles; Efficiency; Comfort and Effort; Orientation/wayfinding; Destinations; Pleasantness);
- 15 Improvement items (e.g. less traffic; gentler slope/no steps); - 2 Comment questions.
ii) The Crossing form comprises a total of 23 questions:
- 7 Evaluation scales: Overall walkability scale and 6 sub-dimensions (Safety from traffic; Safety from falling; Obstacles; Delay; Directness; Orientation/wayfinding);
- 14 Improvement items (e.g. narrower roadway; longer “walk” signal time); - 2 Comment questions.
It should be noted that the Evaluation of walkability component is universally applicable and the quantified ratings it produces are comparable across street segments or crossings, thus
recommending standardization of content and administration. On the other hand, improvement items are dependent upon the context. In order to maximize relevance, this component, as well as
Comments, might therefore be adapted to the specific environment and aims of the audit. A protocol and support materials for undertaking SeGAPe were also developed, again using the original CSR (Abley et al., 2010) as a model.
SeGAPe is designed to be filled during a group “walkabout” involving a minimum of 5 and a maximum of 8 participants (suggested age: 55 years and older), a group size recommended for CSR so as to
2
ensure enough data for analysis but still remain manageable outdoors (ibidem). The group, accompanied by a team leader, walks through and assesses a pre-determined route, typically
including 4-5 sections, Street Segments and Crossings (the number depending on the length, distance from departure point, and other characteristics of the sections and the participants). The walking audit is preceded by a briefing, indoors, where the participants are welcomed and the aims of the audit, procedures and materials are discussed. When there are more than 8 participants, smaller groups are organized and meet the respective team leader. Each participant receives a clipboard, a pen, and a form for each section to be assessed as well as a guideline sheet with prompts and examples defining the Evaluation scales. The team leader(s) is equipped with the same materials, along with a map of the route, and a form for registering the procedures. A camera to document relevant aspects of the route is also desirable. The briefing and distribution of equipment take about 1 hour, after which the audit is performed. The walking audit outdoors takes about 60-75 minutes. Afterwards, back in the meeting room, the participants fill a form with personal details and feedback, followed by a short group discussion of the procedures. Allotting less than 45 minutes for these final indoors proceedings (that can include a light snack), the whole session will take about 3 hours. At a later date another session is arranged to present and discuss the results of the audit with the participants, and possibly other stakeholders.
Piloting sample and administration
The piloting was done in two different contexts, involving 32 older adults that audited 6 routes in as many neighbourhoods of two Portuguese cities (Lisbon and Odivelas), totalling 25 assessed sections (19 street segments and 6 crossings). Given that each section was audited by several participants, a total of 155 forms were filled (123 Street Segment and 32 Crossing forms).
Less than a third (N=10) of the participants were men. The mean age was 67 years, ranging between 57 and 84 years old. Education level varied between 3 years of schooling and master degree, the majority having less than 9 years of schooling. About 80% of the participants reported walking at least 150 minutes the previous week, and almost two thirds walked every day for at least 10 minutes. Only one participant mentioned significant mobility limitations, being nevertheless able to walk without assistance, and one other reported substantial vision impairment.
The sites and administration conditions of the pilots were chosen so as to test the tool in different circumstances - although all locations were urban areas with high percentages of older residents. In the city of Odivelas the audit was done in the context of an on-going partnership of the main
researcher’s University with the local authority, as part of the initial stages of the Age-Friendly Cities project the municipality is promoting. In the city of Lisbon the local partner was a charity that
promotes socio-cultural activities for diverse publics, including older adults - thus an organisation with no mandate pertaining to urban planning or age-friendly cities. The audit in Lisbon involved only one group/one site (6 participants). In Odivelas 5 audits were conducted simultaneously, the 26
participants coming together for the briefing and debriefing, led by the researcher, and then splitting into 5 different groups (each accompanied by a team leader and in some cases an additional helper) for the walkabouts; each group thus audited a different route, except for the first section, a Street Segment that was assessed by all the participants.
The 6 audited sites were selected so as to include key city areas for older adults, as well as different types of built and socio-economic environments (health centre, local market, transit/metro station area, historical neighbourhood, residential neighbourhood, mix business-commerce-residential area). The sections in each route, contiguous or close by, were also chosen with a view to further diversify the walking conditions.
In both contexts the audits were conducted during a summer afternoon (June 2013, July 2014), with clear and warm weather conditions. The participants were recruited by the local partners, that publicised the activity through their usual communication channels and amongst beneficiaries of other activities, a process complemented by a public talk on age-friendly walkable cities and a discussion of the project, conducted by the researcher. The pilots followed the general SeGAPe protocol, in addition to which the participants were asked to fill a detailed Feedback questionnaire to provide usability information (32 questions, pertaining to the forms, briefing, walking route and overall activity organization). Verbal input from the users (participants and local partners) was also requested, as part of the debriefing and, later, in the results presentation sessions.
Analysis
Field piloting of the tool aimed at testing SeGAPe’s usability (ease and pleasantness of use) and utility (providing the needed features) in different contexts, as well as exploring the underlying structure of the walkability Evaluation scales.
To examine the usability of the tool, results from the Feedback questionnaire were analysed. Data reported here (frequencies) refer only to participants’ opinions on SeGAPe’s forms and overall procedure, items that are not context specific. This is complemented with qualitative input from users.
To explore measurement properties and underlying structure of the tool audit results, analyses were then performed. These are applied only to the walkability evaluation dimensions scales - the
Basic descriptive data, along with one-way analysis of variance (ANOVAs) comparing mean ratings across sections, are presented so as to determine whether the scales were useful for differentiating the audited sections. Given the results and the smaller sample and heterogeneity of audited Crossings, subsequent analyses focus only on Street Segments data.
The applicability of reliability measures like inter-item correlations (Cronbach’s alpha) and factor analyses to perceived environment measures is not a matter of consensus and poses, at best, difficulties of interpretation, as Brownson and colleagues (2009) point out. They may however be useful to identify groups of variables (ibidem) and as such were computed for the Street Segment Evaluation dimensions of SeGAPe. The extraction method used is Principal Component Analysis (PCA), and the rotation method Varimax with Kaiser Normalization.
All the statistical analyses were conducted in SPSS version 21.0.
RESULTS AND DISCUSSION SeGAPe’s usability
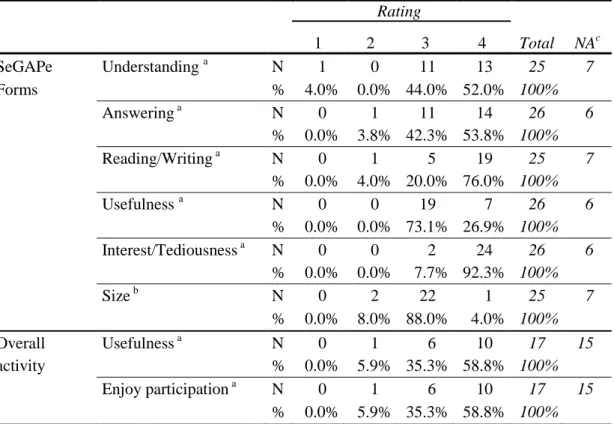
Results from the feedback questionnaire on the use of the tool are shown in Table 1 (frequencies of items pertaining to forms and overall activity). Overall participants’ reactions to SeGAPe forms were favourable on all the issues queried. The majority considered the forms not at all tedious (92%), of adequate size (88%), and with a quite useful content (73%). Only one person (4%) mentioned having a lot of difficulties understanding questions, the majority having no difficulties at all (52%). One
participant also reported quite a few difficulties in answering and another in reading/writing on the forms, while most of the respondents had no problems with any of these issues (54% and 76% respectively).
On the whole, participants enjoyed very much taking part in the procedures (59%), the majority seeing this kind of activity as very useful for obtaining people’s perspective (59%), with again one respondent (6%) answering “a little” to both of these questions.
Participants’ qualitative feedback on the activity (obtained through open questions in the
questionnaire and debriefing discussions) likewise valued the opportunity to give an opinion about the city and to do something useful, as well as the social interaction the event afforded and the added awareness on walkability issues and local situation.
The municipality staff directly involved in the administration in Odivelas (social department staff, frequently involved in activities with older people but with no experience in urban planning issues) also provided qualitative feedback on the tool use. The procedures were seen as simple enough to organize, and leading the groups of the participants in the walkabouts did not pose any significant difficulties. The results obtained were judged as credible and useful, strong interdepartmental collaboration throughout the process being however deemed key for effective follow-through of audit results.
Table 1. Participants’ feedback regarding the tool: Frequencies (N and %) of opinions about the forms and overall activity
Rating 1 2 3 4 Total NAc SeGAPe Understanding a N 1 0 11 13 25 7 Forms % 4.0% 0.0% 44.0% 52.0% 100% Answering a N 0 1 11 14 26 6 % 0.0% 3.8% 42.3% 53.8% 100% Reading/Writing a N 0 1 5 19 25 7 % 0.0% 4.0% 20.0% 76.0% 100% Usefulness a N 0 0 19 7 26 6 % 0.0% 0.0% 73.1% 26.9% 100% Interest/Tediousness a N 0 0 2 24 26 6 % 0.0% 0.0% 7.7% 92.3% 100% Size b N 0 2 22 1 25 7 % 0.0% 8.0% 88.0% 4.0% 100% Overall Usefulness a N 0 1 6 10 17 15 activity % 0.0% 5.9% 35.3% 58.8% 100% Enjoy participation a N 0 1 6 10 17 15 % 0.0% 5.9% 35.3% 58.8% 100%
Notes: (a) 4-levels scale, 1 being the least favourable and 4 the more favourable opinion (None to A lot, or vice versa, depending on whether rating a positive or negative issue)
(b) 1=Too long; 2=A little long; 3=Adequate; 4=Could be longer (c) NA= No answer
In conclusion, the tool is largely experienced by participants and local practitioners (with no previous experience in such domain) as easy to administer, useful and a pleasant experience. Subsequent to testing, further refinements were made3, notably to reduce difficulties in understanding some items. While SeGAPe in its present format cannot be used with illiterate participants, the piloting indicates it is suitable for older adults with minimum schooling. It should be noted, however, that as the pilot study did not involve participants with severe mobility or sensory limitations or significant frailty, SeGAPe’s usability remains thus to be verified with more impaired participants.
In terms of SeGAPe’s outputs, quantitative evaluation ratings, lending themselves to easy map representation and allowing for a ranking of sections potentially suggestive for determining priorities in intervention, seem particularly valuable. Qualitative comments on the sections by the participants, either registered in the forms or in subsequent group discussion, remain however an important complement, helping to identify objective environment features that underlie walkability perceptions.
3
Forms and support materials (in Portuguese) revised following piloting available at: http://www.ienvelhecimento.ul.pt/182.
Variations of the Comment questions, methods and discussion prompts, and even complementary use of other qualitative techniques, could be envisioned (e.g., Handler, 2014) to elicit richer data. In the same spirit, SeGAPe’s Improvement items might be removed or added, to respond to particular audit circumstances and aims.
SeGAPe’s results, measurement properties and underlying structure
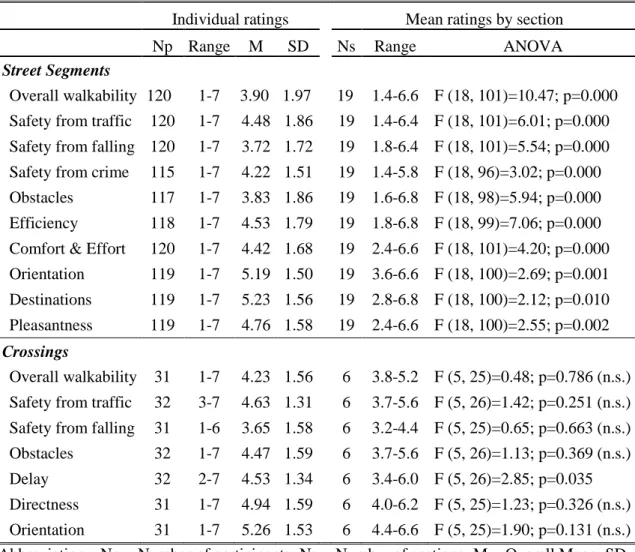
SeGAPe assessment results on the Evaluation dimensions of the tool are obtained computing the mean ratings of the group of participants that audited each section. Table 2 summarizes mean, standard deviation and range (maximum and minimum values) for the totality of individual ratings collected, as well as the range of assessment results (mean ratings) of the examined sections. It also presents ANOVA results comparing assessments by section.
Table 2. Individual and section ratings of SEGAPe’s Evaluation Dimensions: Descriptives and ANOVA
Individual ratings Mean ratings by section
Np Range M SD Ns Range ANOVA
Street Segments
Overall walkability 120 1-7 3.90 1.97 19 1.4-6.6 F (18, 101)=10.47; p=0.000 Safety from traffic 120 1-7 4.48 1.86 19 1.4-6.4 F (18, 101)=6.01; p=0.000 Safety from falling 120 1-7 3.72 1.72 19 1.8-6.4 F (18, 101)=5.54; p=0.000 Safety from crime 115 1-7 4.22 1.51 19 1.4-5.8 F (18, 96)=3.02; p=0.000 Obstacles 117 1-7 3.83 1.86 19 1.6-6.8 F (18, 98)=5.94; p=0.000 Efficiency 118 1-7 4.53 1.79 19 1.8-6.8 F (18, 99)=7.06; p=0.000 Comfort & Effort 120 1-7 4.42 1.68 19 2.4-6.6 F (18, 101)=4.20; p=0.000 Orientation 119 1-7 5.19 1.50 19 3.6-6.6 F (18, 100)=2.69; p=0.001 Destinations 119 1-7 5.23 1.56 19 2.8-6.8 F (18, 100)=2.12; p=0.010 Pleasantness 119 1-7 4.76 1.58 19 2.4-6.6 F (18, 100)=2.55; p=0.002 Crossings
Overall walkability 31 1-7 4.23 1.56 6 3.8-5.2 F (5, 25)=0.48; p=0.786 (n.s.) Safety from traffic 32 3-7 4.63 1.31 6 3.7-5.6 F (5, 26)=1.42; p=0.251 (n.s.) Safety from falling 31 1-6 3.65 1.58 6 3.2-4.4 F (5, 25)=0.65; p=0.663 (n.s.) Obstacles 32 1-7 4.47 1.59 6 3.7-5.6 F (5, 26)=1.13; p=0.369 (n.s.) Delay 32 2-7 4.53 1.34 6 3.4-6.0 F (5, 26)=2.85; p=0.035 Directness 31 1-7 4.94 1.59 6 4.0-6.2 F (5, 25)=1.23; p=0.326 (n.s.) Orientation 31 1-7 5.26 1.53 6 4.4-6.6 F (5, 25)=1.90; p=0.131 (n.s.) Abbreviations: Np = Number of participants; Ns = Number of sections; M = Overall Mean; SD = Standard Deviation; n.s. = non-significant at p < 0.05.
For Street Segments, individual ratings cover the entire range of the scales (1 to 7, with 7 being the most positive score), for all the Evaluation dimensions of the tool. Assessments of the 19 sections audited also vary widely for most of the dimensions. The smallest range of variation (3 points) is observed for the Orientation dimension. 7 of the 10 Evaluation dimensions obtained a mean rating close to the maximum value (equal or above 6.6 points in at least one of the audited sections. For the majority of the dimensions the most negative section assessments observed were not however as close to the minimum value, with just 3 of them attaining 1.4 as the lowest mean rating. All the Evaluation dimensions prove useful to differentiate Street Segments, mean ratings being significantly different by section at the p≤0.01 level (Destinations and Pleasantness) or p≤0.001 level (the other eight scales).
A different situation is observed for Crossings results. Individual ratings and mean ratings for the 5 sections audited mostly vary on a narrower range, and the assessments in the Evaluation dimensions were not significantly (p<0.05) different between sections, except for Delay.
This is not unexpected given the small sample and limited variation in the characteristics of the Crossing sections audited. But it also confirms the available data is not adequate for more in-depth exploration of the structure of the Crossings’ form of the tool.
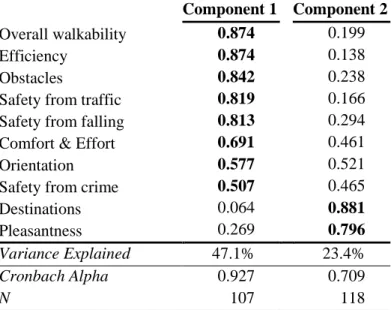
Results of the exploratory PCA performed on Street Segments walkability Evaluation dimensions (Table 3) show very good adequacy of the data to the procedure (KMO=0.903 and Bartlett's Test of Sphericity significant, p<0.001), with all scales fitting well with the extraction solution (communalities 0.47).
Table 3. Principal Components Analysis of Street Segments’ evaluation dimensions Component 1 Component 2
Overall walkability 0.874 0.199
Efficiency 0.874 0.138
Obstacles 0.842 0.238
Safety from traffic 0.819 0.166
Safety from falling 0.813 0.294
Comfort & Effort 0.691 0.461
Orientation 0.577 0.521
Safety from crime 0.507 0.465
Destinations 0.064 0.881
Pleasantness 0.269 0.796
Variance Explained 47.1% 23.4%
Cronbach Alpha 0.927 0.709
N 107 118
Extraction Method: Principal Component Analysis. Rotation Method: Varimax with Kaiser Normalization.
The analysis points to the existence of two main underlying concepts that together explain 70.5% of total variance, and have high internal consistency as measured by Cronbach’s alpha (Table 3). The first one might be interpreted as Basic Walking Conditions. Loadings show this component to be most highly correlated with the assessment of Overall walkability and dimensions that pertain essentially to street and sidewalk infrastructures and engineering variables (Efficiency, Obstacles, Safety from traffic and from falling). The second can be taken to refer to Incentives for Walking, being strongly correlated with assessments of Destinations and Pleasantness. Three other dimensions, Comfort and Effort, Orientation and Safety from Crime, although loading higher on the first component actually bridge the two. A situation compatible with the above interpretation, as all of these can compromise the basic walkability of a street, at least in more extreme situations, and are partially dependent on
characteristics of the physical environment. But they are also influenced by “soft” aspects of the environment and can significantly add or detract from the Incentives and subjective experience of travelling on a particular street.
Such results are not directly comparable with other research we know of, given the distinctive nature of the SeGAPe tool (a subjective yet quantitative and spatial measure) and population. The study of Paisana-Morais et al. (2014), conducted with older adults in Portugal, using an adaptation of a NEWS version (Neighbourhood Environment Walkability Scale, an indoor questionnaire of perceived design features) is however worth mentioning. The authors arrived at 4 factor exploratory factor analysis solution: Physical Conditions of the neighbourhood was the first factor, as in the present analysis, not including however Security features, which formed a separate (3rd) factor; factors 2 and 4, Aesthetics and Proximity of Destinations, might also be seen of as a split-up of the sub-dimensions underlying the Incentives for Walking component obtained with SeGAPe. Paisana-Morais’ results fit well with the four main features of the Pikora conceptual framework for the assessment of environmental
determinants of active travel (Pikora et al., 2003) - Functionality, Safety, Aesthetics and Destinations – , also reflected in other empirical studies (Keast et al., 2010) and reviews (Moran et al., 2014). The analysis thus suggest two major themes underlying SeGAPe street walkability scales - Basic Walking Conditions and Incentives for Walking -, that seem compatible with an aggregation of the above-mentioned four key domains found in empirical and theoretical literature. This hypothesis, to be confirmed by further application of the tool in a wider sample and range of environmental conditions, provides guidelines for interpreting and matching SeGAPe’s results with other data sources (e.g. technical audits), also feeding into the debate on older adults perceptions of walkability friendliness. Retaining all the tool Street Segment’s sub-dimensions seems nonetheless advisable because of the added richness of information provided, both for research and decision-making purposes.
One limitation of the present study is that participants did not include older adults with significant impairments, the usability of the tool with such subpopulations thus remaining untested. Another limitation was the small number of audited sections, notably Crossing sections, preventing meaningful exploration of the respective results. Higher variation of Street Segments would also benefit the analysis of tool properties. Random selection of sections and inclusion of more extreme unfavourable conditions was not possible in an action-research project of this nature, that has to take into account stakeholders interests and cannot put the participants at risk. For the same reasons of partners and participants convenience, test-retest reliability could not be envisioned. Additional analysis of psychometric properties of the tool, namely convergent validity, is another desirable endeavour, but one that requires measures validated for the same context and population.
CONCLUSIONS
Creating and adapting age-friendly active living cities, growingly recognized as an important health policy strategy, requires new methods, that are suitable to intersectoral action and transdisciplinary approaches (Sallis et al., 2006), promote the involvement of older adults in urban planning and regeneration (Buffel et al., 2012), and add to the still inconclusive body of evidence on which specific environmental features influence utilitarian walking in this population group.
This paper reports the development and pilot testing of one such walkability audit tool, a measure of perceived pedestrian urban environment, quantitative, administered on a delimited spatial context, through a small group walking tour involving older adults. This type of instrument fills an important research and implementation gap, being the only methodology we are aware of with those
characteristics, quantifiable subjective measures reported in health-environment research typically being indoor interview methods, whereas spatial methods are usually employed either for objective measurement (observational, descriptive, audits) or in the context of qualitative approaches. Administration in a group context offers additional potential for promoting active and meaningful community involvement when used as part of a participatory process.
The pilot study shows SeGAPe to be a user friendly tool, suitable for engaging older citizens in assessing how walkable and age-inclusive are public spaces. It is a systematic, easy to apply method, ready to be used even by practitioners with no previous experience in urban planning issues or participatory approaches.
Results indicate that the street Evaluation scales included in SeGAPe – Overall walkability, Efficiency, Obstacles, Safety from traffic, Safety from falling, Comfort and Effort, Orientation, Safety from crime, Destinations and Pleasantness - were useful for assessing and differentiating street segments in the piloting context (6 urban neighbourhoods in Lisbon Region, Portugal, audited by older adults, with no major mobility or sensorial limitations). An exploratory PCA further suggests that these Evaluation
dimensions could be organized around two main underlying concepts, Basic Walkability Conditions and Incentives for Walking, a structure that might be seen as a simplification of the four key domains - Functionality, Safety, Aesthetics and Destinations - found in other empirical and theoretical literature (e.g. Pikora et al., 2003), and whose generalizability warrants further research.
Even if the reported pilot study was conducted in the specific context of an action-research project, with older population in Portuguese urban areas, the methodology, itself based on CSR already in use in New Zealand, shows potential to be extended to a wider range of situations and aims, a matter calling for additional experimentation. As part of a community audit undertaken by local agencies, either from social/health or urban/transport sectors, it can support policy decisions and interventions, providing a comparable baseline and impact assessment measure. Likewise, it can function as
lobbying tool, empowering older residents to proactively engage with local authorities in collective, community-based urban action . Although further testing of its psychometric properties is advisable, it also shows promise as part of the repertoire of new research methods argued to be urgently required to understand the urban living experiences of older adults who are ‘ageing in place’. Either for
planning or research purposes, the subjective quantitative ratings obtained with SeGAPe should ideally be combined with objective environmental data (e.g. resulting from observational, technical audits and/or secondary Geographic Information Systems-GIS data), an integration facilitated by the spatially anchored nature of SeGAPe’s assessments. Furthermore, it can easily be extended by mapping, public participation GIS, or other rich qualitative techniques to engage the voice of older citizens and deepen the understanding of their perceptions of public spaces.
In conclusion, SeGAPe can be a useful methodology for urban planning/health promotion interventions, lobbying and advocacy work or participatory research. It offers itself as a tool for incorporating the experience of older adults in urban planning and, as part of a participatory approach, for empowering and engaging senior citizens in the co-production of “active” walkable, supportive, inclusive, age-friendly environments. An urgent endeavour if we are to create healthy, equitable and sustainable communities adapted to the needs and expectations of ageing urban populations.
REFERENCES
Abley, S., Wade-Brown, C., Thomas, L., Linton, L., & Shuttleworth, K. (2010). Guide to undertaking Community Street Reviews. NZTA - New Zealand Transport Agency. Retrieved from
Barton, H., Grant, M., Mitcham, C., & Tsourou, C. (2009). Healthy urban planning in European cities. Health Promotion International, 24(Supplement 1), i91–i99. doi.org/10.1093/heapro/dap059 Brownson, R. C., Hoehner, C. M., Day, K., Forsyth, A., & Sallis, J. F. (2009). Measuring the Built
Environment for Physical Activity. State of the Science. American Journal of Preventive Medicine, 36(4), S99–S123.e12. doi.org/10.1016/j.amepre.2009.01.005
Buffel, T., Phillipson, C., & Scharf, T. (2012). Ageing in urban environments: Developing ‘age-friendly’ cities. Critical Social Policy, 32(4), 597–617. doi.org/10.1177/0261018311430457
Buman, M. P., Winter, S. J., Baker, C., Hekler, E. B., Otten, J. J., & King, A. C. (2011). Neighborhood Eating and Activity Advocacy Teams (NEAAT): engaging older adults in policy activities to improve food and physical environments. Translational Behavioral Medicine, 2(2), 249–253.
doi.org/10.1007/s13142-011-0100-9
Burton, E. J., Mitchell, L., & Stride, C. B. (2011). Good places for ageing in place: development of objective built environment measures for investigating links with older people’s wellbeing. BMC Public Health, 11(1), 839. doi.org/10.1186/1471-2458-11-839
Cachadinha, C. (2012). Characteristics of an age‐friendly neighbourhood built environment:
comparison of age‐friendly community models with empirical evidence. In Proceedings of the 38th IAHS World Congress on Housing Science (pp. 677-683). Istanbul: Istanbul Technical University, International Association for Housing Science.
CDC-HAN (2009). Environmental Audit Tool - HEAT (v. 9-3-09). Prevention Research Centers Healthy Aging Research Network. Retrieved from http://www.aarp.org/content/dam/aarp/livable-communities/plan/assessments/healthy-aging-research-network-environmental-audit-tool.pdf Clarke, P., & Nieuwenhuijsen, E. R. (2009). Environments for healthy ageing: A critical review.
Maturitas, 64(1), 14–19. doi.org/10.1016/j.maturitas.2009.07.011
Cunningham, G. O., & Michael, Y. L. (2004). Concepts Guiding the Study of the Impact of the Built Environment on Physical Activity for Older Adults: A Review of the Literature. American Journal of Health Promotion : AJHP, 18(6), 435–443.
Greenfield, E. A. (2011). Using Ecological Frameworks to Advance a Field of Research, Practice, and Policy on Aging-in-Place Initiatives. The Gerontologist, 52(1), 1–12. doi.org/10.1093/geront/gnr108 Handler, S. (2014). Alternative Age-friendly Handbook. The University of Manchester Library.
Keast, E. M., Carlson, N. E., Chapman, N. J., & Michael, Y. L. (2010). Using Built Environmental Observation Tools: Comparing Two Methods of Creating a Measure of the Built Environment. American Journal of Health Promotion, 24(5), 354–361. doi.org/10.4278/ajhp.080603-QUAN-81 Kendig, H. & Phillipson, C. (2014). Building Age-Friendly Communities: New Approaches to Challenging
Health and Social Inequalities. In ‘If you could do one thing...’ Nine local actions to reduce health inequalities (pp. 102-111). London: The British Academy.
Kerr, J., & Rosenberg, D. (2009). Walking Route Audit Tool - WRATS (v07.17.09). Retrieved from http://www.midss.org/content/walking-route-audit-tool-seniors-wrats
Kerr, J., Rosenberg, D., & Frank, L. (2012). The Role of the Built Environment in Healthy Aging: Community Design, Physical Activity, and Health among Older Adults. Journal of Planning Literature, 27(1), 43–60. doi.org/10.1177/0885412211415283
Lui, C.-W., Everingham, J.-A., Warburton, J., Cuthill, M., & Bartlett, H. (2009). What makes a
community age-friendly: A review of international literature. Australasian Journal on Ageing, 28(3), 116–121. doi.org/10.1111/j.1741-6612.2009.00355.x
Menec, V. H., Means, R., Keating, N., Parkhurst, G., & Eales, J. (2011). Conceptualizing Age-Friendly Communities. Canadian Journal on Aging / La Revue Canadienne Du Vieillissement, 30(03), 479– 493. doi.org/10.1017/S0714980811000237
Michael, Y. L., Keast, E. M., Chaudhury, H., Day, K., Mahmood, A., & Sarte, A. F. I. (2009). Revising the senior walking environmental assessment tool. Preventive Medicine, 48(3), 247–249.
doi.org/10.1016/j.ypmed.2008.12.008
Moran, M., Cauwenberg, J. V., Hercky-Linnewiel, R., Cerin, E., Deforche, B., & Plaut, P. (2014). Understanding the relationships between the physical environment and physical activity in older adults: a systematic review of qualitative studies. International Journal of Behavioral Nutrition and Physical Activity, 11(1), 79. doi.org/10.1186/1479-5868-11-79
Paisana-Morais, V., Bispo, S., Encantado, J., & Carvalho, C. (2014). Acessibilidade pedonal percebida em maiores de 65 anos: Instrumento de avaliação. Psicologia, Saúde & Doenças, 15(01), 26–36. doi.org/10.15309/14psd150104
Phillipson, C. R. (2011). Developing Age-Friendly Communities: New Approaches to Growing Old in Urban Environments. In Handbook of the Sociology of Aging. (pp. 279–296). New York: Springer Verlag.
Plouffe, L., & Kalache, A. (2010). Towards Global Age-Friendly Cities: Determining Urban Features that Promote Active Aging. Journal of Urban Health, 87(5), 733–739. doi.org/10.1007/s11524-010-9466-0
Richard, L., Gauvin, L., Gosselin, C., & Laforest, S. (2009). Staying connected: neighbourhood correlates of social participation among older adults living in an urban environment in Montreal, Quebec. Health Promotion International, 24(1), 46–57. doi.org/10.1093/heapro/dan039
Rosso, A. L., Auchincloss, A. H., & Michael, Y. L. (2011). The Urban Built Environment and Mobility in Older Adults: A Comprehensive Review. Journal of Aging Research, 2011, 1–10.
Sallis, J. F., Cervero, R. B., Ascher, W., Henderson, K. A., Kraft, M. K., & Kerr, J. (2006). An ecological approach to creating active living communities. Annual Review of Public Health, 27(1), 297–322. doi.org/10.1146/annurev.publhealth.27.021405.102100
Schaefer-McDaniel, N., O’Brien Caughy, M., O’Campo, P., & Gearey, W. (2010). Examining
methodological details of neighbourhood observations and the relationship to health: A literature review. Social Science & Medicine, 70(2), 277–292. doi.org/10.1016/j.socscimed.2009.10.018 Starnes, H. A., McDonough, M. H., Tamura, K., James, P., Laden, F., & Troped, P. J. (2014). Factorial
validity of an abbreviated Neighborhood Environment Walkability Scale for seniors in the Nurses’ Health Study. International Journal of Behavioral Nutrition and Physical Activity, 11(1).
doi.org/10.1186/s12966-014-0126-8
Van Cauwenberg, J., De Bourdeaudhuij, I., De Meester, F., Van Dyck, D., Salmon, J., Clarys, P., & Deforche, B. (2011). Relationship between the physical environment and physical activity in older adults: A systematic review. Health & Place, 17(2), 458–469.
doi.org/10.1016/j.healthplace.2010.11.010
Wahl, H.-W., Iwarsson, S., & Oswald, F. (2012). Aging Well and the Environment: Toward an Integrative Model and Research Agenda for the Future. The Gerontologist, 52(3), 306–316. doi.org/10.1093/geront/gnr154
Weiss, R. L., Maantay, J. A., & Fahs, M. (2010). Promoting active urban aging: a measurement approach to neighborhood walkability for older adults. Cities and the Environment, 3(1), 12. WHO (2002). Community participation in local health and sustainable development: approaches and
techniques. Copenhagen: World Health Organization Regional Office for Europe. WHO (2007). Global age-friendly cities: a guide. Geneva: World Health Organization.
WHO (2012). Strategy and action plan for healthy ageing in Europe, 2012–2020. Copenhagen: World Health Organization Regional Office for Europe.
Yen, I. H., Michael, Y. L., & Perdue, L. (2009). Neighborhood Environment in Studies of Health of Older Adults. American Journal of Preventive Medicine, 37(5), 455–463.
doi.org/10.1016/j.amepre.2009.06.022
Acknowledgments: I would like to thank local partners and participants in the pilot-testing, the experts that provided feedback on the tool, as well as João Ferrão and the colleagues at ICS, University of Lisbon that provided very helpful comments on the paper.
Funding: This work was supported by the Fundação para a Ciência e a Tecnologia (FCT) [SFRH/BPD/89091/2012]