UNIVERSIDADE DE LISBOA FACULDADE DE CI ˆENCIAS DEPARTAMENTO DE INFORM ´ATICA
BIOINFORMATICS APPLICATION FOR ANALYSIS AND
VISUALISATION OF ALTERNATIVE SPLICING IN CANCER
Nuno Daniel Saraiva Agostinho
MESTRADO EM INFORM ´ATICA
Trabalho de projeto orientado por:
Prof. Doutor Andr´e Os´orio e Cruz de Azerˆedo Falc˜ao e por Dr. Nuno Lu´ıs Barbosa Morais
Acknowledgments
There always comes a moment in life where one is asked to accomplish an impossible task. To me, that task is to thank all the people who have always been by my side, as I find that words alone cannot describe my appreciation for you. Nonetheless, I can only hope you understand how grateful I am to all of you.
Starting with Lina, Marie, Teresa, Mariana, Carolina and Juan, you were the best colleagues anyone could ever ask for. Thanks for making this last year pass in a blink of an eye. I learned a lot from you and I had a great time. I would also like to thank Ana Rita, Margarida and Ana Duarte for their friendship and all their help.
Thank you, Nuno. You are a great mentor and an even greater friend. I appreciate all your effort in teaching me about a myriad of exciting fields (and for being the first person that made me understand statistics). Additionally, thanks for helping me improve my oral and written communication to be ever so clear and precise.
Andr´e immensely helped me with all the suggestions and support. You and Prof. Ant´onia are of the greatest teachers I have ever had and it is thanks to people like you that I am motivated to give my best every day.
For being always there to both annoy me and laugh with me, I thank you, Catarina (Inˆes). It is always a pleasure to constantly annoy you and I find it rather annoying to hear your brilliant suggestions (even though only 5% of your suggestions are worth listening to). Anyway, keep going on with your brilliant suggestions.
Jo˜ao, there is not much that I could say about you that you would not already know about. You are uplifting but nauseating, friendly but tiresome, helpful but maddening. You always know how to make me smile and how to tick me off. Thanks for enduring my lack of patience and also for exploiting it for your own entertainment. You are the best.
Miguel, Z´e and Alicia: although you are not as present in my life as I would like, you were always there for me when I needed the most. Thank you all.
Finally, I would like to thank my parents, my brothers and my remaining family for being my greatest source of love, support and headaches. Specially, to my grandfather: science has been part of my life ever since I appeared into yours. I hope you’ll stay by my side for a long time.
I couldn’t be here without any of you. And if I could go back, I’d go through this all over again and again. And once more. Thank you all.
Resumo
A evoluc¸˜ao das tecnologias de processamento de dados tem permitido avanc¸os significativos na ´area das ciˆencias da vida. As melhorias na quantidade e na qualidade dos dados dispon´ıveis para an´alises biol´ogicas tˆem proporcionado o estudo em larga escala de diversos processos biol´ogicos.
O splicing alternativo ´e um mecanismo molecular que contribui significativamente para a criac¸˜ao de prote´ınas com func¸˜oes distintas a partir do mesmo gene. Encontrando-se este processo envolvido no controlo de muitos mecanismos celulares, a sua desregulac¸˜ao pode promover a progress˜ao de um vasto leque de doenc¸as. Por exemplo, existem associac¸˜oes descritas entre alterac¸˜oes de splicing alternativo e a maioria das caracter´ısticas de cancro (como evas˜ao ao sistema imunit´ario e crescimento celular auto-sustentado). Estas associac¸˜oes podem ser analisadas atrav´es de dados dispon´ıveis online, como a partir dos dados do The Cancer Genome Atlas (TCGA) que incluem dados cl´ınicos e do perfil molecular de pacientes humanos com diversos tipos de tumores.
A an´alise e interpretac¸˜ao correcta dos resultados requer competˆencias multi-disciplinares em biolo-gia, estat´ıstica e inform´atica. Como nem todos os cientistas das ciˆencias da vida se sentem confort´aveis a utilizar ferramentas com uma interface baseada em linha de comandos, v´arios programas com uma inter-face gr´afica tˆem emergido para auxiliar na quantificac¸˜ao, an´alise e visualizac¸˜ao de dados biol´ogicos. As an´alises tamb´em podem ser facilitadas atrav´es da utilizac¸˜ao de dados previamente processados que est˜ao dispon´ıveis publicamente para casos comuns de utilizac¸˜ao, evitando-se o processamento dispendioso de dados a n´ıvel de tempo e aliviando tamb´em a carga na largura de banda relativamente `a transferˆencia de dados brutos.
Infelizmente, as ferramentas existentes para a an´alise de splicing alternativo focam-se primariamente na sua quantificac¸˜ao ou apresentam funcionalidades limitadas para a an´alise subsequente dos eventos de splicing alternativo. Al´em disso, muitos programas que quantificam o splicing alternativo utilizam dados brutos e n˜ao tiram partido dos dados processados dispon´ıveis de fontes p´ublicas como os dados do TCGA. Assim sendo, existe a necessidade de criar um programa interactivo e f´acil de usar que se dedique `a an´alise subsequente dos dados para auxiliar tanto na explorac¸˜ao como no estudo diferencial de dados do splicing alternativo, permitindo assim a potencial descric¸˜ao de novos mecanismos envolvidos na progress˜ao de doenc¸as. Ademais, a integrac¸˜ao da informac¸˜ao cl´ınica associada (ausente na maioria dos programas dispon´ıveis) poder´a ajudar na identificac¸˜ao de factores de progn´ostico e de alvos terapˆeuticos. Todos os membros do laborat´orio de Biologia Computacional do Instituto de Medicina Molecular (Faculdade de Medicina da Universidade de Lisboa) s˜ao partes interessadas (stakeholders) no projecto, j´a que apoiam o desenvolvimento do programa e ser˜ao utilizadores finais deste. O grupo efectua diari-amente muitas das an´alises e visualizac¸˜oes incorporadas no projecto, tendo ajudado no seu desenvolvi-mento ao examinar os detalhes de cada an´alise.
Para o desenvolvimento de uma ferramenta ´util, os requisitos necess´arios foram comunicados pelas partes interessadas ao longo de v´arias reuni˜oes. Acordou-se que a aplicac¸˜ao se deve focar em obter dados a partir de fontes online (como do TCGA), processar, carregar e manipular os dados na aplicac¸˜ao, quantificar splicing alternativo e analisar estatisticamente os dados dispon´ıveis (por exemplo, an´alise de sobrevivˆencia, componentes principais e diferencial de splicing), incluindo funcionalidades para criar e editar grupos baseados nos dados cl´ınicos e para gravar os resultados obtidos (conforme apropriado). Outras caracter´ısticas de interesse incluem a capacidade de adicionar novos reposit´orios, reconhecer novos formatos aquando da identificac¸˜ao e do carregamento de ficheiros, acrescentar novas ferramentas para manipulac¸˜ao de dados e incorporar novas an´alises e visualizac¸˜oes a partir dos dados carregados.
Consoante os requisitos funcionais discutidos, os atributos n˜ao funcionais incluem a capacidade de modificac¸˜ao (f´acil de modificar e introduzir novas componentes de sistema), a usabilidade (interface f´acil de usar e consistente que mostre mensagens de erro e de aviso informativas), o desempenho (foco no tempo tomado pelas operac¸˜oes dado a quantidade de dados para processar e analisar) e a capacidade de reposta (informar o utilizador da operac¸˜ao a decorrer atrav´es de uma barra de progresso e bloqueando o bot˜ao de in´ıcio de uma acc¸˜ao durante a operac¸˜ao).
Dada a importˆancia da an´alise estat´ıstica e biol´ogica no projecto e do interesse da comunidade ci-ent´ıfica no R e no Bioconductor (reposit´orio de pacotes R associados a dados biol´ogicos), foi deci-dido que o projecto seria desenvolvido com base no Shiny, uma framework para desenvolvimento de aplicac¸˜oes web que permite construir aplicac¸˜oes interactivas com a linguagem R e incorporar gr´aficos interactivos desenvolvidos em HTML5 e JavaScript. Todas as funcionalidades destas ferramentas foram testadas e estudadas atrav´es de um prot´otipo antes da concepc¸˜ao da arquitectura.
A arquitectura do sistema foi desenhada de forma modular e extens´ıvel, consoante os requisitos mencionados, estimulando assim contribuic¸˜oes de quaisquer partes interessadas, bem como facilitando a expans˜ao do seu suporte para outras fontes de dados, formatos de ficheiro e an´alises e visualizac¸˜oes efec-tuadas sem necessidade de alterar as funcionalidades b´asicas. Para al´em de facilitar testes e correcc¸˜oes `as unidades do programa, a expansibilidade possibilita actualizar as ferramentas com novos m´etodos explorados e desenvolvidos na ´area e, consequentemente, aumentar o interesse da comunidade cient´ıfica no programa.
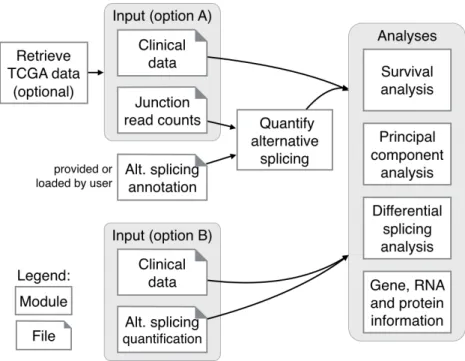
A modularidade foi implementada de forma a que, quando o utilizador chama a func¸˜ao para comec¸ar a interface visual do programa, d´a-se in´ıcio a uma s´erie de chamadas hier´arquicas a outras func¸˜oes do programa, as quais preparam a interface e a l´ogica de todos os m´odulos dispon´ıveis. O programa ´e com-posto pelos m´odulos de obtenc¸˜ao de dados (para obter dados locais ou do TCGA e process´a-los de acordo com o seu formato), quantificac¸˜ao de splicing alternativo, an´alise de dados (an´alises cl´ınica, componen-tes principais e diferencial e informac¸˜oes associadas aos genes dos eventos de splicing), agrupamento de dados e definic¸˜oes do programa. Os gr´aficos interactivos foram adaptados ao diferentes m´odulos conforme apropriado, recorrendo ao pacote Highcharter.
A aplicac¸˜ao realiza v´arios testes autom´aticos para validar o output das unidades do programa, de forma a alertar o programador caso haja alguma mudanc¸a que altere o output esperado. Esta funcionali-dade est´a incorporada em ferramentas de testes cont´ınuos como o Travis-CI e o AppVeyor. A cobertura do c´odigo testado tamb´em ´e avaliada pela ferramenta CodeCov.
de Biologia Computacional do Instituto de Medicina Molecular no seu ambiente de trabalho, consoante diversas tarefas pr´e-definidas. Os participantes escolhidos representam a p´ublico-alvo: utilizadores pro-ficientes no conhecimento do dom´ınio de interesse. V´arias m´etricas foram medidas durante as sess˜oes de teste, incluindo o n´umero de problemas encontrados e as opini˜oes dos utilizadores sobre cada tarefa. Cada participante utilizou uma vers˜ao que tentou melhorar alguns dos problemas encontrados pelo par-ticipante anterior. A interface foi considerada, em m´edia, muito boa ou excelente para cada tarefa e permitiu atentar a 45 problemas distintos (actualmente, pelo menos 25 desses problemas j´a foram resol-vidos). Para melhorar a usabilidade e funcionalidade do programa, solicit´amos recentemente o parecer de contribuidores externos especializados na an´alise de splicing alternativo.
A aplicac¸˜ao tamb´em foi testada a n´ıvel de desempenho para v´arios tipos de tumores. Uma an´alise completa para dados associados a pacientes com cancro da mama (cerca de 1097 pacientes, o maior n´umero de pacientes dispon´ıveis para qualquer tipo de tumor no TCGA) demora cerca de 6 minutos atrav´es da interface visual: 47 segundos para carregar os dados necess´arios do TCGA (excluindo tempo de transferˆencia), 2 minutos e 39 segundos para quantificar o splicing alternativo e 2 minutos e 35 segun-dos para a an´alise diferencial baseada nas amostras normais versus tumorais. A interface visual adiciona um overhead ao desempenho, da´ı ter sido escolhida para medir os tempos nos piores casos poss´ıveis.
Em suma, temos estado a desenvolver uma aplicac¸˜ao web em R com uma interface gr´afica para a quantificac¸˜ao, an´alise integrada e visualizac¸˜ao de dados de splicing alternativo a partir de grandes con-juntos de dados transcript´omicos provenientes do projecto The Cancer Genome Atlas (TCGA). Esta ferramenta interactiva realiza an´alise de componentes principais e outras an´alises explorat´orias grafi-camente assistidas. Entre os seus aspectos mais inovadores encontra-se a an´alise de variˆancia (que a pesquisa do grupo revela como importante na detecc¸˜ao de alvos de interesse de outra forma despercebi-dos) e a incorporac¸˜ao de dados cl´ınicos (como est´adio tumoral e dados de sobrevivˆencia) associados com as amostras do TCGA. De interesse tamb´em se encontra incorporado o acesso visual interactivo para ma-peamento gen´omico e anotac¸˜ao funcional dos eventos de splicing alternativo seleccionados. Aplicac¸˜ao desenvolvida permitiu revelar assinaturas de splicing alternativo espec´ıficos de cancro e novos factores putativos de progn´ostico.
O c´odigo da ferramenta j´a se encontra gratuitamente dispon´ıvel atrav´es de uma licenc¸a MIT no GitHub (http://github.com/nuno-agostinho/psichomics) e foi enviada para ser aceite no Bioconductor. Actualmente, a aplicac¸˜ao apenas pode ser utilizada localmente, mas h´a planos para a disponibilizar num servidor web do Instituto de Medicina Molecular.
Abstract
Alternative splicing (AS) allows proteins with distinct functions to be generated from the same gene, being involved in the control of many common cellular processes. Its deregulation may therefore foster the progression of a wide range of diseases. For instance, associations between most of the hallmarks of cancer and AS alterations have been reported.
The advent of next-generation sequencing has allowed the profiling of transcriptomes beyond gene expression, enabling genome-wide studies of AS. However, the currently available tools for the analysis of AS from RNA-Seq data are not user-friendly and primarily focus on quantification, having limited features for downstream analysis.
To overcome these limitations, we have been developing an R application with a graphical inter-face for the integrated analysis of AS from large transcriptomic datasets, namely from The Cancer Genome Atlas (TCGA) project. The tool interactively performs clustering, principal component and other graphically-assisted exploratory analyses. Amongst its innovative aspects are the analysis of vari-ance (which our research shows to be important in the detection of otherwise unnoticed putative targets) and the direct incorporation of clinical features (such as tumour stage or survival) associated with TCGA samples. Interactive visual access to genomic mapping and functional annotation of selected AS events is also incorporated. We have successfully used the application in the revelation of cancer-specific AS signatures and associated novel putative prognostic factors.
The application’s architecture is modular and extensible, aiming to stimulate contributions from its users, as well as to gradually expand its support to other data sources and file formats and the scope of its analysis and visualisation tools without modifying its core functionalities. The tool is available in GitHub (http://github.com/nuno-agostinho/psichomics) and was submitted to be accepted in Bioconductor. Currently, the application is locally run but there are plans to deploy it in a web server from Instituto de Medicina Molecular.
Contents
List of Figures xvi
List of Tables xvii
Acronyms xix Glossary xxi 1 Introduction 1 1.1 Requirements . . . 2 1.2 Contributions . . . 2 1.3 Workplace . . . 3 1.4 Document Structure . . . 4
2 Concepts and Related Work 5 2.1 Genetic Information Transfer . . . 5
2.2 Alternative Splicing . . . 5
2.2.1 Association with Disease . . . 6
2.2.2 Quantification . . . 7
2.3 Analytical Tools . . . 9
3 Materials and Methods 11 3.1 R Statistical Language . . . 11
3.1.1 Packages . . . 11
3.1.2 External Libraries . . . 12
3.2 Data Retrieval . . . 12
3.2.1 Alternative Splicing Annotation . . . 12
3.3 Alternative Splicing Quantification . . . 13
3.4 Data Analyses . . . 15
3.4.1 Principal Component Analysis . . . 15
3.4.2 Survival Analysis . . . 15
3.4.3 Differential Splicing Analysis . . . 16
3.5 Version Control . . . 17
3.6.1 Continuous Integration and Code Coverage . . . 17
3.6.2 Benchmarking . . . 17
3.6.3 Usability Testing . . . 18
4 Design Decisions 19 4.1 Programming Language . . . 19
4.1.1 Bioconductor’s Package Guidelines . . . 19
4.2 Prototype . . . 20 4.2.1 Debugging . . . 20 4.2.2 Code Performance . . . 21 4.2.3 R Packages . . . 21 4.2.4 Shiny . . . 23 4.3 Requirement analysis . . . 23 4.4 Architecture . . . 25 5 Implementation 29 5.1 Modularity . . . 29 5.1.1 Communication . . . 30 5.2 Data Input . . . 31
5.2.1 Junction Read Counts and Clinical Data . . . 31
5.2.2 Alternative Splicing Event Annotation . . . 32
5.2.3 Dataset Loading . . . 33
5.3 Analyses . . . 34
5.3.1 Interactive Plots . . . 34
5.3.2 Principal Component Analysis . . . 35
5.3.3 Survival Analysis . . . 35
5.3.4 Differential Splicing Analysis . . . 36
5.3.5 Gene, Transcript and Protein Information . . . 37
5.4 Supporting Features . . . 39 5.4.1 Modals . . . 40 5.4.2 Data Grouping . . . 40 5.4.3 Text Suggestions . . . 42 5.4.4 Global Settings . . . 43 5.5 Case Study . . . 43 6 Testing 47 6.1 Unit and Continuous Testing . . . 47
6.2 Usability Testing . . . 47
6.3 Benchmarking . . . 49
7 Deployment 51 7.1 License . . . 51
8 Conclusions 53
8.1 Future Work . . . 54
A Source code 55 A.1 Format of the Clinical Information . . . 55
A.2 Template for an Analysis File . . . 56
B Screenshots 59 C Usability Testing 67 C.1 Script . . . 67 C.1.1 Instructions . . . 67 C.1.2 General Questions . . . 67 C.1.3 Tasks . . . 67
C.2 List of Design Issues Encountered . . . 69
C.3 Table of Design Issues by Task and Tester . . . 70
List of Figures
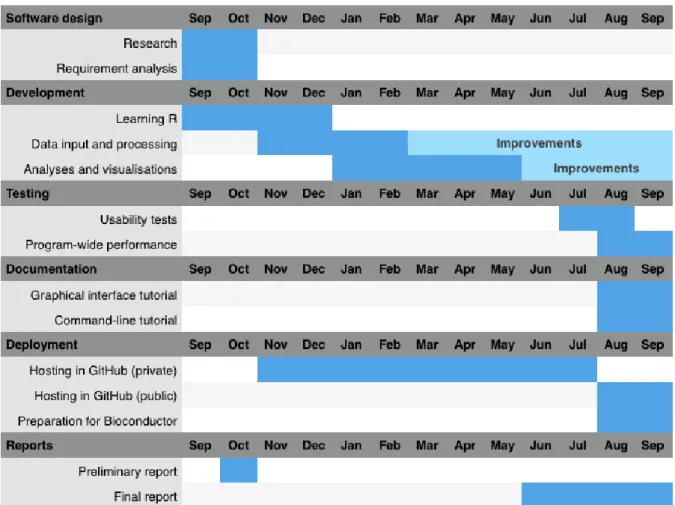
1.1 Project timeline chart . . . 3
2.1 mRNA lifecycle . . . 5
2.2 Types of alternative splicing events . . . 6
2.3 Influence of alternative splicing in the hallmarks of cancer . . . 7
2.4 RNA sequencing and read mapping . . . 8
2.5 Quantification of intron retention . . . 9
3.1 Measuring alternative splicing . . . 13
3.2 Splice junctions used to measure alternative splicing by event type . . . 14
3.3 Alternative splicing quantification distribution . . . 17
4.1 System use case diagram . . . 24
4.2 Logical view . . . 25
4.3 Development view . . . 26
5.1 Function call hierarchy . . . 30
5.2 TCGA data retrieval . . . 32
5.3 File format checking and file loading . . . 33
5.4 Comparison of interactive and static survival curves . . . 36
5.5 Example of a density plot containing a rug plot at the bottom . . . 37
5.6 Process view of the information analysis . . . 38
5.7 Modal dialog styles . . . 40
5.8 Data grouping . . . 41
5.9 Text suggestions . . . 43
5.10 Options available to load data from Firehose . . . 44
5.11 Plot of a principal component analysis . . . 44
5.12 Survival curves for a cut-off of a splicing event . . . 45
6.1 Percentage of satisfaction of all test participants based on a Likert scale for the different interfaces in the program . . . 49
6.2 Running time . . . 50
B.1 Welcome message . . . 60
B.3 Interface of principal component analysis . . . 62
B.4 Interface of differential splicing analysis . . . 63
B.5 Interface of differential splicing analysis for one event . . . 64
B.6 Interface of survival analysis . . . 65
List of Tables
3.1 Annotated events retrieved from different programs that quantify alternative splicing . . 13 3.2 Quantification of alternative splicing event types . . . 14 C.1 Design issues by task and tester encountered during usability testing . . . 71
Acronyms
API Application Program Interface. 2, 43, 54 CI Continuous Integration. 17, 47, 51
CLI Command-Line Interface. 1
CRAN The Comprehensive R Archive Network. xix, 19, 20, 34, 35, 47, Glossary: The Comprehensive R Archive Network
CSS Cascading Style Sheets. 12, 19, 23, 39, 40
DNA deoxyribonucleic acid. xix, 5, 7, 8, Glossary: deoxyribonucleic acid GTEx Genotype-Tissue Expression project. 9, 54
GTF Gene Transfer Format. 13
HTML HyperText Markup Language. 19, 23, 34, 37, 38, 40, 51 IDE Integrated Development Environment. 11, 20
JSON JavaScript Object Notation. 31, 37
mRNA messenger RNA. xix, 5–8, 12, 13, 16, 32, 37, Glossary: messenger RNA PCA principal component analysis. 15, 35
PSI percent spliced-in. xix, 7, 8, 14, 16, 17, 36, 45, 54, 63, 64, Glossary: percent spliced-in REST Representational State Transfer. 11, 12, 31, 38, 39
RNA ribonucleic acid. xix, 5, 7–9, Glossary: ribonucleic acid RNA-seq RNA sequencing. xix, 7, 9, 31, Glossary: RNA sequencing
TCGA The Cancer Genome Atlas. xix, 1, 2, 9, 12, 14, 16, 23, 25, 31, 32, 34, 50, 53, 54, 67, Glossary: The Cancer Genome Atlas
TXT text file. 13
UCSC University of California Santa Cruz. 13, 32, 38
UTR untranslated region. xx, 5, 6, Glossary: untranslated region VCS Version Control System. 17
Glossary
Bioconductor Repository of R packages dedicated to biological data analyses. 12, 17, 19, 20, 47, 51, 53
deoxyribonucleic acid (DNA) Molecule that stores the genetic information of a cell. xix, 5 gene DNA sequence that is transcribed to RNA. 5–7, 9, 12, 13, 17, 34, 37, 38, 45
Highcharter R package to create JavaScript-based interactive plots. 2, 11, 12, 35–37, 39 messenger RNA (mRNA) RNA molecule used as a template for protein synthesis. xix, 5
percent spliced-in (PSI) Metric used to calculate the proportion of reads that support the inclusion iso-form. xix, 7
read Sequencing reads are short text strings corresponding to a sequence of DNA or RNA. 7–9, 12–15, 25, 31
ribonucleic acid (RNA) Molecules transcribed from genes and that are involved in protein synthesis, gene regulation, DNA replication and other cellular functions. xix, 5
RNA sequencing (RNAseq) Sequencing method to detect and quantify RNAs from a sample. xix, 7 Shiny R package to create interactive web applications using a reactive programming model. 2, 12, 19,
20, 23, 26, 29–31, 34, 38, 39, 42, 43, 47
The Cancer Genome Atlas (TCGA) Project that aims to catalogue data (including clinical information and molecular profiles) from samples of human patients regarding diverse tumour types.. xix, 1 The Comprehensive R Archive Network (CRAN) Repository of generic R packages. xix, 19
untranslated region (UTR) Ends of the mRNA sequence not translated into protein. UTRs may regu-late the translation mechanism of its mRNA. xx, 5
Chapter 1
Introduction
The fast development of data processing technologies has had a large impact on life sciences research. The ever-increasing amount and resolution of available data for biological analyses has recently allowed the study of a vast variety of biological processes in a large scale [1].
One of the molecular mechanisms that most significantly contributes to protein diversity is alternative splicing [2,3]. Given the regulatory roles of this process in cellular metabolism, its deregulation is linked with disease development, including cancer [4–8] and neurodegeneration [8, 9]. This association can be analysed by retrieving biological data from online sources, such as The Cancer Genome Atlas (TCGA), a project that catalogues clinical and molecular profiling data of different kind of human tumours [10].
However, correct analyses and interpretation of results require a multi-disciplinary expertise in bi-ology, statistics and computer science. As not every life scientist is comfortable using tools based on a Command-Line Interface (CLI), many programs with a visual interface have emerged to assist in the quantification, analysis and visualisation of biological data [11–13]. Processed data is also publicly of-fered for the most common research uses to facilitate data analyses, overcoming the time-consuming step of data processing and bandwidth concerns related with raw data transference.
Unfortunately, current tools used for studying alternative splicing either present over-simplistic anal-yses or focus mostly on its quantification [9, 14–16]. Furthermore, many of the programs that quantify alternative splicing use raw data without leveraging the available higher-level data from sources such as TCGA [9, 14, 15].
Therefore, there is a need for an user-friendly and interactive program that goes beyond quantification-only analysis to assist in both exploration and differential study of alternative splicing data, thus allowing the potential characterisation of novel mechanisms involved in disease progression. Moreover, the inte-gration of clinical-related information (which is absent in most available programs) may help in identi-fying relevant prognostic factors and therapeutic targets.
To overcome these limitations, we have been developing a web application called PSIchomics to quantify, analyse and visualise alternative splicing data. This app is an R package with a modular design to easily introduce new features, including the support of new file formats and new data analyses. The app is currently available in GitHub at http://github.com/nuno-agostinho/psichomics and it will be released in Bioconductor, a repository of R packages for biological data [17].
Chapter 1. Introduction
1.1
Requirements
All the members of the Computational Biology laboratory at Instituto de Medicina Molecular (Fac-uldade de Medicina, Universidade de Lisboa) are stakeholders in the project since they have an interest in the program development and they are part of the end-users. They also perform many of the analyses and visualisations of this project daily and aided in the program development by scrutinising the details of each analysis.
The requirements of the project were stated in natural language by the stakeholders through recurrent discussions to minimise any missteps. My background in biology helped in understanding the functional requirements and how to develop the application. Expectedly, not all requirements were stated in the first meetings and some of the requirements evolved with time, reinforcing the need for successive conversa-tions with the stakeholders.
The following was agreed upon: the application must allow data retrieval from online sources (such as retrieval of TCGA data), alternative splicing quantification and statistical data analyses (including sur-vival, principal component and differential splicing analyses) with interactive plots, as appropriate. The diverse analyses also must support the creation and manipulation of data grouping. Also of interest, the program must have an easy-to-use interface and to easily allow to add new data sources, recognise new file formats when loading data, add new manipulation tools and incorporate new analyses and visualisa-tions.
There were no additional constraints, which allowed to freely choose the programming language and the type of program (whether a desktop or web application, a library, etc).
1.2
Contributions
The design, implementation, testing and deployment of the application were conducted by me with suggestions and guidance from my laboratory colleagues and advisors. The duration of the project activities is plotted in figure 1.1.
All the members of the Computational Biology laboratory at Instituto de Medicina Molecular (Fac-uldade de Medicina da Universidade de Lisboa) are stakeholders in the project since they are part of the future end-users. They also assisted program development, namely the fine details of each data analysis step, given that they commonly perform the type of analyses and visualisations this project focuses on. Additionally, they participated in the usability tests of the program.
Prof. Dr. Ant´onia Lopes (Faculdade de Ciˆencias da Universidade de Lisboa) also made valuable suggestions to the architecture of the application.
During the application development, I have also contributed to some open-source projects, such as the R package Highcharter with the code of some graphical plots (survival curves, density plots and smaller additions) that are already part of the latest package release [18]. I have also contributed to Shiny with code for a text area input [19]. Additionally, I suggested improving code reusability to promote information hiding in Firebrowser, an R package that works as a client to the Firehose Application Program Interface (API) and provides both the data available in TCGA and diverse analyses on TCGA datasets [20]. The authors of Firebrowser kindly offered me co-authorship of their manuscript titled Firebrowser: An R Client to the Broad Institute’s Firehose Pipelinefor my participation in the project.
1.3. Workplace
Figure 1.1: Gantt chart with the duration of the project’s activities. The project started in September 2015 and ended in September 2016.
The final manuscript, which I also reviewed, was submitted to Database: The Journal of Biological Databases and Curationand it is currently under review.
Other notable contributions I made include cross-referencing alternative splicing events from four programs that quantify alternative splicing events (MISO [14], VAST-TOOLS [9], rMATS [15] and SUPPA [16]). This is useful to the Computational Biology group in order to compare results between the mentioned tools. Additionally, I performed the alternative splicing quantification of 116 rat RNA-Seq samples [21] using SUPPA and rMATS for an ongoing research project on toxicotrancriptomics in the lab.
Moreover, we will write a research article on the developed program, to be submitted to the Bioin-formatics journal. This project was already presented in a poster session at the EMBO Young Scientists’ Forum 2016 (Lisbon, Portugal), a meeting for life scientists.
1.3
Workplace
All the work was developed at Instituto de Medicina Molecular (Faculdade de Medicina da Univer-sidade de Lisboa) with the guidance of Dr. Nuno Morais (group leader of the Computational Biology group) and Prof. Dr. Andr´e Falc˜ao (supervisor from Faculdade de Ciˆencias da Universidade de Lisboa). The Instituto de Medicina Molecular is a research entity focused on biomedical research and it offers
Chapter 1. Introduction
diverse facilities to support the everyday work taking place in the institute, such as dedicated services to microscopy imaging, information technology support and animal facilities1.
The stakeholders were always available for questions and suggestions which allowed the project to progress nicely thanks to their constant feedback. There were also some focused meetings to discuss the project more deeply, including a presentation of the project to other members of the Instituto de Medicina Molecular, which allowed me to get input on the project from third-parties that knew little or nothing at all about the project.
1.4
Document Structure
The remaining sections of this document are organised as follows:
• Chapter 2 - ”Concepts and Related Work” explores the biological concepts and existing solutions for the quantification and analyses of alternative splicing.
• Chapter 3 - ”Materials and Methods” shortly describes the approaches involved in the work per-formed.
• Chapter 4 - ”Design Decisions” discusses the choice of the programming language, the develop-ment of the prototype and the program’s architecture.
• Chapter 5 - ”Implementation” examines the current implementation of the program and its mod-ules. Also, it features case studies related to the program’s functionality.
• Chapter 6 - ”Testing” details tests performed on the program, including installation, usability, unit and continuous testing. It also features software benchmarking.
• Chapter 7 - ”Deployment” delves into software deployment and open-source licenses.
• Chapter 8 - ”Conclusions” states final remarks, the importance of this project and plans for future work.
1
Chapter 2
Concepts and Related Work
2.1
Genetic Information Transfer
Cell functions are dependent on the information encoded in segments of deoxyribonucleic acid (DNA) molecules called genes. Each gene is a segment of DNA that is copied to ribonucleic acid (RNA) in a process referred to as transcription. After this process, messenger RNA (mRNA) molecules carry the information as templates for proteins to be synthesised in a process called translation [22, 23].
Figure 2.1: pre-mRNA is synthesised from DNA in the cell nucleus and then processed into a mature mRNA (or simply mRNA). Finally, the mRNA is exported out of the nucleus to serve as the template of a new protein.
The mRNA sequence involved in protein synthesis is not identical to its genes. For instance, the ends of the mRNA sequence, known as untranslated regions (UTRs), operate on functions related to the mRNA translation but they do not serve as part of the protein-coding template. mRNA pro-cessing also includes a splicing mechanism that removes some segments (called introns) of the primarily transcribed RNA (pre-mRNA) and keeps its remaining segments (exons) as part of the
se-quence that will encode for a protein (figure 2.1) [3, 23–25].
2.2
Alternative Splicing
The majority of human mRNAs undergo alternative splicing. In this process, the splicing of a single pre-mRNA may occur differently by exon exclusion, exon truncation, intron retention or even a combi-nation of the former that may result in a great diversity of mRNA variants (known as mRNA isoforms) translatable into specific proteins (protein isoforms) [3, 24]. Even though they are encoded by the same gene, protein isoforms may have different or even antagonising functions. One such example is the
Chapter 2. Concepts and Related Work
KLF6 gene whose protein isoforms are involved in tumour suppressor functions with the exception of one splicing isoform that promotes tumour growth and dissemination [26].
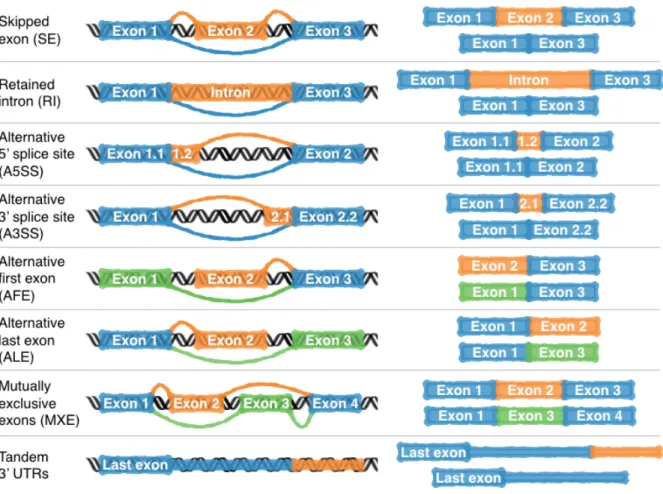
Figure 2.2: Types of alternative splicing events. In the given cases, each gene may express one of the two mRNA variants depicted on the right by inclusion and exclusion of specific exons. Constitutive exons are depicted in blue while alternative ones are depicted in orange and green.
Alternative splicing is common in mammals and invertebrates and particularly abundant in primates. The average human gene has 3,5 isoforms compared to 2,75 in mice, 1,25 in fruit flies and 1,25 in nematodes, which supports an association between alternative splicing and organismal complexity [27, 28]. Interestingly, alternative splicing rates are also tissue-dependent in vertebrates. Alternative splicing is much more frequent in the brain than in other tissues like the heart, liver and kidney [28].
Alternative splicing can occur in different ways which have been categorised in the following types: skipped exon (SE), intron retention (IR), alternative 5’ (A5SS) and 3’ (A3SS) splice sites, alternative first (AFE) and last (ALE) exon, mutually exclusive exons (MXE) and tandem 3’ UTR (depicted in figure 2.2). Although this categorisation is widely used, it is criticised for its inflexibility regarding more complex events [29].
2.2.1 Association with Disease
Alternative splicing is involved in the control of many cellular processes [4]. Expectedly, its dereg-ulation is associated with a wide range of diseases, namely the progress of cancer [4–8] and neurode-generative disorders [8, 9]. For instance, certain tumour cells inhibit programmed cell death (a defence
2.2. Alternative Splicing
mechanism against cancer cells) by skipping exons 3 to 6 in mRNAs from the caspase 9 gene [30].
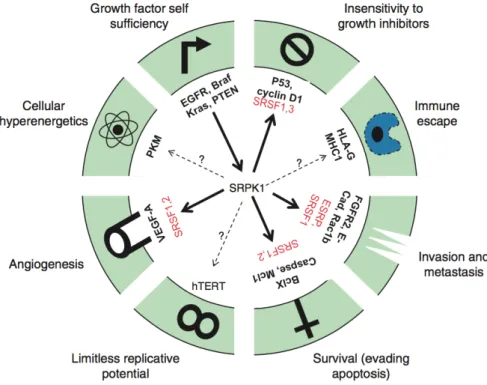
Figure 2.3: Regulators in the hallmarks of cancer are alternatively spliced. The gene SRSF1 is an al-ternatively spliced regulator that is reported to affect at least four cancer hallmarks. Image retrieved from [4].
Specifically during tumour progression, normal cells may progressively acquire oncogenic properties known as the hallmarks of cancer, including cell death evasion, tissue invasion and metastasis, limitless replication, and immune system evasion, among others [4, 31]. These hallmarks have been associated with a diversity of deregulated splicing isoforms [4] as depicted in figure 2.3. Studying this association allows for a better understanding of tumour formation and progression, namely by identifying isoforms involved in cancer development and if they can be potential therapeutic targets.
2.2.2 Quantification
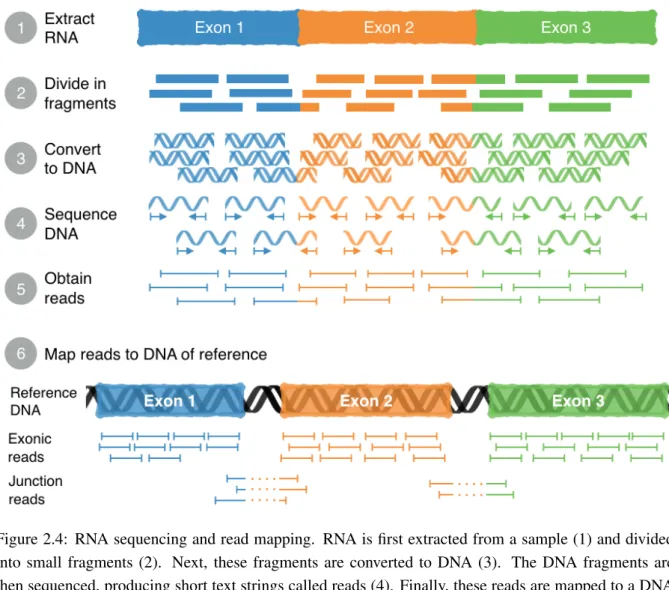
Alternative splicing may be profiled by next-generation RNA sequencing (RNA-seq) [1].This tech-nology yields short RNA sequence text strings (called reads) that are mapped to a DNA of reference [1] (as depicted in figure 2.4) or to a transcriptome (i.e. the set of all RNAs1 in a cell type or organism) of reference.
The presence of a given exon may be quantified using the percent spliced-in (PSI) metric, corre-sponding to the proportion of isoforms that include a certain exon [2, 32, 33]. The distribution of PSI values for each alternative splicing event can then be compared between different groups. For instance, distributions with a statistical significance difference between normal and disease samples or between tumour stages may reveal events related to disease progression.
1
Chapter 2. Concepts and Related Work
Figure 2.4: RNA sequencing and read mapping. RNA is first extracted from a sample (1) and divided into small fragments (2). Next, these fragments are converted to DNA (3). The DNA fragments are then sequenced, producing short text strings called reads (4). Finally, these reads are mapped to a DNA of reference (5), which allows to reconstruct the extracted mRNAs and identify exon coordinates in the reference DNA.
Quantification Tools
There are several programs that quantify alternative splicing, including MISO [14], AltAnalyze [11], VAST-TOOLS [9], rMATS [15], jSplice [35] and SUPPA [16]. Exon inclusion levels can be calculated using junction reads alone (depicted in the bottom of figure 2.4), as in the case of VAST-TOOLS and jSplice [9, 35], although MISO and rMATS were specifically designed to use additional exon-spanning reads to obtain PSI values with greater precision [14, 15]. Exceptionally, the quantification of intron retention events requires not only junction reads but also mid-intron and retention reads to distinguish these events from other transcript variations (figure 2.5) [34].
The process to quantify alternative splicing events can take a long time if programs use complex and accurate algorithms; for instance, MISO and rMATS use time-consuming Bayesian inference to properly identify to which isoforms the sequencing reads belong to [14,15]. Conversely, programs like SUPPA and jSplice rely on already processed data to estimate those same values, improving the speed of calculations by orders of magnitude while retaining enough accuracy when compared to previous methods [16, 35].
2.3. Analytical Tools
Figure 2.5: Quantification of an intron retention event requires junctions reads (illustrated as spliced intron reads), mid-intron reads and retention (i.e. exon-intron junction) reads. Image retrieved from [34].
junction read counts as input to measure the levels of exon inclusion [11,35]. This allows these programs to quantify data from available large-scale databases like TCGA — a human tumour data repository that also includes matched normal samples2 in a smaller scale [10] — and Genotype-Tissue Expression project (GTEx) — a database of multiple normal human tissue data [36]. Usage of both databases is extensively reported in the literature [6, 7, 37, 38].
The quantification of alternative splicing events is followed by statistical analyses, including differ-ential splicing analysis. Although some of the previously mentioned tools also perform downstream analyses of alternative splicing, they mainly focus on its quantification.
2.3
Analytical Tools
There are many tools that analyse transcriptomic data. However, most do not focus on alternative splicing [13,39,40]. The few programs that do, either present over-simplistic differential splicing analysis or no proper downstream analysis to assist its biological interpretation. Some of the current tools for splicing analysis include:
• TIN [41] is an R package to analyse alternative splicing data in cancer; yet, the package does not have a graphical interface; also, instead of using data from RNA-seq, TIN bases the analyses on micro-array3data.
• VAST-TOOLS [9] is a command-line tool written in Perl and R that performs limited analyses and inflexible (i.e. not explorable nor personalisable) visualisations from raw data.
• AltAnalyze [11] is a Java program with a graphical user interface that performs limited analyses based on junction reads but its documentation lacks information on splicing quantification. • SpliceSeq [42], a Java software that identifies alternative splicing patterns in RNA-seq data. A
particularly relevant approach is TCGA SpliceSeq [12], a web version of SpliceSeq for TCGA data that can focus on a given gene of interest or on all genes with significant splicing variation and show the respective exon inclusion levels for a given tumour type compared to normal tissue; 2Matched normal samples are retrieved from the same tissue where the tumour was found or from blood of the same patient. 3
Chapter 2. Concepts and Related Work
a particular interesting feature is that it allows to make comparisons across multiple tumour types at once.
• SUPPA [16] is a program developed in Python that got recently updated to calculate differential splicing and cluster alternative splicing events according to their inclusion levels across multiple conditions.
The alternative splicing analyses performable by the listed programs are seriously limited by their inflexibility: they do not allow to dig deeper into the data. For instance, in all cases mentioned, clinical data cannot be used to run survival analysis based on alternative splicing profiles. Therefore, there is a need for a more flexible tool with the capability to process and perform proper downstream analyses of alternative splicing in cancer through the use of an interactive graphical user interface.
Chapter 3
Materials and Methods
3.1
R Statistical Language
The R statistical language (also known as GNU S) is a free cross-platform programming language dedicated to statistical and graphical computation [43]. The R language can be expanded by installing packages available from online repositories.
RStudio [44] is a graphical Integrated Development Environment (IDE) developed to work with R. RStudio Desktop version 0.99.903 with R 3.3.1 was used to develop all the project’s code in a machine running OS X 10.11.6 with 4 cores and 8GB of memory. The following packages were used during package development:
• testthat 1.0.2 to create unit tests [45];
• devtools 1.11.1 to facilitate package development [46];
• microbenchmark 1.4.2.1 to accurately measure the execution of R expressions [47]; • profVis 0.3.2 to visualise profiling data from R [48];
• rmarkdown 0.9.6 to create help documents using markdown and R code [49]; • roxygen2 5.0.1 to comment functions [50].
3.1.1 Packages
The following packages are dependencies of the program:
• data.table 1.9.6 to faster subset, update, group and perform set operations on data frames [51]; • digest 0.6.9 to compare MD5 and SHA-1 hash algorithms [52];
• DT 0.2 to render tables with filtering, sorting and searching features, among others [53]; • fastmatch 1.0-4 to reduce look-up times based on hash tables [54];
• Highcharter 0.4.0 to plot R objects using JavaScript [18].
• httr 1.1.0 to retrieve information from services that provide a Representational State Transfer (REST) architectural style [55];
Chapter 3. Materials and Methods
• miscTools 0.6-16 to employ miscellaneous tools and utilities including vectorised functions of interest [57];
• plyr 1.8.4 and dplyr 0.4.3 to manipulate and analyse data [58, 59]; • R.utils to incorporate many programming utilities [60];
• rlist 0.4.6.1 to easily work with lists [61]; • Shiny 0.14 to create a web application [19];
• shinyjs 0.6 to extend the JavaScript operations from Shiny [62]; • Sushi, a Bioconductor package, to visualise genomic data [63];
• XML to parse and generate Extensible Markup Language (XML) files [64].
Standard packages bundled with R used throughout the project bundled with R (like utils, stats and survival) are not listed.
3.1.2 External Libraries
Shiny [19] includes the Javascript libraries jQuery 1.12.4, ion.RangeSlider 2.1.2 (slider input) and selectize.js0.12.1 (jQuery-based select box). Shiny also includes the Bootstrap 3.3.7 (web development framework) and FontAwesome 4.6.3 (Cascading Style Sheets (CSS) library for icons). The package Highcharter [18] uses Highcharts 4.2.4 (JavaScript-based plots) and the package DT [53] uses DataTa-bles1.10.5 (jQuery-based tables).
The minimised source code of the following JavaScript MIT-licensed libraries are included in the package: fuzzy.js 0.1.0 for approximate string matching1 and jquery-textcomplete 1.3.4 to present text completion suggestions from a dropdown menu2. The CSS MIT-licensed library Animate.css is also included to provide cross-browser animations like fade in and out3.
3.2
Data Retrieval
Firehose-formatted TCGA data (like clinical information and RNA-seq junction read counts) are retrieved from Firebrowse through its RESTful service [65]. Ensembl [66] and UniProt4 also provide services based on a REST architecture style which are used to retrieve genetic information like genomic position, mRNAs and proteins of a given gene. Additionally, the PubMed Central’s RESTful service is used to retrieve research articles related to the selected alternative splicing event [67].
To retrieve data from the aforementioned RESTful services, the R package httr is used. httr makes it easier to use HTTP methods for RESTful services like GET, POST, PUT, PATCH and DELETE [55]. 3.2.1 Alternative Splicing Annotation
An alternative splicing annotation file contains the genomic coordinates of the splice junctions for each splicing event. The annotation file for the Human genome (hg19 assembly) is provided with the
1https://github.com/bripkens/fuzzy.js(last accessed on 20 September 2016) 2
https://github.com/yuku-t/jquery-textcomplete(last accessed on 20 September 2016)
3https://daneden.github.io/animate.css/(last accessed on 20 September 2016) 4
3.3. Alternative Splicing Quantification
package and was prepared based on the available annotations from the following alternative splicing quantification tools: MISO [14], VAST-TOOLS [9, 34], rMATS [15] and SUPPA [16].
While the alternative splicing event annotation from MISO and VAST-TOOLS can be retrieved on-line, the annotation from SUPPA and rMATS is only obtainable after running the programs with an mRNA annotation file stating the coordinates of all mRNAs and respective exons. This file is down-loadable from the University of California Santa Cruz (UCSC) Table Browser [68] in the Gene Transfer Format (GTF) format as required by both programs. The mRNA annotation file should contain the gene and mRNA identifiers in each line, although the gene identifier from the downloaded file is actually the transcript identifier given a possible bug with the chosen format. To resolve this issue, we retrieved the file in text file (TXT) to create a table with the matches between gene and transcript identifiers, replacing the incorrect gene identifier in the GTF file.
Event annotation files from the different programs were cross-referenced and combined by matching the chromosome, genomic coordinates and strand of the alternative splicing events. This combined anno-tation is placed alongside the application to be used when estimating alternative splicing quantification. Table 3.1 shows the number of annotated alternative splicing events available from each program.
Table 3.1: Annotated events retrieved from programs that quantify alternative splicing. Alternative splicing event type VAST-TOOLS rMATS SUPPA MISO
Skipped Exon SE 142 806 45 983 48 467 47 444
Retained Intron RI 166 647 5 544 6 774 5 990
Alternative 5’ Splice Site A5SS 13 748 4 906 17 305 12 813 Alternative 3’ Splice Site A3SS 18 007 9 057 16 881 16 665
Mutually Exclusive Exon MXE 2 333 5 114 2 721
Alternative First Exon AFE 51 119 75 604 18 989
Alternative Last Exon ALE 8 958 18 748 9 863
Tandem 3’ UTRs 2 656
3.3
Alternative Splicing Quantification
Figure 3.1: Alternative splicing is quantified using (1) an alternative splicing annotation file containing the genomic coordinates of splice junctions and (2) a file with the number of reads aligning with each splice junction (junction read counts) for each sample.
As previously mentioned (subsection 2.2.2 Quantifica-tion), alternative splicing is quantifiable by programs such as MISO [14], AltAnalyze [11], VAST-TOOLS [9, 34], rMATS [15], jSplice [35] and SUPPA [16], but only AltAn-alyze and jSplice accept junc-tion read counts as input to measure the levels of exon in-clusion [11, 35].
Chapter 3. Materials and Methods
In a similar fashion, our program quantifies alternative splicing from processed data available in online databases, thus skipping the time-consuming step of processing raw data. Alternative splicing quantification is performed using junction quantification from TCGA and the alternative splicing anno-tation combined from multiple sources (figure 3.1).
The PSI metric is used to quantify alternative splicing through the proportion of isoforms that include a certain exon. This can be estimated by the ratio of normalised number of aligned reads (read counts) that support the inclusion isoform to the normalised reads count supporting the exclusion isoform [2, 32, 33]. The alternative splicing event types supported by the program and the respective formula used to measure PSI values are summarised in table 3.2.
Table 3.2: Quantification of alternative splicing event types using junction read counts supporting the inclusion and exclusion of an exon. C1A and AC2represent read counts supporting junctions between a
constitutive and an alternative exon and therefore alternative exon inclusion, while C1C2represents read
counts supporting junctions between the two constitutive exons and therefore alternative exon exclusion. The splice junctions are illustrated in figure 3.2 for convenience.
Alternative splicing event type Acronym Quantification
Skipped exon SE Ψ = (C1A + AC2)/2
(C1A + AC2)/2 + C1C2
Mutually exclusive exon MXE Ψ = (C1A1+ A1C2)
(C1A1+ A1C2) + (C1A2+ A2C2)
Alternative 5’ splice site
Alternative first exon A5SSAFE Ψ = AC2
AC2+ C1C2
Alternative 3’ splice site
Alternative last exon A3SSALE Ψ = C1A
C1A + C1C2
Figure 3.2: Splicing junctions used to measure alternative splicing by event type. Alternative exons are coloured in orange and green, while constitutive exons are coloured in blue. The green alternative exons in alternative first and last exon events are considered as constitutive, as each event can only consist of one alternative exon.
Splicing events with a total read count (i.e. the sum of inclusion- and exclusion-supporting read counts) below a given threshold are discarded from the analyses. By default, this user-adjustable
thresh-3.4. Data Analyses
old is set to 10 reads.
3.4
Data Analyses
Principal component, survival and differential splicing analyses were employed in the exploration of alternative splicing quantification data and their combination with clinical information, being discussed below.
3.4.1 Principal Component Analysis
Principal component analysis (PCA) is an algorithm to reduce the number of dimensions in a data set by rotating the variables through multiple dimensions and identifying combinations of these variables that characterise most of the variation. These combinations are called principal components and they allow to represent the data with a fewer number of dimensions, thus making it easier to plot and group data samples according to the variance associated to the respective principal components [69].
When performing PCA on a data matrix, no value can be missing. Missing values have to either be removed (implying the removal of a whole row or column) or imputed (replacing them by an operation on remaining values, like the mean or the median). However, the removal of columns for a small number of missing values may have the undesired effect of losing useful information. Instead, a threshold can be defined to ensure that columns with a low number of missing values have them replaced by the median value of the column, while columns with a large amount of missing values are discarded.
3.4.2 Survival Analysis
Survival analysis examines the expected duration of time until the occurrence of one or more events of interest, such as death in the context of clinical data. This kind of analysis can estimate patients’ survivability in different conditions (for instance, to compare disease treatments) [70–72]. The tools to perform and plot survival curves are built-in in R through the survival package [73, 74].
Kaplan-Meier curves are commonly used to estimate the proportion of a population that would sur-vive a given length of time under the same circumstances, given a set of observed survival times. To test if two curves are statistically different, the log-rank test is used [70, 72].
According to [72], different types of survival curves are used according to the event of interest: • Overall survival curves use death as the event of interest, which provides a sense of the group
survivability;
• Disease free survival curves focus on the relapse of a disease as the event of interest and these curves are lower than overall survival curves given that patients may have relapsed but not died; • Progression free survival prioritise the progression of a disease (for instance, tumour growth or
spread) as the event of interest to isolate treatment outcomes from the disease;
• Disease specific survival or cause specific survival curves highlight death from the disease of interest which may be misleading, given the limited events retrieved after removing patients that have disease relapse or non-related deaths (this may even exclude patients that died by treatments or other factors related to the disease).
Chapter 3. Materials and Methods
The clinical data retrieved from TCGA contains useful information for survival analysis including time (in days) to patient’s last observation, death, new tumour event after initial treatment and surgical removal, as well as drug and radiation treatment start and end times.
One important aspect of survival analysis is to track when patients drop from the study to distinguish them from the patients that underwent an event of interest. This is relevant to data censoring. Events are censored if they either occurred before subject enrolment (left-censoring) or, as it is more usual, if the subject left the study or the study ended before the event occurrence (right-censoring). Censored events are tick-marked in the survival curves [70–72].
Another type of censoring is known as interval-censored survival analysis, which is useful to study events whose exact time of occurrence is unknown, even though data are available before and after the event occurred. However, as none of the stakeholders is sufficiently familiar with this method, it was not a focus of this work.
In order to explore the effects of several variables that affect survival, the proportional hazards regres-sion analysis (also known as Cox regresregres-sion model or simply Cox model) is used. The Cox model also estimates the risk of death (hazard) for an individual given a set of prognostic variables [70]. Although the Cox model is commonly used in survival analysis, a new statistical approach to analyse the effect of mRNA isoform variation in survival has recently been purposed [75]. This method will be considered for future implementation.
3.4.3 Differential Splicing Analysis
Differential splicing analysis is performed over the quantification of a given alternative splicing event between data groups (for instance, tumour versus normal samples). It usually consists in using statistical tests that make no assumptions about the data distribution. Such statistical tests are known as non-parametric [76–78] and they include:
• The Wilcoxon rank-sum or Mann-Whitney U test compares the median of two groups and if the observations in one of them tend to be larger than in the other [76, 78];
• The Wilcoxon signed-rank text performs an analysis of median ranks to access if two paired groups belong to different populations [78];
• The Kruskal-Wallis rank sum test performs a variance analysis to check if two or more groups are similar [76, 78];
• The Levene’s test tests for variation differences between two or more samples [79].
Although non-parametric tests are valid for most data, they generally have lower statistical power than parametric tests. Finding the correct tools to efficiently test hypotheses from splicing data is chal-lenging. Reportedly, the distribution of exon inclusion levels (PSI values) suggests that each exon tends to be nearly always included or always excluded in a given cell (see figure 3.3) [80]. Therefore, it has been purposed that PSI values follow a beta distribution [14, 81–83]. A beta regression can then be used to model exon inclusion levels directly, using the R package betareg [83–85] that can be integrated in the future.
3.5. Version Control
Figure 3.3: PSI distribution of splicing events from highly expressed genes in individ-ual cells (top) and populations (bottom). Adapted from [80]. Given the sheer amount of splicing events profiled, significance
must be corrected for multiple testing. The application can apply sev-eral p-value adjustment methods from the family-wise error rate (Bon-ferroni, Holm, Hochberg and Hommel corrections) and false discovery rate (Benjamini-Hochberg and Benjamini-Yekutieli methods) [86].
3.5
Version Control
Version Control Systems (VCSs) allow to track each change made to a working repository and make it easy to check the code history and to revert a bad change [87]. One of the most popular VCSs is git for its high-level abstraction compared to older VCSs [88]. The project makes use of git and it is hosted as a public repository in GitHub5.
RStudio supports common tasks of version control with git, includ-ing: (un)stage changes, commit changes, amend last commit, show history log, show file diffs, push and pull, among others [89].
3.6
Testing Tools
3.6.1 Continuous Integration and Code Coverage
After each change to the GitHub repository, the Continuous Integration (CI) software Travis-CI runs R CMD buildand R CMD check on the project6. This ensures the package can be built from scratch. Travis-CI tests the package in virtual machines running Ubuntu 12.04.5 LTS Server Edition (64-bit) with 2 cores and 7.5GB of memory7.
In the end of the automated build, Travis-CI runs CodeCov, a remotely hosted tool that tests a project’s code coverage, i.e. what lines of code are being tested or not by the unit tests8.
The CI service AppVeyor is used to build and test the package on a virtual machine using Windows Server 2012 R2 (64-bit) with 2 cores and 4GB of memory9.
3.6.2 Benchmarking
To measure the time to load data, quantify alternative splicing (skipped exon) and perform differential splicing analysis, normal versus tumour comparisons were separately run 10 times with the same settings for different tumour types in a machine running OS X 10.11.6 with 4 cores and 8GB of memory. The visual interface of the program was run in Safari 10.0 and RStudio Desktop version 0.99.903 with R 3.3.1.
5
https://github.com/nuno-agostinho/psichomics
6These commands need to pass with no errors or warnings for the package to be accepted in Bioconductor (subsection 4.1.1) 7
https://docs.travis-ci.com/user/ci-environment/(last accessed on 14 September 2016)
8https://codecov.io(last accessed on 14 September 2016) 9
Chapter 3. Materials and Methods
3.6.3 Usability Testing
Usability testing was performed with 6 members of the Computational Biology Lab at Instituto de Medicina Molecular. The test sessions were conducted according to a detailed script (see section C.1: Script) on a machine running Ubuntu 14.04.4 LTS (64-bit) with 32 cores and 264 GB of memory. The program was run in Firefox 47.0 from RStudio 0.99.902 running R 3.3.1. Each test session lasted between 1.3 to 2 hours.
Chapter 4
Design Decisions
4.1
Programming Language
The free and open-source R programming language focuses on statistical and graphical computa-tion interpreted by a console. The basic funccomputa-tionality of R can be expanded by packages available in online repositories such as The Comprehensive R Archive Network (CRAN) (a general repository of R packages) and Bioconductor (dedicated to store R packages related to biological data analyses [17]).
The R language was chosen over other more commonly-used languages in program development (like Java, C++ or Python) given the interest of the scientific community in R and Bioconductor and the diverse R packages that satisfy many biological data analyses that can be integrated in the package [90–92]. The prospect of biologists contributing with code for custom analysis also influenced this decision. Although there are projects like rpy2 that run R code embedded in a Python process1, these community projects have limitations and compatibility problems with some R packages, which may hinder their adoption.
Nevertheless, one of the major limitations of R is the low performance compared to lower-level languages, even though it is possible to mitigate it when using packages like BiocParallel for parallel programming and Rcpp to run C++ code from R [93].
On the other hand, a significant motivation to develop in R is the Shiny package [19], a web applica-tion framework that allows to create an entire web app using only R code but also allowing to add custom HyperText Markup Language (HTML), CSS and Javascript for more complex applications. Shiny fol-lows a reactive programming model where the output is bound to the input (reactive dependency) and, every time the input changes, the output automatically updates as well according to the new input [19]. Most R packages can be used within Shiny including JavaScript-based packages that allow for graphical visualisations.
4.1.1 Bioconductor’s Package Guidelines
Given that R was selected as the primary programming language, it was also decided to submit the program as an R package to Bioconductor. Bioconductor is an online repository of R packages focused on computational biology and bioinformatics [17] widely used for biological data analysis [92, 94, 95].
1
Chapter 4. Design Decisions
The approval of new packages in Bioconductor must follow guidelines2, including:
• There must be no errors or warnings when building (R CMD build), checking the package for problem issues (R CMD check) and running Bioconductor-specific package checks (R CMD BiocCheck);
• The package size built by R CMD build must be less than 4 MB; • R CMD check must complete within 5 minutes;
• The package must contain documentation illustrating the major uses of the package and compre-hensive help pages for exported functions;
• The package must not contain code from third-parties that cannot be distributed under the specified license;
• The package must include release notes;
• The package can only depend on R packages available in either CRAN or Bioconductor (a specially limiting requirement).
4.2
Prototype
Before defining the architecture of the application, a prototype was developed to test R, Shiny and the IDE RStudio. Both the prototype and the book [96] allowed to understand more about the R language.
For instance, I learned through them how object-oriented and functional programming works in R. A mixed approach using both paradigms was also tested as [97] suggests but one of its negative aspects is that object-oriented programming in R is much more verbose than in languages like Java and C++. Also, methods are related to functions instead of classes as in traditional object-oriented languages [98].
It is also fundamental to know that, when the user loads an R package, all its functions are loaded as well. However, the source files from the package are not available, only its functions. R also does not support function overloading (functions with the same name but distinct implementation) in the same namespace.
4.2.1 Debugging
R offers specialised debugging functions to fix bugs in the code. One example is browser(), which opens a debugging session at an arbitrary code line. This debugging session allows to interactively run arbitrary code from the console and browse the code using commands to execute the next line in a function, step into a called function, finish the execution of the current loop or function and continue regular command execution by exiting the debugging session. RStudio extends the debugging tool by contextually highlighting the debugged line in the source file and showing all defined variables and their corresponding values in the current context [96].
2
Available at https://www.bioconductor.org/developers/package-submission/ (last accessed on 12 September 2016)
4.2. Prototype
4.2.2 Code Performance
Performance can be measured using packages like microbenchmark to compare multiple runs of different R expressions or functions [47].
To improve code performance in R, it is usual to use vectorised functions which are much faster than running the same code in a for loop. Since the for loops used in vectorised functions are written in C, they have comparatively less overhead. There are many vectorised functions for most common cases in R and for those cases when there is no appropriate vectorised function, it is possible to write one in a language such as C++ using the package Rcpp [93, 96]. Yet another way to improve the performance of a function is to use the byte code compiler integrated. This is integrated in R and allows to compile a function to improve its speed, with execution times comparable to a C version of the same function [96]. There are other practices to improve performance which are more akin to other programming lan-guages. For instance, instead of growing an object like a list in a for loop, it is better to allocate the space required for the object before and modify each object’s element in-place [96]. Another example is parallelisation which is supported by the built-in R package parallel [43, 96].
4.2.3 R Packages
R has a set of conventions to create packages that are easily installable in other computers. One of the best reference books about R packages is [98]. This book is divided in chapters according to the organisation of an R package describing each folder and file at the top-level of a package:
• R/ folder for code (i.e. R files)
• DESCRIPTION file for package metadata including package description, dependencies, licence, file loading order and author contact information
• NAMESPACE file for a list of exported functions (i.e. functions meant to be used by end-users) and functions used from other packages
• man/ folder for object documentation • tests/ folder for unit tests
• vignettes/ folder for package tutorials and guides • data/ folder for data to be used by the end-users • src/ folder for compiled code (like C++ code)
• inst/ folder for extra files like external data not to be used by the user, citation information and non-R source files
The best friend of an R package developer is the package devtools, given that it has dedicated func-tions to test the package, properly document the package and its funcfunc-tions, run the examples given in the function comments, create package tutorials and guides (known as vignettes) and build the package itself [46].
Chapter 4. Design Decisions
Code
R packages require files to be stored directly in the R folder to be tested, documented and built in the package. Any files outside this folder or even inside its subdirectories are not tested, documented and built in the package. This is a major problem regarding code organisation. To solve this, files have a shared prefix in its name to define their ”folder”. Still, this leaves the R folder containing many files.
R packages are distributed through a binary package where the functions from the R files are effi-ciently stored but the original source files are not available. R loads all those functions when loading a package.
Package Dependencies
There are two types of package dependencies: the packages that must be present for the package of interest to work (imported packages) and the packages that are not critical (suggested packages). Imported packages are automatically installed alongside the package of interest, while the suggested packages need to be installed by the user. It is also possible to indicate the minimum version required of a package. All package dependencies must be stated in the DESCRIPTION file.
Object Documentation
Object documentation is important to declare how functions work. Specifically in R, functions are documented by writing an individual file based on LaTeX located in the man folder [98]. Although creating a separate file in LaTeX for each function may seem too much work, the R package roxygen2 can handle this. With this package, the developer just needs to create roxygen comments (comments with special prefix and tags) before a given function and run a specific roxygen2 function to create or update the documentation files [50].
A roxygen comment for a function may include a title, a description, type and description of pa-rameters, examples3 and description of the function output. The available tags allow to identify these different sections and many more which can include formatted text like bold, italics and links. Docu-mentation may be applied to datasets and to packages as well and, in the case of packages, it provides a way to describe the most important package components [98].
Documentation also allows to state which functions are accessible when loading the package (ex-ported functions) and which are only for internal use (non-ex(ex-ported or internal functions)4[98].
By default, R loads all functions in files by alphabetical order of the files when loading a package. Although it is possible to change the loading order manually, roxygen2 makes it easier [50].
Vignettes
Vignettes are additional documentation more akin to a guide or a tutorial. Instead of describing a function or a package like object documentation, vignettes elucidate the problems that can be solved with a given package, discussing the most useful functions that are available and how to use them. Vignettes
3These examples are run by default to ensure the code is valid. 4
Note that external functions are the ones that should be used by people who are using the package. It is still possible to use non-exported functions.