CONSUMER EMOTIONS, PERCEIVED IMAGE AND
BEHAVIORAL INTENTIONS TOWARD PORTUGUESE
GASTRONOMY
Ana de Oliveira Pais Costa Moura
Dissertationsubmitted as partial requirement for the conferral of
Master in Marketing
Supervisor:
Prof. Paulo Rita, Professor of Marketing, ISCTE Business School
Co-supervisor:
Prof. Patrícia Arriaga, Assistant Professor, Department of Social and Organizational Psychology (DEPSO), ISCTE-IUL
Abstract
The main aim of the present dissertation was to study the general image of Portuguese traditional food, focusing on attribute perceptions, emotional responses and behavioral intentions of both Portuguese and Foreigners. Overall, we expected that Portuguese perceptions, emotions and behavioral intentions regarding traditional Portuguese food would differ from foreigners. Participants (N= 100 college students; 66 females, 44 males; 47 Portuguese and 53 foreigners; age between 18-65 years; M = 26.8 years), were asked to evaluate their emotional responses, attributes and behavioral intentions regarding 28 food images (14 traditional-Portuguese; 14 non-traditional), while skin conductance responses were being registered. Body dissatisfaction and food neophobia were also evaluated for control purposes. We found that although foreigners are familiar to Portuguese traditional food and consider it stimulating and tasty, they perceive it as unhealthy, difficult to prepare and to find. These results could be useful for the Portuguese gastronomy sectors to improve their image and focus on their target audience.
Resumo
O principal objectivo desta dissertação é estudar a imagem da comida tradicional portuguesa de forma geral, com enfoque na percepção de atributos, respostas emocionais e intenções comportamentais de portugueses e estrangeiros. Esperamos que as percepções, emoções e as intenções comportamentais dos portugueses sejam distintas das dos estrangeiros em relação à comida portuguesa. Foi pedido aos participantes da experiência (N= 100; 66 mulheres, 44 homens; 47 portugueses e 53 estrangeiros; com idades entre os 18-65 anos; M = 26.8 anos) que avaliassem 28 imagens de comida (14 comida tradicional portuguesa; 14 não tradicional) em relação às suas emoções, os atributos das comidas e as intenções comportamentais, enquanto se media a condutividade da pele e se registavam os resultados. Para efeitos de controlo também se avaliou a insatisfação corporal e a neofobia alimentar. Descobrimos que embora os estrangeiros estejam familiarizados com a comida portuguesa e a considerem estimulante e saborosa, esta é percepcionada com pouco saudável e difícil de preparar e de se encontrar. Estes resultados podem ser úteis para os sectores da gastronomia portuguesa melhorarem a sua imagem e focarem-se mais no seu público alvo.
Palavras-chave: Comida tradicional portuguesa, emoções, intenções comportamentais,
Acknowledgements
I would like to express my gratitude to my supervisors Professor Paulo Rita and Professor Patrícia Arriaga for their guidance, engagement and support through this process.
I would also like to thank my family. My parents especially, for their role in allowing me to dream on doing this on the first place. Last, to Diogo, for his unconditional presence.
Table of Contents Abstract... i! Resumo ... ii! Acknowledgements... iii Table of Contents ... iv List of Tables ... v List of Figures... vi
List of Appendix ... vii
Introduction ... 8!
1.!Literature Review... 10
1.1 Gastronomy in Tourism and Portugal ... 10!
1.2 Factors influencing food consumption ... 13!
1.2.1 Country of Origin... 13!
1.2.2. Food neophobia and involvement ... 14!
1.2.3 Body dissatisfaction and dietary restrictions ... 15!
1.2.4 Gender ... 15!
1.2.5 Smoking behavior... 16!
1.3. Emotions, perceptions and behaviors concerning food ... 16!
1.3.1 Emotional Responses to Food ... 16!
1.3.2 Food attributes perceptions... 16!
1.3.3 Behavioral Intentions... 18!
2. Research Hypotheses ... 19!
3. Method ... 21!
3.1 Participants ... 21!
3.2 Measures and Stimuli... 22!
3.3 Procedure ... 31! 4. Results ... 34! 4.1 Preliminary Analysis... 34! 4.2 Hypotheses Testing... 36! 5. Conclusions ... 41! 5.1 Discussion ... 41! 5.2 Managerial Implications... 44!
5.3 Limitations of the Study and Future Research ... 44!
List of Tables
Table 1 | Nationality of the Foreigner Participants ... 21!
Table 2 | Gender, Smoking and Dietary Restriction as a function of Nationality... 21!
Table 3 | Characterization and subjective evaluation of the stimuli... 27!
Table 4 | Comparison between traditional Portuguese food and non-traditional food... 30!
Table 5 | Age, How long did you finish eating, Food Neophobia and Body Dissatisfaction, as a function of Participant’s Nationality ... 34!
List of Figures
Figure 1 | Self-Assessment Manikin ... 22! Figure 2 | Illustration of the experiment... 25! Figure 3 | Placement of the electrodes on the midphalangeal sites ... 32!
List of Appendix
Appendix 1 | Investigation Protocol... 51! Appendix 2 | Correlations between emotional responses, attribute perceptions and behavioral intentions for all participants ... 66! Appendix 3 | Correlations between emotional responses, attribute perceptions and behavioral intentions by nationality ... 72! Appendix 4 | Traditional Portuguese food images ... 78! Appendix 5 | Non-traditional Portuguese food images ... 79!
Introduction
“Ao mesmo tempo reencontramos a nossa identidade, a nossa maneira original de ser e de sentir – que se manifesta com toda a sua diversidade e exuberância no receituário
tradicional.”
(Modesto, 1984; p.4)
Most of the food studies attempt to investigate the consumer’s emotional responses to food (King and Meiselman, 2010; Desmet and Schifferstein 2008) and the food attribute perceptions (Almil et al., 2011). However, not much is said about the perceptions and emotions of consumers regarding traditional food. Although Almil et al. (2011) developed a research on the attribute perceptions of traditional food among six different countries, the emotions and the behavioral intentions of consumers were not taken into consideration.
Hall et al. (2003) developed several studies regarding the importance of traditional food on the tourist experience and were part of the few that specifically studied the Portuguese case. Tourism organizations are recognizing the potential of culinary tourism as a powerful tool to promote destinations since food, wine, and dining are considered key products of the tourist experience (Ottenbacher & Harrington, 2013). Global Report on Food Tourism (2012) revealed that Portugal should take advantage of traditional food and wine as a way-out of the economic crisis, as both are seen as great economic prospects for the country. In Turismo de Portugal (2007), it is stated that tourism has great strategic importance for the Portuguese economy, although there is still some aspects to be achieved and one of them is “creating a stronger image before demanding customers” (Turismo de Portugal, 2007, p. 1).
Although Portugal has a wide range of products that may turn the country into a food and wine destination with great potential, Portuguese food suffers from a lack of familiarity (Hall et al. 2003), both from people who already visited the country and people who never visited. In one of the authors’ research, participants were asked to identify three dishes, which could be considered synonymous with each of the countries. As expected, the matching was higher for countries most visited and poorest for countries less visited. In the case of Portugal, the level of food matching by both visitors and not visitors was lower than the level of food matching concerning countries not visited. In Portugal, both visitors and non-visitors could
Considering that there are no studies that combine emotional responses, attribute perceptions and behavioral intention regarding traditional food, and responding to the issue that Portuguese traditional food is seen as a great economic prospect for the country, this study seeks to analyze Portuguese food image by studying the perception of the food products (perceived image).
Therefore, the main aim of this research is to reveal the general image of Portuguese traditional food from three different perspectives: emotional responses, attribute perceptions and behavioral intentions. More specifically, we want to study the differences among Portuguese and foreigners’ perceptions of Portuguese traditional food on several attributes and compare it with non-traditional food, in order to gain insights on consumer’s expectations.
Based on the country of origin effect we expect differences on the Portuguese traditional food perceptions of Portuguese and foreigners. Plus, we expect that relevant factors like food neophobia, food involvement, body dissatisfaction, dietary restrictions, smoking behavior and gender influence food consumption. Therefore, these should be taken into consideration as control variables.
1. Literature Review
For Anholt (2004) countries and regions are “places trying to compete with one another in the global marketplace by building their brands” (p.4). Tourism offers a “series of experiences”, achieved through the combination of a diverse array of products and services. Including gastronomy related ones. For visitors, the product is the total experience, covering the entire set of all aspects and components, including attitudes and expectations (Soteriades, 2012). The ultimate aim of tourism marketing is to create a strong image that can add value to destination preference over time (Stanković & Đukić, 2009). Kotler & Gertner (2002) introduced the concept of country image, “a place’s image is defined here as the sum of beliefs, ideas and impressions that people have of that place. Images represent a simplification of a large number of associations and pieces of information connected with a place” (p.251). A place image is both the attribute perceptions of destinations and the holistic impression made by the destination (Echtner & Brent Ritchie, 1991).
Destinations with a strong and positive image have a higher probability of being chosen by tourists (Hunt, 1975) because a positive image creates positive consumer expectations, which lead to product purchase (Almli et al, 2011). Valls (1992) suggests a definition from the consumer’s perspective, which defines a brand image of a country as a set of consumer perceptions. However, the brands’ image in consumer’s mind does not always match with the image of the company (or the place) it intends to transmit (Lopes, 2011). As such, the author suggests three different analyzes: the perceived image (how the target segment perceives the brand); the actual image (strengths and weaknesses), the image perceived by the company (based on an internal audit); and, finally, the analysis of the desire image (how the company wants to be perceived by the target segment). The author suggests these three studies because there are considerable differences between them. Additionally, latest research on this matter admits that the overall image of the destination is a combination of cognitive (destination image is evaluated by the attributes of its resources and attractions) and affective (referring to feelings and emotions raised by tourist destinations) dimensions (Beerli & Martín, 2004).
1.1 Gastronomy in Tourism and Portugal
Mohd et al. (2009), tourism activities can go beyond the accommodation, leisure, recreation, sports, culture, transportation and business.
Dictionaries define Gastronomy as the study of good eating. According to Gastronomy (1994) gastronomy is much more than that;; it is the “The art of science of good eating. A style of cooking or eating”. Hjalager and Richards (2002) explain that Gastronomy is not only difficult to define, but the word, just like ‘culture’, has become more loaded over time.
There is a critical relationship between tourism and gastronomy (Ottenbacher & Harrington, 2013) because food is an important element of the “environmental bubble” that surrounds most tourists on their travels. Any destination offers the culinary delights, recipes, chefs and cultural baggage that make gastronomy an ideal product for tourist consumption (Fields, 2002).
For many people, food is highly experiential (i.e. much more than functional) when it is part of the travel event and it can take a new significance and meaning (Hall et al., 2003). “Even the most basic meal can be etched in memory forever when it is eaten surrounded by awe-inspiring scenery or at the end of a special day exploring a new city” stated the authors (Hall et al., 2003, p.60). Memorable food and drink experiences are proposed not only because they significantly contribute to travel motivation and behavior but also because they influence the way in which tourists experience a tourism destination (Wolf, 2006). More and more people travel and visit new countries/regions in order to taste genuine and unique gastronomy products (Smith and Costello, 2009). As a consequence, many organizations are recognizing the importance and potential of gastronomic tourism as a great tool to promote destinations (Hunter, 2006). It is important to recognize gastronomy as an element of the cultural touristic experience as Santich (2004) argues that gastronomy is an experience of participation in other cultures and of a relationship with people and places with a strong sense of their identity. We can expect that a study of tourists’ food consumption behaviors and experiences would be extremely important to food related stakeholders, such as restaurant and cafe owners, cooking schools, festival organizers, hotel and resort managers, bed and breakfast operators, and food producers (Hall et al, 2003).
We often regard eating as a necessity rather than a leisure activity, but Hjalager & Richards (2002) pointed, “food structures the tourist day” and eating out is a rising form of leisure where meals are consumed for pleasure, more than for necessity (Global Report on Food Tourism, 2012). As large numbers of the tourist’s experiences are spent either
consuming food or deciding what and where to consume it, one important task is to find a strategy to add value to the eating experience in order to make it unforgettable.
Gastronomy is the only form of tourism that combines all 5 senses – visions, tactile, auditory, taste, and olfaction (Kivela & Crotts, 2006), and it is the most important and relevant determinant of tourist satisfaction, followed by “price and quality” and “atmosphere” aspects (Correia, Moital, da Costa, & Peres, 2008).
We grow up eating what our parents and our society tell us to eat. “We eat what is available” (Lovatt, 1989) but there is a difference in the manner in which different societies prepare similar food products (Hegarty & O'Mahony, 2011). Hjalager & Richards (2002) argue the consumption of food has recently become global, and tourism is a key piece in this change. Even though the growing globalization of the food markets has promoted the production of uniform and cheap food products (Vanhonacker et al. 2013) the consumer demands for traditional food has increased in many western countries.
There is a wide literature available on traditional food, mostly related to temporal, territorial and cultural dimensions (Bertozzi, 1998; EU, 2006; Jordana, 2000; Truefood, 2006). However, these are the food professionals’ perspective definitions, and they don’t necessarily match with consumers’ reality (Almil et al, 2011). Many studies were conducted to measure consumers envision of traditional food and, as provided by Pieniak et al. (2009), European consumers perceive traditional food as “a product frequently consumed or associated with specific celebrations and/or seasons, normally transmitted from one generation to another, made accurately in a specific way according to the gastronomic heritage, with little or no processing/manipulation, distinguished and known because of its sensory properties and associated with a certain local area, region or country” (p. 348).
Food and wine are strategic elements for Portugal and they could be considered differentiated components of the destination’s tourism offer. Variety and contrasts are two aspects that characterize Portuguese cuisine “[…] from seafood and fish (considered one of the best in the world) through meat, cheese, sweets, olive oil and wines of international standards. Portugal is a food and wine destination with a great potential to be exploited” (Global Report on Food Tourism, 2012, p.49). Correia et al. (2008) expected that tourists’ expenses on both product categories would account for a large part of Portuguese restaurants’ income.
Many European countries have an identifiable gastronomy or, rather, key dishes that are strongly identifiable with a specific country. Tourists with only the slightest involvement with food could probably identify the countries connected to pizza, paella, escargot, goulash, bierwurst and roast beef (Italy, Spain, France, Hungary, Germany and England, respectively), these products, and others, have marketing value - they help build an image (Hall et al, 2003). However, Portuguese food suffers from a lack of familiarity. According to the authors, tourists don’t identify the country of origin of Portuguese dishes, unless they have a high involvement with gastronomy or had actually spent time in a variety of Portuguese regions. Therefore, addressing the information needs of the first-time tourist (to Portugal) seem to be a key priority. But these reactions were not expected considering that Portugal played such a crucial part in the development of European gastronomy by introducing a wide range of food items on everyday shopping list across Europe. Items like paprika, pineapples, peppers, tomatoes and potatoes were discovered by Portuguese explorers and are now important components of various national dishes outside Portugal (Hall et al, 2003).
1.2 Factors influencing food consumption
1.2.1 Country of Origin
The region, from which the food comes, is a significant factor for the consumers. Due to globalization, consumers are exposed to a large range of products and services, both domestic and foreigner, and this trend crosses all product categories, from cars to food. The introduction of words as “Coca-Cola”, “McDonald’s”, “Nike”, and many others, has raised the concept of country of origin”, which can influence consumers’ purchasing decisions. While some consumers buy these foreigner products, other hesitates to do it (Kavak & Gumusluoglu, 2006). On the late 80’s, Shimp & Sharma (1987) defined “consumer ethnocentrism” as the beliefs about the appropriateness, indeed morality, of purchasing foreign-made goods/services, which gives to the individual a sense of identity and belongingness in a group. This term was adapted from the general concept of “ethnocentrism” introduced by Summer & Keller (1906). Most studies conclude that there is a tendency for consumers to evaluate more favorably their own country’s products than consumers from other countries (Apil, 2006). These studies lead us to the country of origin (COO) concept, which refers to the effect of a consumer knowing where a product was made on his or her evaluation of those products (Kavak and Gumusluoglu, 2006). According to Apil (2006), COO influences purchase decisions and consumption behaviors in foreigner markets.
Additionally, the country image effect has been known to be product-specific and according to a study made by Kaynak & Cavusgil (1983) food is the product most culturally sensitive. For example Schnettler, Ruiz, Sepúlveda, & Sepúlveda (2008) concluded that for Chileans a country image is the most important information to be on a product label. In other words, COO has a significant effect on people’s perception of gastronomy and consumer attitudes, such as ethnocentrism are assumed to be the antecedents of purchasing behavior (Kavak and Gumusluoglu, 2006).
1.2.2. Food neophobia and involvement
A concept that might be relevant to explain some of the differences observed between various food perceptions is food involvement (Hall et al, 2003). Involvement is a key concept because the consumer behavior and the decision-making process in tourism entail a high level of involvement (Swarbrooke & Horner, 1999). Havitz and Dimanche (1999) concluded that while most ‘products’ score low in involvement, leisure activities always score high levels of involvement.
One of the key measures of involvement is risk (Havitz & Dimanche, 1999), which is also an essential concept when discussing the individual differences observed in relation to the experience of food and wine (Hall et al, 2003). High risk-takers (people with high levels of involvement) tend to search for extreme novel situations and they have an allocentric type of personality; in contrast, psychocentrics tend to seek a more familiar and less threatening environment (Plog, 1994). The work of Plog (1994) suggests that allocentrics are neophilic (they seek for novel settings) while psychocentrics are neophobic (they fear newness).
Neophobia and involvement are, therefore, important concepts in the discussion of the food experience because they can help to understand why individuals avoid certain foods (Fenko et al. 2015). Fischler (1988) distinguished “neophobic1” from “neophylic2” tendencies.
A tendency to neophobia may be noted in foreigner individuals because some traditional products may be perceived as too culturally remote (Bessiere & Tibere, 2013). The reluctance to eat may provide protection from possible consumption of toxic or nutritional inadequate foods. Nevertheless, neophilia has also positive functions as it increases the probability that the individual will consume foods from a wide range of sources, thereby making him/her more likely to ingest all nutrients required. Rozin & Fallon (1987) developed a taxonomy of
motives underlying the rejection of food and conclude that foods are rejected if they are believed to possess negative sensory properties (i.e. bad taste, smell, texture…);; if they are believed to promote harmful consequences (i.e. they are bad for you) and finally, based on the origin of the substance.
People may have uncertainties regarding some foreign gastronomy dishes because what is perceived as disgusting is normally culturally bounded. “Items that may be considered to be desirable foods in one culture can often evoke a disgust response from members of another culture” (Martins & Pliner, 2005, p.215).
1.2.3 Body dissatisfaction and dietary restrictions
Other factor that is important to take in account because it might affect responses to food is the dissatisfaction with the body. Body dissatisfaction can be understood by the discrepancies between the actual image and the ideal image of the body (Valutis et al. 2009)
According to McNamara et al. (2008) emotion responses to food are correlated positively with eating concerns and body dissatisfaction. The level of body dissatisfaction is important to address when evaluating the emotional responses to food stimuli because the degree to which people are satisfied with their own bodies may influence behaviors (Silberstein et al. 1988).
According to The European Food Information Council (Bellisle, 2005), the major psychological determinants of food choice are mood, stress and guilt. In a study developed by (Dewberrya & Ussherb, 1994), people with high dietary restraints reported feeling guilty because of not eating what they think they should, and efforts to restrict food intake can increase the desire for particular foods and lead to what is described as food craving. Dietary restrictions is also an important factor to control when examine perceptions regarding food.
1.2.4 Gender
Wansink et al. (2003) investigated the “comfort” food preferences and they have shown that females identify sweet snack foods (e.g. chocolate, ice cream) as comfort foods, while males select savory foods (e.g. steak, casseroles) as comfort foods. Also, according to the authors females are more likely to report feelings of guilt after the consumption of comfort foods, when compared to males. It is important to take into account the gender of the participants when evaluating their responses to food products.
1.2.5 Smoking behavior
When studying the perceptions and feelings towards a certain food stimulus it is relevant to take in consideration the smoking behavior of the participants because like some other drugs, nicotine increases central nervous system levels of hormones (e.g. dopamine, serotonin) and suppresses appetite and increase body metabolism (facilitate weight loss) (Audrain-McGovern & Benowitz, 2011).
1.3. Emotions, perceptions and behaviors concerning food
1.3.1 Emotional Responses to Food
According to King and Meiselman (2010), food affects the way people feel, and there are lots of researches that study the take into account the association between emotions and foods (Desmet & Schifferstein, 2008). Bernabé et al. (2013) used Self-Assessment Manikin (SAM; Bradley & Lang, 1994) and Skin Conductance to measure emotional responses and psychological reactivity of women towards food images. The electrodermal activity (EDA) can be measured by skin conductance responses (SCR) that have been used in several studies to adress a wide range of topics, including physiological arousal (Boucsein, et al., 2012).
1.3.2 Food attributes perceptions
Almli et al (2011) reached conclusions on the general image of traditional food products, among six different countries, by measuring different attribute perceptions and covering a selection of sensory, health, ethnics, purchasing and convenience factors.
Although in the modern society the attribute convenience is more valued, it had significant negative connections with traditional food (Vanhonacker et al. 2010). Almli et al. (2011), for instance, concluded that convenience may act as a barrier to traditional food consumption. According to Sloan (2008) the main reasons why people rely on convenience foods when preparing dinner are because it “required little effort” or “was easy to make” and “took little time/no planning”. Traub & Odland (1979) suggested the following definition for convenience food: “fully or partially prepared food in which significant preparation time, culinary skills, or energy inputs have been transferred from the homemaker’s kitchen to the
when Costa et al. (2007) concluded that Dutch individuals prepare meals because it has a positive impact on work (i.e., allow participants to avoid stress) and a positive impact on athletic performance (i.e., allow participants to lead a more leisurely life). Almil et al. (2011) found that consumers in five of the six countries studied [Spain, Norway, France, Poland, Italy] reported that their own traditional food is not fast to prepare.
Research conducted by Pieniak et al. (2009) has shown that perceived convenience and healthiness are negatively associated with traditional food, while familiarity and natural content constructs are positive correlated. However, Portugal, as a country with a Mediterranean diet, which more than a eating habit is a lifestyle, has the triad breath, olive oil and wine as the base of its food. Mediterranean diet is characterized by a high consumption of vegetables and fruit, and a moderate consumption of protein, especially red meat. A Mediterranean diet has been revealed a positive effect on the occurrence of diseases and it is associated to a significant improvement in health status (Sofi et al., 2008). Almli et al (2011) found out that Spain and Italy report high levels of healthiness perception concerning their traditional food while, Norway gives relatively low score to the level of healthiness of their own food. In practice, northern countries have more unhealthy and low nutritional food than southern European countries, which are influenced by the Mediterranean lifestyle.
In order to study the perceptions of both Portuguese and foreigners regarding traditional Portuguese food we select three different important constructs from Almil et al. (2011) paper – convenience factors (ease of preparation and availability) and health factors (healthiness). We based this parameter selection on research made by Pieniak et al. (2009) that considered convenice and healthiness as barriers to traditional food consumption. Plus, we also applied in our study a question from the study of Almil et. (20011) which evaluate the personal opion/feelings about traditional food, in our case, Portuguese traditional food. With the inclusion of this direct measurement we gain insights on the general image of Portuguese traditional food.
Moreover, Blechert et al. (2014) developed a database of food-pictures that were evaluated on commonly used perceptual and psychological paramteres like valence, arousal, palatability, desire to eat and recognizability. These parameters are relevant not only because they were previously tested but also because they are recommended for experimental research on eating and appetite. In our study, we considered valence, arousal, palatability and recognizability as attributes of foods, and the parameter desire to eat a emotional response to food, instead of an attribute of the food.
1.3.3 Behavioral Intentions
Martins & Pliner (2005) investigated the factors that contribute to the acceptance of novel foods. In their research the authors presented both familiar and novel foods and asked participants to rate these foods on a variety of measures including: beliefs and feelings about the foods and willingness o try those foods later on this session. Willingness to try is a relevant factor to take into account when studying novel foods so, in order to measure the behavioral intentions of participants concerning traditional Portuguese food, we also took in consideration the parameter “willingness to try”.
2. Research Hypotheses
Our hypothesis will focus on the Portuguese traditional gastronomy as perceived by Portuguese and by foreigners since it has been addressed in the literature review that gastronomy has a great strategic importance for Portugal, but it has little familiarity outside of the country (Hall, 2003).
Taking the latter into consideration and based on the COO paradigm (Kavak and Gumusluoglu, 2006; Apil, 2006), we developed our hypothesis by choosing two dimensions, for comparison purposes (Vanhonacker, Lengard, Hersleth, & Verbeke, 2010): nationality (Portuguese or foreigners) and food type (traditional Portuguese and non-traditional).
In order to test the general image regarding traditional food comparing Portuguese with foreigner participants we expect that:
Hypothesis 1: We expected that Portuguese would evaluate more positively
Portuguese food than foreigners.
In order to test the emotional responses, the food attributes perceptions and the behavioural intentions regarding traditional Portuguese food comparing Portuguese with foreigner participants’ responses towards the Portuguese traditional food stimuli, we expected that:
Hypothesis 2a: Portuguese would have stronger emotional responses when exposed to Portuguese traditional food pictures than foreigners, i.e., would have higher levels of physiological arousal (skin conductance response) and report arousal, as well as self-reported valence (i.e., pleasure) and desire.
Hypothesis 2b: Portuguese would evaluate Portuguese food attributes, such as
valence, arousal, palatability, availability, ease of preparation, and healthiness, in a more favorable way than foreigners.
Hypothesis 2c: Portuguese would be more willing to try Portuguese traditional food
than foreigners.
When comparing Portuguese responses to traditional food versus non-traditional food stimuli we expected that:
responses than the non-traditional food, i.e., Portuguese participants would react with high levels physiological arousal (measured by skin conductance responses), and would report higher levels of emotional arousal, high desire, and positive valence, i.e., pleasure, during exposure to Portuguese traditional food than to non-traditional.
Hypothesis 3b: The traditional Portuguese food would be evaluated in a more
favorable way than the non-traditional Portuguese food, concerning valence, arousal, palatability, availability and healthiness.
Hypothesis 3c: Portuguese would be more willing to try traditional Portuguese food
than to try non-traditional food.
Hypothesis 3d: The traditional Portuguese food would be evaluated as more difficult
to prepare than the non-traditional Portuguese food.
Since foreign participants are not from a specific country we have no priori hypothesis regarding their perceptions of both traditional and non-traditional Portuguese food, thus these analyses were exploratory. We also did an exploratory analysis of the attribute familiarity, since we did not have priori literature to support a hypothesis.
Since foreign participants are not from a specific country we have no priori hypothesis regarding their perceptions of both traditional and non-traditional Portuguese food, thus these analyses were exploratory. We also did an exploratory analysis of the attribute familiarity, since we did not have priori literature to support a hypothesis.
Based on previous literature (Hall et al, 2003; Bessiere & Tibere, 2013; McNamara et al, 2008; Wansink, Cheney, & Chan, 2003; Audrain-McGovern & Benowitz, 2011), we took into consideration the following variables to be controlled: food neophobia, food involvement, gender, body dissatisfaction, smoking behavior, and dietary restriction.
3. Method
3.1 Participants
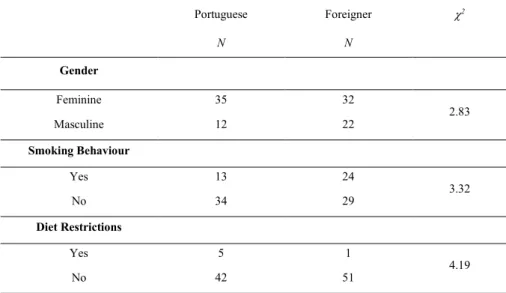
Participants were 100 (66 females, 44 males; age between 18-65 years; M = 26.8 years, SD = 8.9), most of whom were studying, working or visiting the ISCTE-IUL’s campus and recruited randomly inside the university facilities. From the 100 participants, 47 were Portuguese (47%) and the other 53 (53%) were foreigners. The 53 non-Portuguese participants were from 21 different countries among ISCTE international students (see table 1). The proportion of Portuguese and foreigner participants did not statistically differ by Gender, 2
(1, N = 100) = 2.83, p = .092, “Dietary restriction” 2 (1, N = 100) = 4.19, p = .123, and “Smoking Behavior” 2 (1, N = 100) = 2.32, p = .068 (see table 2).
Table 1 | Nationality of the Foreigner Participants Number of People of
Each Nationality Nationality
1 Indian, Estonian, Czech, Iranian, Angolan, Belgian, Argentina, English, Polish, Swiss
2 Dutch, Colombian, Cape Verdeans, American
3 Russian, Croatian
4 German, French
6 Brazilian
7 Spanish, Italian
Table 2 | Gender, Smoking and Dietary Restriction as a function of Nationality
Portuguese Foreigner 2 N N Gender Feminine 35 32 2.83 Masculine 12 22 Smoking Behaviour Yes 13 24 3.32 No 34 29 Diet Restrictions Yes 5 1 4.19 No 42 51
3.2 Measures and Stimuli
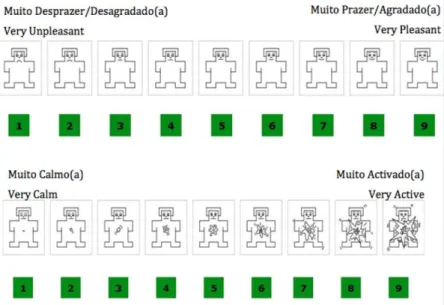
Emotional responses. To measure the emotional responses of participants to all stimuli we used the Self-Assessment Manikin (SAM) (Bradley & Lang, 1994). These subjective ratings were distributed over a 9-point pictorial scale(see figure 1).
Figure 1 | Self-Assessment Manikin
Font: (Bhuiyan, Gustat, Srinivasan, & Berenson, 2003)
For valence, the ratings ranged from 1 (very sad/ unpleasant) to 5 (neutral) to 9 (very happy/very pleasant) affective states. For arousal, the ratings ranged from 1 (very calm/low arousal) to 9 (very excited/ high arousal). We choose SAM because according to Arriaga et al. (2011), ”it is language- and culture-neutral“. For desire, the ratings ranged from 1 (nothing) to 5 (extremely).
Food attributes and willingness to try. Participants evaluated the food images in the following ten parameters: familiarity, valence, arousal, palatability, healthiness, ease preparation, availability, traditional Portuguese, traditional non-Portuguese. Willingness to try the food after the session was also measured. We adapted these attributes from the work conducted by Almli et al (2011). All these parameters were evaluated on a scale from 1 (Nothing) to 5 (Extremely) (see appendix 1).
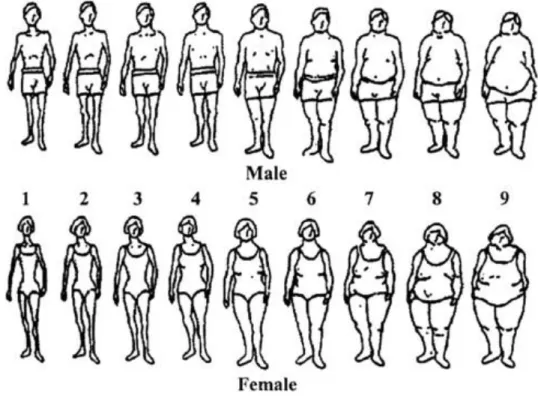
Body dissatisfaction. To measure participants’ perceptions of ideal body image and how it compares with their current body image, we used the nine figure silhouettes developed by (Stunkard, Sorenson, & Schlusinger, 1983) (see appendix 1).
Participants had to rate how they perceived their current body silhouette (the mental representation of their body) by choosing an image that corresponded to their figure. Images 1 and 2 = underweight; images 3 and 4 = appropriate weight; image 5 = slightly overweight; images 6 and 7 = moderately overweight; images 8 and 9 = very overweight. To determine the discrepancy between their own body perceptions and their ideal body, we asked them to rate how they perceived an ideal body by using the same scale. Calculating the absolute value of the difference between the subject’s current body size and the subject’s ideal body size will correspond to body dissatisfaction. For example, if one participant indicated her/his current body size as a 5 and her/his ideal body size as a 3, her score would be 2. If another participant indicated her current body size as a 3 and her ideal body size as a 5, her/his score would be the absolute value of -2, equaling 2. Thus her/his body dissatisfaction would be equal to subject one. Larger scores indicate greater body dissatisfaction. This scale was already reported in various previous studies in several countries, including Portugal, revealing internal consistency, which provide certainty as to the psychometric quality of the instrument and endorses its use in Portuguese empirical studies (Matos & Arriaga, 2010; Leal, 2009).
Food involvement. The level o food involvement was measured by Food Involvement Scale FIS (Bell & Marshall, 2003) and it includes 12 items that measures a person involvement with activities relating to food (acquisition, preparation, cooking, eating and disposal). Participants rated their agreement with each of the twelve items on a 7-point scale with labeled endpoints (1 disagree strongly, 7 agree strongly) (see appendix 1). Half of the items were stated positively and the remaining were negatively. Therefore, for analysis, scoring on the scales for the negatively stated items were reversed (1, 2, 4, 8, 9 and 11). Once reversed, the mean scores for all 12 items were calculated, resulting in a total FIS score. A high score means high food involvement, which means that the individual is concerned with food acquisition, preparation, cooking, eating and disposal. We developed reliability test for both scales. With regard to FIS, the mean values ranged from 4 to 6.15 (M = 4,9).
Although the reliability was adequate for the global sample (Cronbach’s = .75) and for the foreigner sample (Cronbach’s = .82), it was not adequate for the Portuguese sample (Cronbach’s = .67). Since our objective is to compare both groups we cannot implement
this scale because it is not adequate for one of the group sample, so we excluded the variable food involvement from our study. The authors Bell & Marshall (2003) divided the items in two different involvement categories: “set and disposal” and preparation and eating”. We also calculated the relibility of both dimensions: Portuguese sample and “set and disposal” dimension (Cronbach’s = .65);; Foreigner sample and “set and disposal” dimension (Cronbach’s = .62);; Portuguese sample and “preparation and eating” dimension (Cronbach’s = .67);; Foreigner sample and “preparation and eating” dimension (Cronbach’s = .78). Our study only reported a good reliability for the foreigner sample on the dimension “preparing and eating”.
Food neophobia. The level of food neophobia was measured by measured by Food Neophobia Scale FNS (Pliner & Hodben, 1992). It was presented a set of 10 items to be evaluated by the respondents along with a scale of 5-point Likert with labeled endpoints (1 disagree strongly, 5 agree strongly) (Asperin et al. 2011; Woo & Lee, 2013; Aguiar et al. 2009). This scale has been validated several times and it has become one of the standard measures of food neophobia (see appendix 1). Mean scores from all 10 items were calculated resulting in a total FNS score. Higher scores are indicative of greater neophobia since a subject who behaved as neophobically as possible would have ranked the novel foods in each category with a 4, 5, and 6. The FNS proved to be a reliable scale (Cronbach’s = .88) and the mean values ranged from 1.97 to 2.98 (M = 2,39).
General image of the Portuguese traditional food. Participants were asked “How would you describe your personal opinion/feelings about Portuguese traditional food?”. For this measurement, a five-point Likert scale anchored with 1 (“extremely negative”) and 5 (“extremely positive”) was used. High scores indicate that participants have a positive opinion regarding the Portuguese gastronomy.
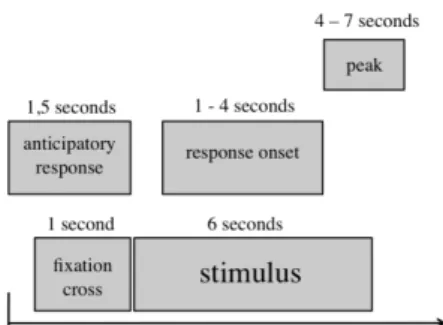
Physiological arousal. Because we want to focus on the emotional reactions to the stimuli (arousal) we measured their skin conductance responses (SCRs) (Radin, 2004). SCRs were measured as the change in electrodermal activity from the pre-stimulus value to the peak 4-7 seconds, with onset between 1 and 4 seconds after stimulus onset. Trials in which SCR did not rise, steadily declined, or began outside the onset window specified above, were
movement artefact were removed from analysis. SCRs were quantified in the following manner: the amplitude of the largest SCR greater than .01 microsiemens that occurred between the first and the fourth second was scored as a response to that stimulus. Following standards set by Boucsein, et al. (2012), SCR magnitudes were recorded, meaning that SCR amplitudes of zero were included in analyses. Based on their pre-established criteria, subjects who exhibited SCR magnitudes of zero to all stimuli were classified as SCR non-responders. We also considered anticipatory responses to changes greater than .01 microsiemens that occurred 1.5 seconds before the stimulus (see figure 2). We had some problems with recording skin conductance data in eight participants, so these participants were excluded from the skin conductance analyses.
Figure 2 | Illustration of the experiment
Food Stimuli. We cooked prepared and photographed 15 traditional Portuguese dishes that were selected with the help of Maria de Lourdes Modesto, author of the Portuguese gastronomy book “Cozinha Tradicional Portuguesa” (Modesto, 1984). In addition to these dishes, and also to compare their responses to non-traditional Portuguese food images, we selected non-Portuguese dishes from a food picture database featuring food images for research (Blechert, Meule, Busch, & Ohla, 2014); also see www.food-pics.sbg.ac.at).
In order to select the most appropriate traditional and non-traditional Portuguese food images, a pilot study was previously conducted. Twenty-one Psychology students were asked to evaluate a total of 45 images of food dishes in nine parameters (familiarity, desire, valence, arousal, palatability, healthiness, traditional Portuguese, non-traditional Portuguese and willingness to try). Based on this pilot study, we select 14 Portuguese dishes (see appendix 4) and 14 non-Portuguese dishes (see appendix 5) that were similar regarding the parameter healthiness, arousal, valence and palatability. We only selected to the category traditional Portuguese dishes the ones that were recognized as Traditional Portuguese dishes (M < 2.5).
The traditional Portuguese dishes contrast with the non-traditional Portuguese ones in terms of the parameters: traditional Portuguese and non-traditional Portuguese (see table 3).
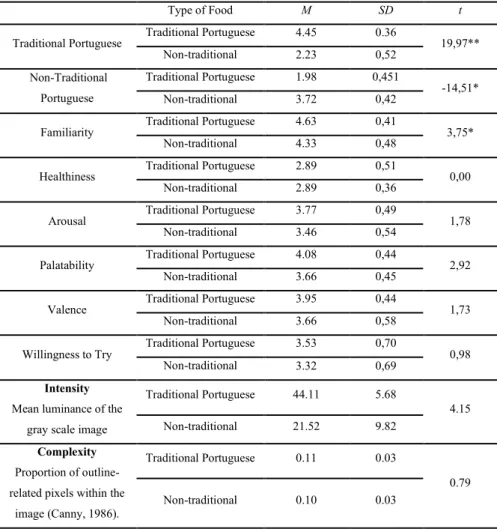
Analyses of the final set of images (28 images) in which we compared Portuguese traditional (n = 14) with non-traditional Portuguese food images (n = 14) on the previous parameters have shown that these two types of stimuli only differed in one category, the familiarity. Portuguese dishes were considered more familiar and than the non-Portuguese dishes Familiarity: t(20) = 3,754 , p = 0,001 (see table 4). The other stimuli attributes were relatively similar (all p > .05). The category of the pictures also did not differ in terms of RGB brightness and contrast (see table 4).
27
Table 3 | Characterization and subjective evaluation of the stimuli
Image
No Item Specific Category food
1 Traditional Portuguese
Traditional
Non-Portuguese Familiarity Desire Valence Arousal Palatability Healthiness
Willingness to
taste Red Green Blue Object
size Brightness Contrast Complexity
Norm. Complexity 1008 Kale and potato broth Traditional Portuguese 5.0 1.4 4.9 3.1 3.4 3.1 3.4 4.3 3.0 .34 .35 .30 .62 47.42 5.66 .07 .12 1013 Custard cake Traditional Portuguese 5.0 1.4 4.9 4.5 4.5 4.3 4.5 2.2 4.4 .42 .33 .25 .66 6.45 61.84 .16 .25 1006 Golden Codfish Traditional Portuguese 4.9 1.5 4.7 4.3 4.5 4.5 4.6 3.1 4.1 .38 .35 .27 .63 56.06 57.19 .09 .15 1005 Codfish in olive oil Traditional Portuguese 4.7 1.7 4.7 3.4 3.7 3.4 3.9 3.9 3.1 .37 .34 .28 .61 57.78 65.77 .07 .12 1009 Pork with clams Traditional Portuguese 4.7 1.6 4.9 4.4 4.5 4.4 4.6 2.7 4.1 .37 .34 .29 .52 36.47 51.13 .05 .10 1003 Duck rice Traditional
Portuguese 4.6 2.0 4.7 4.3 4.3 4.1 4.4 3.2 4.0 .38 .34 .29 .58 57.98 43.33 .07 .12 1004 Shellfish rice Traditional
Portuguese 4.6 2.0 4.7 3.7 4.0 3.8 4.1 3.1 3.5 .41 .34 .25 .63 53.03 42.53 .11 .17 1014 Octopus in olive oil Traditional Portuguese 4.4 2.3 4.2 3.5 3.6 3.4 3.8 3.5 3.3 .39 .34 .27 .57 48.95 6.24 .07 .13 1012 Codfish patties Traditional Portuguese 4.4 1.9 4.6 3.4 3.4 3.3 3.7 2.5 3.0 .40 .34 .27 .53 49.22 52.02 .05 .10 1002 Clams garlic coriander Traditional Portuguese 4.4 1.8 4.7 3.9 4.0 3.9 4.0 3.4 3.5 .37 .35 .28 .61 56.31 69.18 .08 .13 0323 Trout with potatoes Non-traditional 4.2 3.3 4.5 3.0 3.5 3.1 3.6 4.6 3.0 .36 .34 .29 .36 17.49 58.21 .06 .16 1001 Sausage with fried egg and broccolini
Traditional
Portuguese 4.2 2.3 4.7 3.5 3.7 3.5 4.1 2.0 3.0 .41 .34 .25 .59 52.12 58.72 .08 .13
1007
Steak with fried egg and
fries
Traditional
Portuguese 3.9 2.7 4.7 4.3 4.4 4.3 4.6 2.3 4.1 .38 .34 .28 .62 59.63 51.60 .09 .14
1015 Egg and lard pudding
Traditional
Portuguese 3.9 2.5 4.7 3.6 3.9 3.7 4.0 2.0 3.3 .45 .32 .22 .54 45.66 57.35 .02 .04
1
The non-traditional Portuguese dishes were selected among a food database (Blechert, Meule, Busch and Ohla, 2014; www.food-pics.sbg.ac.at). Note: The 28 traditional Portuguese and non-traditional dishes that we selected are in bold (grey lines).
Image
No Item Specific Category food TradPT Trad NonPT
Familiari ty
Desir
e Valence Arousal Palatability Healthiness
Willingness
to taste Red Green Blue Object
size Brightness Contrast Complexity
Norm. Complexity 0337 Beef grilled Non-traditional 3.6 2.9 4.5 3.7 3.9 3.8 3.9 3.0 3.3 .42 .34 .24 .32 26.26 69.32 .11 .33 1010 Custard caramel Traditional Portuguese 3.6 2.7 3.7 3.2 3.2 3.1 3.4 2.3 2.9 .41 .34 .25 .52 45.81 45.11 .09 .17 0001 Cheesecake Non-traditional 3.4 2.9 4.0 3.5 3.8 3.6 4.3 2.1 3.5 .42 .29 .28 .33 3.22 73.51 .05 .16 0493 Spare ribs with French fries Non-traditional 3.4 2.9 4.0 3.5 3.8 3.6 4.3 2.1 3.5 .49 .29 .22 .36 47.59 61.82 .13 .35 0304 Potato gratin Non-traditional 3.4 2.4 4.0 3.7 3.7 3.6 3.8 2.7 3.0 .43 .37 .20 .29 15.85 37.38 .09 .30 0307 Salmon Non-traditional 3.3 3.0 4.4 3.3 3.9 3.4 3.7 4.3 3.1 .37 .33 .30 .31 1.37 42.35 .04 .11 0325 Fruit salad Non-traditional 3.3 2.7 4.9 4.3 4.6 4.3 4.5 4.9 4.1 .46 .36 .18 .27 28.26 6.71 .08 .30 0229 Salad Non-traditional 3.1 3.2 4.4 2.9 3.5 2.9 2.9 5.0 2.8 .45 .36 .19 .31 36.60 61.19 .10 .31 0565 Steak with potato and vegetables Non-traditional 3.1 2.8 4.4 3.5 3.8 3.4 3.8 3.8 2.8 .42 .33 .26 .39 29.51 65.03 .11 .29 0126 Pastries and donuts Non-traditional 3.0 3.5 4.9 4.1 4.3 4.2 4.6 1.5 4.1 .44 .33 .23 .47 43.35 59.33 .16 .35 0556 Viennese Schnitzel with potatoes Non-traditional 3.0 2.9 4.6 3.6 3.9 3.5 3.7 2.7 3.0 .43 .33 .24 .41 25.06 58.35 .08 .20 0196 Salad Non-traditional 2.9 2.9 4.3 2.9 3.6 3.0 2.9 5.0 2.8 .41 .36 .23 .38 4.98 85.37 .10 .27 0316 Spinaches potatoes casserole Non-traditional 2.9 2.7 4.0 2.7 2.9 2.7 3.0 3.0 2.4 .37 .35 .27 .36 26.07 58.71 .10 .28 0219 Salad Non-traditional 2.8 3.0 4.3 2.7 3.0 2.6 2.7 4.9 2.5 .41 .36 .23 .24 22.82 59.72 .09 .37 0350 Quiche Non-traditional 2.8 3.0 4.3 3.4 3.4 3.2 3.6 2.6 3.1 .51 .34 .16 .48 56.52 56.41 .16 .33 0212 Vegetable
mix with dip
Non-traditional 2.7 2.9 4.4 2.4 2.8 2.4 2.5 4.9 2.0 .45 .35 .20 .33 34.73 62.92 .11 .32 0312 Chicken grilled Non-traditional 2.7 2.8 4.0 3.4 3.5 3.0 3.5 4.0 2.9 .39 .33 .27 .43 23.33 58.57 .10 .23 0299 Mixed vegetables Non-traditional 2.6 2.8 3.9 2.0 2.2 1.8 2.2 4.8 1.8 .39 .39 .23 .43 3.00 63.76 .10 .22 0526 Salad Non-traditional 2.6 2.7 4.1 3.4 3.8 3.2 3.4 4.8 3.2 .39 .36 .25 .43 37.49 64.01 .14 .33
29 Image
No Item Specific Category food
Traditional Portuguese Traditio nal Non-Portugu ese Familiar ity Desi re Valen ce Arous al Palatabil ity Healthin ess Willingn ess to try Re d Gre en Blu e Object size Brightn ess Contr ast Complex ity Norm. Complexity
0022 French fries Non-traditional 2.5 4.0 4.9 4.2 4.1 4.1 4.2 1.2 4.1 .44 .35 .21 .48 43.75 5.74 .09 .19 0142 Pasta bake Non-traditional 2.3 2.9 2.4 2.9 3.0 2.9 3.1 2.3 2.9 .50 .32 .18 .29 31.02 58.14 .11 .39 1011 Egg and sugar puffs Traditional
Portuguese 2.2 2.4 2.2 2.6 2.5 2.4 2.6 1.8 2.6 .37 .34 .28 .43 31.34 28.14 .06 .14 0161 Mini chocolate
marshmallows Non-traditional 2.1 3.1 3.7 3.5 3.5 3.3 3.6 1.8 3.2 .38 .32 .30 .47 29.56 7.24 .04 .08 0483 Pancake with fruits Non-traditional 2.0 3.9 4.4 4.6 4.6 4.7 4.6 2.2 4.5 .45 .30 .25 .41 35.51 8.33 .11 .27 0240 Crispy bread with cottage
cheese Non-traditional 2.0 2.8 2.4 1.9 2.3 2.0 2.5 4.2 2.1 .36 .35 .29 .44 3.05 59.79 .11 .24 0489 Pizza with salami Non-traditional 1.9 4.8 4.8 4.4 4.5 4.5 4.6 1.8 4.2 .49 .29 .22 .40 37.81 64.93 .15 .36 0149 Crusty peanuts Non-traditional 1.9 2.3 2.0 2.6 2.6 2.4 2.4 1.9 2.5 .46 .31 .22 .35 29.91 61.39 .07 .19 0003 Burger with French fries
and coke Non-traditional 1.7 4.5 5.0 4.0 4.2 4.0 4.6 1.1 3.6 .49 .32 .19 .33 41.21 6.15 .10 .29 0521 Pasta Non-traditional 1.7 4.0 4.0 2.6 2.8 2.5 2.8 3.9 2.1 .39 .41 .20 .34 26.01 65.75 .08 .24 0188 Doner kebab Non-traditional 1.4 4.4 3.9 3.1 3.1 2.9 3.3 2.0 3.1 .40 .32 .28 .40 27.70 63.33 .08 .21 0564 Sushi Non-traditional 1.0 4.7 4.4 3.5 3.6 3.6 3.7 3.4 3.6 .35 .33 .32 .30 7.26 46.10 .02 .07
Table 4 | Comparison between traditional Portuguese food and non-traditional food
Note: *p<.01; **p<.001; PT = Portuguese
Type of Food M SD t
Traditional Portuguese Traditional Portuguese 4.45 0.36 19,97**
Non-traditional 2.23 0,52 Non-Traditional Portuguese Traditional Portuguese 1.98 0,451 -14,51* Non-traditional 3.72 0,42
Familiarity Traditional Portuguese 4.63 0,41 3,75*
Non-traditional 4.33 0,48
Healthiness Traditional Portuguese 2.89 0,51 0,00
Non-traditional 2.89 0,36
Arousal Traditional Portuguese 3.77 0,49 1,78
Non-traditional 3.46 0,54
Palatability Traditional Portuguese 4.08 0,44 2,92
Non-traditional 3.66 0,45
Valence Traditional Portuguese 3.95 0,44 1,73
Non-traditional 3.66 0,58
Willingness to Try Traditional Portuguese 3.53 0,70 0,98
Non-traditional 3.32 0,69
Intensity
Mean luminance of the gray scale image
Traditional Portuguese 44.11 5.68
4.15
Non-traditional 21.52 9.82
Complexity
Proportion of outline-related pixels within the
image (Canny, 1986).
Traditional Portuguese 0.11 0.03
0.79
3.3 Procedure
Individuals signed an informed consent form before the experience and they received a briefing explaining all the procedure. Participants were eligible to enter a lottery in which a dinner for two people was awarded for their time and effort. We ran the project for a scholarship called SPI that gave us 23 participants. These SPI participants were psychology students who received ECS (credits) for their participation therefore they didn’t enter the lottery.
Upon arrival at the laboratory, participants were asked to wash their hands, remove all bracelets and rings and all the electronic devices like cell phones and watches (Sequeira-Martinho, 1990).
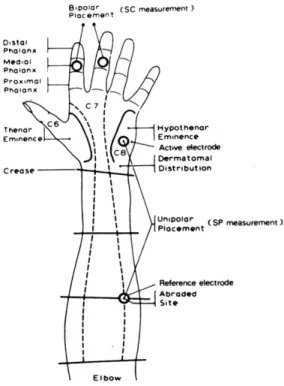
Subsequently, they were asked to sit at a distance of 65 cm from the computer’s monitor and to move as little as possible (Ares et al. 2014). To collect skin conductance, two 8 mm Ag/AgCl electrodes were filled with KY jelly (chlorhexidine gluconate, glucono delta lactone, glycerin, hydro-xyethylcellulose, methylparaben, purified water, sodium hydroxide) and a bipolar placement of the electrodes were followed (Boucsein et al., 2012; Fowles et al., 1981). The literature offers a wide range of alternatives regarding which fingers are the most accurate ones (i.e. more active) to place the electrodes. Boucsein et al., (2012) and Fowles et al., (1981) stated that the placement of the two electrodes will normally be on the palmar surface of the hand and the most popular sites are the medial and distal phalanges of the fingers. We followed Christie (1980) who suggests the placement of the electrodes on the midphalangeal sites of fingers 1 and 2 (index and middle fingers) (see figure 3). Plus, the time since application of the electrodes was been controlled (60 seconds) in all participants in order to achieve a better conductivity of the gel. Skin conductance responses (SCRs) were recorded using Biopac MP100 System. SCR signal was sampled at 1000 Hz. The data was analyzed with AcqKnowledge v. 3.4.1. software.
Figure 3 | Placement of the electrodes on the midphalangeal sites
Font:(Christie, 1980)
Then, participants filled in a questionnaire that comprised questions regarding their sociodemographic and eating habits. This questionnaire also provided information on two exclusion criteria: having eaten less than 1 hour before the experience; or/and having vegetarian/vegan habits.
After filling in questionnaire, the participant was introduced to the experimental setup. Instructions were shown on the screen and participants were asked to evaluate their emotional responses and several attributes of 28 food images.
Each participant viewed each of these 28 dish-pictures individually. Each image appeared on the screen for six seconds and were randomly presented. To fixate participants’ gaze at a pre-defined point, a fixation cross was located on the centre of the screen after each stimulus presentation with duration of 1second (Aires et al, 2014). The task was programmed with E-prime 2..1.242 displayed on a LG Flatron W2253TQ screen with an height of 27 cm and a width of 48 cm.
All pictures had the same size and resolution and color depth (1024 × 768 pixels, 96 dpi, 24 bpp) and were homogenous with regard to background color and camera distance. Participants were asked to evaluate each image regarding their emotional response (measured
by SAM and by desire), their attribute perceptions (familiarity, valence, arousal, palatability, healthiness, ease preparation, availability) and behavior intentions (willingness to try).
Further, participants fill in the body dissatisfaction, food involvement and food neophobia questionnaires. The total experiment lasted from 40 to 50 minutes, per participant. Finally, after the participation is complete, the participants received an explanation of the investigation and its objectives.
4. Results
4.1 Preliminary Analysis
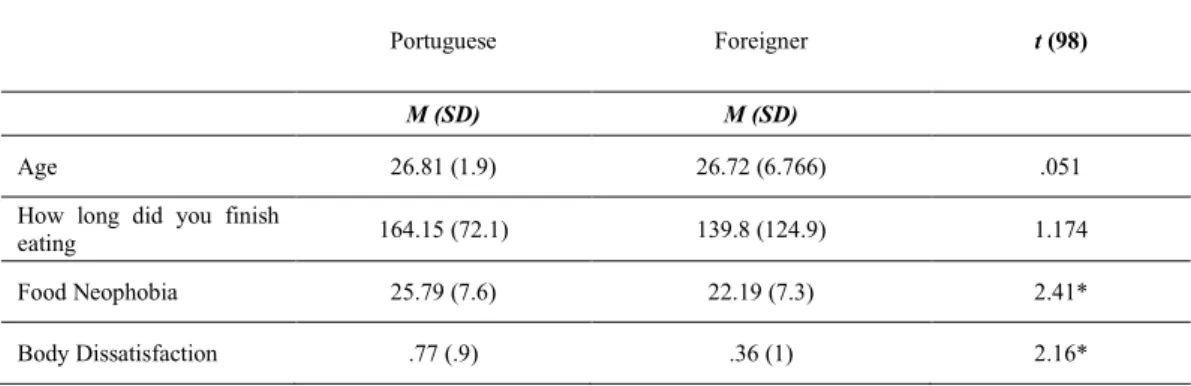
We previously conducted a t-test to identify which attributes could be important to control in the main analyses. As can be seen in table 6, the groups, Portuguese and foreigners, are homogeneous in relation to their age, t (98) = .01, p = .959, and the time taken since their last meal, t (98) = 1.17, p = .243. However, there were statistically differences between Portuguese and foreigners in Food Neophobia, t (98) = 2.41, p = .018, and Body Dissatisfaction, t (98) = 2.16, p = .033. Portuguese were more neophobic (M = 25.79, SD = 7.6) than foreigners (M = 22.19, SD = 7.3), and more unsatisfied with their body (M = .76, SD = .91) than foreigners (M = .35, SD = .96). Thus, we will take into account these two last variables and use them as covariates in the main analyses, for control purposes.
Table 5 | Age, How long did you finish eating, Food Neophobia and Body Dissatisfaction, as a function of Participant’s Nationality
Note: *p<.05
In addition, we also calculated the bivariate correlations between these variables and the main dependent variables. As we can see in appendix 2, the level of food neophobia is negatively correlated with most of the dependent variables, and specially towards the Nontraditional food: Emotional Arousal, r (98) = .298, p < .01, Emotional Valence, r (98) = -.408, p < .001, Stimulus’ Arousal, r (98) = -.418, p < .01, Familiarity, r(98) = -.205, p < .05, Desire, r(98) = -.391, p < .01, Healthiness, r(98) = -.199, p < .05, and Willingness to Try,
Portuguese Foreigner t (98)
M (SD) M (SD)
Age 26.81 (1.9) 26.72 (6.766) .051
How long did you finish
eating 164.15 (72.1) 139.8 (124.9) 1.174
Food Neophobia 25.79 (7.6) 22.19 (7.3) 2.41*
Portuguese food. In other words, the higher the level of neophobia of the participants, the lower their emotional arousal, positive valence, desire, familiarity, perceived healthiness and willingness to try the dishes (both traditional and non-traditional Portuguese). Thus, as expected, the negative perceoption of non-traditional dishes were more likely to be related to the levels of neophobia; food neophobia was also related to less willingness to try food.
We also found that Body Dissatisfaction was negatively correlated with perceived Healthiness of the Non-traditional food, r (98) = -.225, p < .05; in other words, the higher the level of body dissatisfactions, the lower the perceived healthiness of the non-traditional Portuguese dishes. As we can see in the correlation matrix (appendix 3), the higher the level of body dissatisfaction of foreigners participants, lower their perceived Healthiness of the non-traditional Portuguese dishes, r(98) = -.413, p < .01). Because Portuguese participants were also more neophobic (M = 25.79, SD = 7.6) than foreigners (M = 22.19, SD = 7.3) we also calculated the correlations separately for Portuguese and foreigners. As we can see in appendix 3, The negative correlations were mostly found in the Portuguese participants towards the non-traditional food stimuli: the higher their level of food neophobia, the lower their Emotional Arousal, r(98) = .405, p < .01, the Emotional Valence (pleasure), r(98) = -.434, p < .01, Desire, r(98) = -.518, p < .001, evaluation of stimuli’s Arousal, r(98) = -.537, p < .001, Palatability, r(98) = -.301, p < .05, and Willingness to Try Non-traditional dishes, r(98) = -.514, p < .001.
4.2 Hypotheses Testing
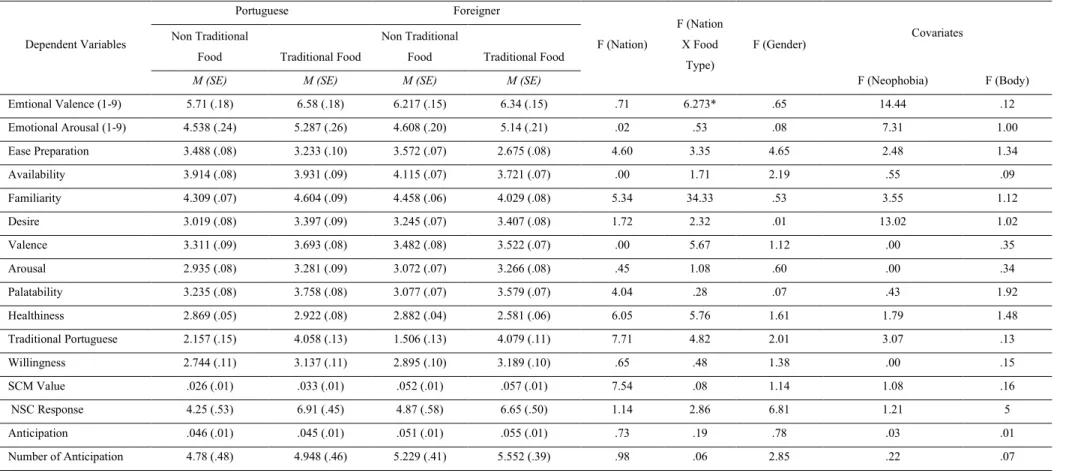
To test our main hypotheses, all the dependent variables were subjected to several Analyses of Covariance (ANCOVAs) in which food neophobia and body dissatisfaction were used as covariates. To analyze whether Portuguese perceptions of traditional food would differ from the foreigners’ perceptions (H1) a 2-Way ANCOVA with a 2 (Nationality: Portuguese, Foreigner) x 2 (Gender: Male, Female) factorial design was used. To examine all remaining hypotheses in which the two food type stimuli were used, several 3-Way ANCOVAs with a 2 (Nationality) x 2 (Food Type: Non Traditional Portuguese, Traditional Portuguese) x 2 (Gender) factorial design were used. Mean score are displayed in table 11.
General image. As expected in H1, Portuguese participants evaluated their own traditional food dishes with higher scores (M= 4.76) than foreigners (M = 4.28). The mean difference was significant, p = .001. We also found a main effect of Gender: males rated Portuguese traditional dishes with higher scores (M = 4.68) than females (M = 4.36), p < .05. In addition, the results yielded a significant effect for the covariate, Food Neophobia, F (1,94) = 11.213, p = .001.
Familiarity. Concerning the attribute familiarity, the traditional Portuguese dishes were more familiar to Portuguese participants (M = 4.60) than for the foreigners (M = 4.03), p < .001. Foreigners were more familiarized with the non-Portuguese dishes (M = 4.458) than with the traditional Portuguese dishes (M = 4.029), p < .001. Although they were statistically significant differences between these two groups, we can also see that foreigners’ familiarity with Portuguese traditional dishes was considerable high (M = 4.029), on a scale from 1 to 5.
Emotions of the Participant and Evaluation of stimuli Valence, Arousal and Desire. With regard to emotional valence (displeasure/pleasure measured by SAM), the results yielded a significant interaction between Nationality X Food Type, F(1,94) = 6.27, p = .014. As expected (H3a), for Portuguese participants, traditional Portuguese dishes (M = 6.58) produced higher pleasure than non-traditional Portuguese dishes (M = 5.71), p < .001. On the other hand, and contrary to what was expected (H2a), we didn’t find a significant mean difference in emotional Valence of the traditional Portuguese dishes between foreigners (M =