Assessment of the
Ecological Quality
of Sousa River
Carlos Daniel Moreira Pinheiro
Mestrado em Biologia e Gestão da Qualidade da Água
Departamento de Biologia 2017
Orientador
Maria da Natividade Ribeiro Vieira, Professor Associado, FCUP
Coorientador
O Presidente do Júri,
À Profª Dr.ª Natividade, pela oportunidade de me deixar trabalhar ao seu lado ao longo destes 3 anos, pela sua orientação, disponibilidade e, acima de tudo, pelas gargalhadas e boa disposição. Todas as histórias e momentos estarão sempre presentes na minha memória. Um grande obrigado e até já professora!
Ao Profº Dr. Francisco Barreto Caldas, pela disponibilidade e amabilidade que teve ao acolher-me e ao orientar-me no estudo das diatomáceas. Nunca irei esquecer o que me ensinou, nem as histórias partilhadas, ao longo deste curto período de tempo.
Ao Profº Dr. Nuno Formigo, pela disponibilidade e orientação na obtenção de material cartográfico para a minha dissertação e, principalmente, por me ter inspirado a seguir a área da Qualidade Biológica da Água e por todas as oportunidades que me ofereceu. Ao Profº Dr. Luís Oliva Teles, pela constante boa disposição e disponibilidade para me ajudar e orientar na componente estatística do meu trabalho.
Ao Profª Dr. Alexandre Valente, pela simpatia e disponibilidade ao facultar-me bibliografia sobre a bacia hidrográfica do Rio Sousa.
Às técnicas de laboratório, Teresa e Lily, pela constante boa disposição e ajuda no fornecimento de material essencial para a realização deste trabalho.
A todos os meus colegas do melhor laboratório da faculdade, o Laboratório 2.47! Ao Uirá, porque mais do que um colega de laboratório, ganhei um amigo para todos os momentos e para toda a vida.
Aos meus eternos amigos Abade, Cunha, Diogo, Gonçalo, Jota, Luís, Miguel, Osório, Pedro, Raul e Rosa quero agradecer-vos por tudo e por terem feito estes anos passarem a correr.
À minha namorada, Sara Pinto, por todos os momentos passados, dentro e fora da faculdade. És a minha inspiração e fazes-me querer ser melhor todos os dias e, por isso, amo-te e estarei sempre aqui para ti.
E, finalmente, aos meus pais…não há palavras para descrever o quanto vos amo e o quão grato estou pela oportunidade que me deram. Por vossa causa sou uma melhor pessoa. Espero que tenham tanto orgulho em mim, como eu de vocês. Abraços mãe e pai.
A água doce é, sem dúvida, um elemento essencial na sustentação da vida. É um ingrediente chave na saúde e no bem-estar dos seres humanos e dos ecossistemas, e para o desenvolvimento socioeconómico. Portanto, torna-se essencial gerenciar, de forma equilibrada, este recurso natural. A maioria dos problemas relacionados com a qualidade da água são causados pela agricultura intensiva, a produção industrial, mineração, escoamento urbano não tratado e águas residuais.
O rio Sousa pertence à bacia hidrográfica do rio Douro, localizada a norte de Portugal e estende-se por cerca de 95 km, com a sua nascente localizada em Felgueiras. Percorre Felgueiras, Lousada, Penafiel, Paredes e desagua no rio Douro em Gondomar. Assim, o principal objetivo do estudo foi avaliar o estado ecológico do rio Sousa através da análise de componentes biológicos (diatomáceas e macroinvertebrados), bem como parâmetros físico-químicos e hidromorfológicos. A pesquisa foi realizada durante 9 meses (novembro de 2016 a julho de 2017), em quatro estações de amostragem distintas. A amostragem inclui parâmetros físico-químicos e hidromorfológicos, bem como parâmetros biológicos. As amostras foram recolhidas a cada três meses, exceto no inverno.
Assim, através da avaliação da qualidade físico-química da água, reconheceu-se que existiam altos níveis de poluição orgânica, especialmente durante a primavera e o verão. A avaliação do habitat físico revelou pequenas transformações no canal do rio e a fraca habilidade da zona ripária funcionar como barreira dos impactos antropogénicos. Além disso, o estudo da comunidade de macroinvertebrados indicou que os locais se caraterizam entre ligeiramente contaminados e moderadamente contaminados, com os pontos de amostragem a apresentar uma qualidade entre “Boa” a “Medíocre”. A diversidade de macroinvertebrados bentônicos foi alta, com populações dominadas principalmente por taxa tolerantes à poluição. Em relação à comunidade de diatomáceas, estas indicaram que o Rio Sousa se encontrava com uma qualidade “Razoável” ao longo das estações do ano e dos pontos de amostragem, com populações dominadas principalmente por taxa tolerantes e ubíquos.
Os resultados obtidos foram importantes pois poderão servir de incentivo à elaboração de futuros trabalhos de pesquisa que possam oferecer soluções integradas de gestão dos recursos naturais.
Palavras-chave: Diatomáceas, Diretiva-Quadro da Água, Macroinvertebrados, Qualidade da Água, Rio Sousa
Freshwater is undeniably an essential life-sustaining element. It is a key ingredient in the health and well-being of humans and ecosystems, and for socio-economic development. Therefore, it becomes essential to manage, in a balanced way, this natural resource. Most problems related to water quality are caused by intensive agriculture, industrial production, mining, untreated urban runoff and wastewater.
The Sousa River belongs to the hydrographic basin of the Douro River, located in the north of Portugal, extending for approximately 95 km, and its spring is in Felgueiras. It crosses Felgueiras, Lousada, Penafiel, Paredes and flows into the Douro River in Gondomar. Thus, the study’s main goals were to evaluate the ecological status and quality of the Sousa River through the analysis of biological components (benthic diatoms and macroinvertebrates), as well as physicochemical and hydromorphological parameters. Research was performed during 9 months (November 2016 to July 2017), in four distinct sampling stations. The sampling included physicochemical and hydromorphological parameters as well as biological parameters. Samples were collected every three months, except in winter.
Hence, through the assessment of the physicochemical water quality, it was recognised that high levels of organic pollution existed, especially during spring and summer. The evaluation of the physical habitat revealed slight transformations in the channel of the river and the poor ability for the riparian zone to function as a barrier to the anthropogenic impacts. Moreover, the study of the benthic macroinvertebrate community indicated that the river is somewhere between slightly contaminated to moderately contaminated presenting, in some sampling sites, “Good” to “Poor” Quality. The benthic macroinvertebrate diversity was high with populations dominated mostly by tolerant taxa to organic pollution. Regarding, the diatom community, these indicated that the Sousa River presented a "Reasonable" quality throughout the seasons and sampling sites, with populations dominated mainly by tolerant and ubiquitous taxa.
The results obtained were important since they may serve as an incentive to the elaboration of future research works that can provide integrated management solutions of the natural resources.
1. Introduction ... 1
1.1 Water-Framework Directive (WFD) ... 2
1.2 Biological Monitoring of Water Quality ... 3
1.3 Diatoms as Bioindicators for Assessing Water Quality ... 5
1.4 Benthic Macroinvertebrates as Bioindicators for Assessing Water Quality ... 6
1.5 Objectives ... 8
2. Characterization of Sousa River’s Watershed1 ... 9
2.1 Geographical Characterization ... 9
2.2. Physiographic Characterization ... 10
2.3 Geological and Geomorphological Characterization ... 12
2.4 Socioeconomic Characterization ... 14
2.5 Soil Typology ... 16
2.6 Land Use ... 17
2.7 Conservation Values ... 19
2.8 Pollution in the Sousa River and its Tributaries ... 21
3. Materials & Methods ... 25
3.1 Sampling Sites ... 25
3.2 Sampling Frequency... 27
3.3 Habitat Characterization ... 27
3.4 Physicochemical Parameters of Water ... 28
3.5 Diatom Communities ... 30
3.5.1 Sampling method and processing ... 30
3.5.2 Sample Treatment ... 31
3.5.3 Identification of Diatoms ... 32
3.6 Community of Benthic Macroinvertebrates ... 32
3.6.1 Sampling Method ... 32
3.6.2 Sample Treatment ... 33
3.7.2 Benthic Diatoms Community ... 36
3.7.3 Benthic Macroinvertebrates Community ... 37
3.7.4 Habitat Quality ... 41
3.8. Data Analysis ... 42
3.8.1 Statistical analysis ... 42
4. Results & Discussion ... 43
4.1. Assessment of Habitat Quality ... 43
4.2. Hydromorphological and Physicochemical Parameters ... 49
4.2.1 Width (m) ... 49
4.2.2 Depth (m) ... 50
4.2.3 Mean Velocity (m s-1) ... 51
4.2.4 Mean Water Flow (m3.s-1)... 51
4.2.5 Water Temperature (ºC) ... 52
4.2.6 pH ... 53
4.2.7 Conductivity (µS.cm-1) ... 54
4.2.8 Dissolved Oxygen (O2) ... 56
4.2.9 Total Dissolved Solids (TDS) ... 57
4.2.10 Biochemical Oxygen Demand (BOD5) ... 58
4.2.11 Chemical Oxygen Demand (COD) ... 59
4.2.12 Phosphates ... 60
4.2.13 Nitrates ... 61
4.2.14 Nitrites ... 62
4.2.15 Ammonia Nitrogen ... 63
4.2.16 Total Suspended Solids ... 64
4.3 Biological Parameters ... 65
4.3.1. Benthic Diatoms Community ... 65
References ... 111 Appendix I ... 127 Appendix II ... 149
Table 1 Most common groups of benthic macroinvertebrates ... 7 Table 2 Brief description of the sampling sites under study. ... 25 Table 3 Physicochemical parameters analysed, determination methodology and units. ... 29 Table 4 List of diatom habitats as well as a brief description of each one of them (INAG, 2008) ... 30 Table 5 Most relevant habitat types to the community of benthic macroinvertebrates (inorganic and organic habitats) and an empirical scale for the identification of inorganic habitats (INAG, 2008c). ... 33 Table 6 Formulas used to calculate the diversity measures analysed. ... 36 Table 7 Descriptive statistics of the main environmental variables for A) Small Northern Rivers and B) Medium-Large Northern Rivers (2008a)... 39 Table 8 Quality classes defined according to the Iberian Biological Monitoring Working Party (IBMWP) index, with the colours to which the different quality classes are associated. ... 87 Table 9 Median reference values and boundaries for the "Small Northern Rivers" and "Medium-Large Northern Rivers" types of mainland Portugal. ... 87
Figure 1 Concept of “good” ecological status (Adapted from INAG [20]). ... 3
Figure 2 Area of the hydrographic basin of the Douro River [3]. ... 9
Figure 3 Watershed of the Sousa River. ... 10
Figure 4 Altitude classes of Sousa River’s watershed. ... 11
Figure 5 Longitudinal profile of Sousa River [9]. ... 12
Figure 6 Lithological aspects of Sousa River’s watershed. ... 13
Figure 7 Resident Population of Sousa River’s watershed area [26]. ... 15
Figure 8 Soil types of Sousa River’s watershed area. ... 16
Figure 9 Land use of Sousa River’s watershed area. ... 18
Figure 10 Location of the Natura 2000 Site "Valongo". ... 20
Figure 11 Point pollution sources within Sousa River's watershed [5]. ... 22
Figure 12 (A) Pollution in Cavalum River (…). ... 23
Figure 13 Localization of the sampling points in the watershed. ... 26
Figure 14 Spatial-temporal variation of the Visual Habitat Evaluation Index (…) ... 43
Figure 15 Representative map of Sousa River’s watershed, with the sampling (…) ... 44
Figure 16 Spatial-temporal variation of the indices: A) Riparian Forest Quality (…).... 45
Figure 17 Sousa River in Fraga. Sampling site LF: A) Left riverbank view (…) ... 46
Figure 18 Sousa River in Fraga. Sampling site LF: A) Left riverbank view (…) ... 47
Figure 19 Sousa River in Poços. Sampling site LP: A) Upstream bridge view (…) ... 47
Figure 20 Sousa River in Poços. Sampling site LP: A) Left riverbank view (…) ... 48
Figure 21 Sousa River in Senhora do Salto. Sampling Site SS: (…) ... 48
Figure 22 Sousa River in Foz do Sousa. Sampling site FS – Upstream view (…) ... 49
Figure 23 Spatial-temporal variation of the watercourses’ width (m) ... 50
Figure 24 Spatial-temporal variation of watercourses’ mean depth (m). ... 50
Figure 25 Spatial-temporal variation of the mean velocity of the current (m.s-1). ... 51
Figure 26 Spatial-temporal variation of mean instantaneous flow (m3.s-1). ... 52
Figure 27 Spatial-temporal variation of water temperature (ºC). ... 53
Figure 28 Spatial-temporal variation of pH. ... 54
Figure 29 Spatial-temporal variation of conductivity (µS.cm-1). ... 55
Figure 30 Spatial-temporal variation of dissolved O2 (mg.L-1). ... 56
Figure 31 Spatial-temporal variation of total dissolved solids (mg.L-1). ... 57
Figure 32 Spatial-temporal variation of biochemical oxygen demand (mg.L-1). ... 58
Figure 33 Spatial-temporal variation of chemical oxygen demand (mg.L-1). ... 59
Figure 34 Spatial-temporal variation of orthophosphates (mg.L-1). ... 60
Figure 37 Spatial-temporal variation of ammonium (mg.L-1). ... 64
Figure 38 Spatial-temporal variation of total suspended solids (mg.L-1). ... 65
Figure 39 Spatial-temporal variation of the percentage of the different genera (…). ... 66
Figure 40 Spatial-temporal variation of the values of Simpson’s Diversity Index (…) .. 69
Figure 41 Spatial and temporal variation of biological water quality, according (…).... 71
Figure 42 (A) Partial Least Squares (PLS) Bi-plot of all the sampling sites (…) ... 73
Figure 43 (A) Partial Least Squares (PLS) Bi-plot of all the sampling sites (…) ... 75
Figure 44 (A) Partial Least Squares (PLS) Bi-plot of all the sampling sites (…) ... 77
Figure 45 (A) Partial Least Squares (PLS) Bi-plot of all the sampling sites (…) ... 78
Figure 46 Spatial-temporal variation of the percentage of the main taxonomic (…) .... 79
Figure 47 Spatial-temporal variation of the percentage of Ephemeroptera (…) ... 81
Figure 48 Spatial-temporal variation A) of number of individuals (log10) (…)... 83
Figure 49 Spatial-temporal variation of the values of Simpson’s Diversity Index (…) .. 84
Figure 50 Representative map of Sousa River’s watershed, with sampling sites (…) . 86 Figure 51 Spatial and temporal variation of biological water quality, according (…).... 88
Figure 52 Spatial-temporal variation of the percentage of benthic macro(…) ... 90
Figure 53 Spatial-temporal variation of the percentage of benthic macro(…) ... 93
Figure 54 Spatial-temporal variation of the percentage of benthic macro(…) ... 95
Figure 55 (A) Partial Least Squares (PLS) Bi-plot of all the sampling sites (…) ... 98
Figure 56 (A) Partial Least Squares (PLS) Bi-plot of all the sampling sites (…) ... 99
Figure 57 (A) Partial Least Squares (PLS) Bi-plot of all the sampling sites (…) ... 101
Figure 58 (A) Partial Least Squares (PLS) Bi-plot of all the sampling sites (…) ... 102
Figure 59 (A) Partial Least Squares (PLS) Bi-plot of all the sampling sites (…) ... 104
Figure 60 (A) Partial Least Squares (PLS) Bi-plot of all the sampling sites (…) ... 105
Figure 61 (A) Partial Least Squares (PLS) Bi-plot of all the sampling sites (…) ... 107
APA – Agência Portuguesa do Ambiente (Portuguese Environmental Agency) BOD – Biochemical Oxygen Demand
CIZ – Central-Iberian Zone
COD – Chemical Oxygen Demand D1 – Simpson’s Diversity Index
DO – Dissolved Oxygen E – Simpson’s Evenness
EEA – European Environmental Agency
EPT – Ephemeroptera, Plecoptera and Trichoptera EQR – Ecological Quality Ratio
FFG – Functional Feeding Group
FPOM – Fine Particulate Organic Matter
GQC – Grau da Qualidade do Canal (Channel Quality Score) H’ – Shannon-Wiener’s Diversity Index
IBMWP – Iberian Biological Monitoring Working Party
ICNB – Instituto de Conservação da Natureza e da Biodiversidade (Nature Conservation and Biodiversity Institute)
INAG – Instituto Nacional da Água (National Water Institute)
IPMA – Instituto Português do Mar e da Atmosfera (Portuguese Institute of the Sea and the Atmosphere)
IPS – Indice de Polluosensibilité Spécifique (Specific Pollution Sensitivity Index)
IPtIN – Índice de Invertebrados do Norte de Portugal (Northern Portuguese Invertebrate
Index)
J’ – Pielou’s Evenness Myr – Million years
PDM – Plano Diretor Municipal (Municipal Master Plan) PET – Primary Effluent Treatment
QBR – Qualitat del Bosc de Ribera (Riparian Forest Quality Index) REN – Reserva Ecológica Nacional (National Ecological Reserve) SU – Systematic Units
TDS – Total Dissolved Solids Temp – Water Temperature
VHA – Visual Habitat Evaluation Index WFD – Water Framework Directive WWTP – Wastewater Treatment Plant
1. Introduction
Freshwater is undeniably an essential life-sustaining element. It is a key ingredient in the health and well-being of humans and ecosystems, and for socio-economic development [165]. Therefore, it becomes essential to manage, in a balanced way, this natural resource [134]. Meanwhile, water quality is becoming a global concern of increasing significance, as risks of degradation translate directly into social economic impacts. Although there have been some regional successes in improving water quality, there are no data suggesting that there has been an overall improvement in water quality on a global scale [165].
Most problems related to water quality are caused by intensive agriculture, industrial production, mining, untreated urban runoff and wastewater. The disruption of ecosystems is undermining the environment’s capacity to provide basic water-related services (e.g. purification, storage). Degraded ecosystems can no longer regulate and restore themselves; they lose their resilience, further accelerating the decline in water quality and availability. Global environmental degradation, including climate change, has reached a critical level with major ecosystems approaching thresholds that could trigger their massive collapse [162, 167], with an increase in and spread of water scarcity and stress predicted to affect about half the river basins in the European Union by 2030 [52, 166].
Moreover, the expansion of industrial agriculture has led to increases in fertilizer applications, interfering with phosphorus and nitrogen cycles well beyond safe thresholds. The excessive loads of nitrogen and phosphate, the most common chemical contaminants in the world’s freshwater resources [164], contribute to the eutrophication of freshwater and coastal marine ecosystems, creating ‘dead zones’ and erosion of natural habitats [163]. These changes have been reflected in a general increase in the pressure of water resources and their consequent degradation [49], with rivers being more intensively used and altered by man than any other type of natural system [120]. Thus, ensuring the ecological quality of water resources by promoting the conservation of key habitats is an essential vector of a sustainable strategy. In this perspective, a proactive management policy should ensure the compatibility of uses and intervene, in an appropriate way, in the appropriate vectors to guarantee the quality of the water.
1.1 Water-Framework Directive (WFD)
The Water-Framework Directive (Directive 2000/60/EC of the European Parliament and of the Council of 23rd October 2000) became the main instrument of the European Union
Policy regarding water, establishing a framework for community action to protect internal surface waters, transitional waters, coastal waters, and groundwater [7]. Its introduction was meant to introduce a new era for European water management, focused on understanding and integrating all aspects of the water environment in order to be effective and sustainable [160].
The environmental objectives of the WFD oblige Member States to implement the necessary measures to prevent the deterioration of the status of all surface water bodies and to protect, improve and restore the state of ecosystems in order to achieve "good" ecological and chemical status in 2015 [74], as long as no extension or exception was invoked. Member States benefiting from an extension beyond 2015 are required to comply with all environmental objectives of the WFD by the end of the second and third management cycles, which run from 2015 to 2021 and from 2021 to 2027, respectively [53].
This way, the anthropogenic concept of water as a resource is abandoned in favour of an ecological vision, focused on the water quality, where water is considered the support of ecosystems [135]. According to the Appendix V of the WFD, "ecological status" is defined on the basis of several parameters aggregated into three groups of elements: biological elements (phytoplankton communities, macrophytes and phytobenthos, benthic macroinvertebrates and fish fauna), hydromorphological elements (hydrological regime, morphological conditions and river continuity) and physicochemical elements (general parameters and specific pollutants), both of which support the biological elements [51], since they comprehend the abiotic factors that influence biological communities.
INAG [78] describes "ecological status" as the "structural and functional quality of aquatic ecosystems associated with surface waters, being expressed based on the deviation from the conditions of a similar body of water type, under conditions of reference". The reference conditions correspond to communities, biological traits and/or ecological functions present in a minimally disturbed group of sites [58].
The WFD distinguishes five levels of “ecological status”, from “Excellent” to “Bad”, for surface waters quality (Figure 1). It further states that the value of the boundaries between the "Excellent" state and the "Good" state, and between this and the "Reasonable" state, will be established through the Intercalibration exercise, ensuring
that the boundaries between classes of classification systems of biological elements are consistent with the normative definitions of the WFD and that they are comparable between Member States [78]. Of the biological quality elements only benthic macroinvertebrates and phytobenthos have been submitted to the intercalibration exercise.
Figure 1 Concept of “good” ecological status (Adapted from INAG [74]).
In "Good" ecological status, the characteristics of communities of aquatic organisms only deviate slightly from those normally associated with the reference conditions, and the values of the physical-chemical parameters and the hydromorphological characteristics are compatible with the values specified for the biotic communities [74]. For water bodies yet to be classified as "Good", the necessary measures must be defined to achieve this status, which will have economic and social repercussions; Hence, the importance of a coherent and robust classification system [78].
According to Cortes [34], European aquatic ecosystems are in a high state of degradation and, to achieve the objectives proposed by the WFD, the contiguous intervention of the responsible entities and of the populations themselves is necessary, if we want to reverse this tendency of aquatic ecosystems’ destruction.
1.2 Biological Monitoring of Water Quality
The Portuguese Water Policy [14] describes monitoring as “the process of collecting and
processing information on the various components of the hydrological cycle and quality elements for the classification of water status, in a systematic way, to monitor the behaviour of the system”.
Member-States were urged to establish monitoring programmes by December 2006. The main task was to adapt existing monitoring systems to meet the needs and objectives of the WFD. Thus, the monitoring of surface waters considers the chemical composition, several fundamental biological elements and the hydrological and morphological characteristics of the water bodies, in order to allow an exhaustive analysis of the water health in Europe. Monitoring is, therefore, the main instrument used by Member-States to classify the status of each body of water.
Originally, water quality assessment was based mostly on the analysis of physicochemical parameters [9], and the whole environmental recovery strategy was based on them [36]. However, physicochemical monitoring is only capable of providing a momentary image of water quality, and is also ineffective in detecting changes in habitat and microhabitat diversity, and insufficient in determining the consequences of altered quality of water over biological communities [66]. Hence, the evaluation of the biological quality of water began to be developed because it was observed that the information obtained, through physicochemical analysis alone, was not enough to fully describe the quality level of water bodies [15].
Living beings are more sensitive to changes in the environment than measuring devices, and may react strongly to small concentrations of contaminants [158]. Moreover, aquatic biota can be affected by pollution, even when distant from source areas, allowing the identification of areas subject to diffuse contamination and/or contamination coming from unidentified sources [109], unlike chemical measurements that, if made far from the contamination source, they are not able to detect subtle disturbances in the ecosystem [22]. Biological communities, thus, reflect the ecological state of the ecosystems (i.e. their physicochemical, biological and hydromorphological condition) as they integrate the effects of different stressors, often complex and independent, providing a measure of their cumulative impact [17].
This way, an integrated view of all interactions occurring in the watercourse, the riparian corridor and the drainage basin is obtained. In general terms, it can be said that the aquatic biota changes its structure and functioning due to the modification of the environmental conditions of its natural habitats; consequently, theoretically, the entire biota is the ideal entity to evaluate and characterize the environmental conditions to which it was subjected. Plankton, fish and benthic macroinvertebrates have been the groups most used as bioindicators in determining the biological quality of water [144]. It is considered that an aquatic environment presents a good biological quality when it
meets natural characteristics allowing, within its environment, biological communities to develop [9].
Although biological methods are more advantageous than physicochemical methods, the former do not replace the latter because both types of analysis are convergent and complementary [83]. Biological methods detect and evaluate the degree of ecological imbalance that has occurred and physicochemical methods are essential to identify and quantify the concentration of the pollutants responsible for this situation [158]. Due to the wide diversity of environmental impacts on aquatic ecosystems, environmental control should involve an integrated approach – through the physical, chemical and biological monitoring of water, as well as the assessment of the structural quality of the habitat, since it supports and provides ecological organization – providing a complete spectrum of information for proper management of water resources [109, 122].
1.3 Diatoms as Bioindicators for Assessing Water Quality
Diatoms (Bacillariophyceae Dangeard, 1933) are eukaryotic algae, traditionally classified as one of two biological orders, the Centrales and the Pennales. Diagnostic features cited supporting the two classes include: (1) valve formation developing radially around a “point” in Centrales, contrasted by deposition originating along a “plane” in Pennales and (2) oogamous sex with relatively small motile flagella bearing sperm and a large non--motile egg in the Centrales, contrasted by isogamous sex with ameboid gametes in the Pennales. However, modern systematics strives to achieve natural, or monophyletic, groups when designating categories above the species level [86].
Round et al. [142], presented a taxonomic system for genera and higher-level groups. This work treated the diatoms as a division with three classes consisting of the radially symmetric taxa, the araphid pennate taxa, and raphid pennate taxa, suggesting that evolution was along this line and that the centric diatoms preceded pennates. This text remains the most recent comprehensive coverage for diatoms, but the classification system was not developed in an evolutionary context and many of the taxonomic designations are being reconsidered and changed. Although a comprehensive diatom phylogeny is desired, it is not a requirement for utilizing diatom species in rivers’ ecological assessment, while, reliable species identification is, undoubtedly, essential. Diatoms are considered valuable indicators of environmental conditions in rivers and streams, since they respond directly and sensitively to many physical, chemical, and biological changes in river and stream ecosystems. Moreover, they constitute a fundamental link, in temperate regions, between primary (autotrophic) and secondary (heterotrophic) production and form a vital component of aquatic ecosystems [76].
Today, diatoms are being extensively used to assess ecological conditions in streams and rivers around the world [30, 85, 87, 89, 98, 156] due to their specific features, namely: (1) presence in abundance from the spring to the mouth of the river; (2) ubiquitous distribution allowing comparisons between different habitats; (3) show a clear relationship with water quality; (4) do not have a phased life cycle which would absent them from aquatic systems; (5) develop in specific, well-defined and easily sampled habitats; (6) present a great taxonomic diversity; (7) sampling is relatively simple and inexpensive; (8) are easily grown in the laboratory; (9) respond quickly and predictably to environmental disturbances through changes in their composition and abundance, since their metabolism is sensitive to the variation of environmental and natural disturbances; (10) constitute one of the main groups at the base of the food chain of all aquatic ecosystems [127].
Due to the mentioned characteristics, biotic integrity indexes have been developed with the objective of identifying the pressures to which the aquatic systems are subjected, namely, eutrophication and increase of organic matter, salinization and acidification. Benthic diatom communities respond to increased nutrients (mainly nitrogen and phosphorus) in water by altering their composition which, in most cases, leads to reduced diversity and increased biomass; which is why, in eutrophic systems the substrates are covered with a brownish green film constituted by unicellular algae. The increase of organic matter in the system may cause a functional modification of the algae, from autotrophic to heterotrophic. Also, the increase of salinity in the system may lead to a change in the community, which will only be made up of species that are resistant to the new conditions [76].
It should be noted, however, that benthic diatoms are less sensitive to hydromorphological pressures (e.g. alteration of the hydrological regime), and, in such situations it is advisable to resort to another biological element (Macroinvertebrates or macrophytes) to detect the pressures in question [76].
1.4 Benthic Macroinvertebrates as Bioindicators for Assessing Water
Quality
The terms “benthic” and “macroinvertebrate” do not respond to a taxonomical concept but rather to an artificial delimitation of groups of invertebrate animals [10]. Rosenberg & Resh [144], defined benthic organisms as those who inhabit the bottom of aquatic ecosystems during at least part of their life cycle, associated to the most diverse types of substrates, both organic and inorganic. Regarding macroinvertebrates, generally they are considered as those organisms’ large enough to be able to be caught with a mesh
size of 250 µm, and thus observed at first sight, although, in fact, most of them are larger than 1 mm in size [10].
Despite the general definition given above, some animal groups that could fit in it are never considered as macroinvertebrates (i.e. Protozoa and Tardigrada), while other groups (i.e. Nematoda, Nematomorpha, Cladocera, Copepoda, etc.) are not even measured by methodologies based on macroinvertebrates. Most of the macroinvertebrate groups (Table 1) are arthropods, and the insects represent the great majority. Moreover, the substrate may have a great influence on the composition of the benthic macroinvertebrate community, since it is the physical medium on which the aquatic invertebrates move, rest, find shelter, build houses, deposit eggs and serve as food if the substrate is organic [131].
Table I Most common groups of benthic macroinvertebrates [10].
Arthropods
Insecta Crustacea
Coleoptera Megaloptera Amphipoda
Diptera Odonata Decapoda
Ephemeroptera Plecoptera Isopoda
Heteroptera Trichoptera Non-Arthropods Hirudinea Mollusca Oligochaeta Turbellaria
Their use as bioindicators in water quality studies is due to several biological and ecological characteristics that these organisms possess: (1) are differentially sensitive to pollutants of various types and react to them quickly [31], and are capable of a graded response [128]; (2) are present in most aquatic habitats) especially flowing water systems [132], and are abundant and relatively easy and inexpensive to collect [126]; (3) their taxonomy is well established, although admittedly difficult at the species level for some groups [132]; (4) are relatively sedentary, and are therefore representative of local conditions [31]; (5) they have lifespans long enough to provide a record of environmental quality [128] and (6) macroinvertebrate communities are very heterogeneous, with numerous phyla and trophic levels represented. The probability that at least some of these organisms will react to a particular change in environmental conditions is, therefore, high [63].
According to Kikuchi & Uieda [95], the factors of greater ecological significance that exhibit progressive change in macroinvertebrates’ values along rivers are: dissolved oxygen concentration, food, stream velocity, substrate type and temperature. In addition, high fauna richness and diversity have been observed in areas of aquatic environments with presence of aquatic macrophytes. Often, this type of vegetation serves as a substrate for benthic macroinvertebrates, providing protection against predators, serving as a direct (plant tissue) and/or indirect (substrate for growth of the periphytic community) source of food and serving as spawning sites for various semi-aquatic and aquatic insects [114].
Since macroinvertebrates interact locally with the environment, their distribution, occurrence and abundance are highly dependent on the predominant environmental characteristics and thus a reflection of disturbances at the ecosystem level. As in most natural aquatic ecosystems there is a rich diversity of macroinvertebrates that provide a range of structural and functional measures or metrics (e.g., tolerance to organic
pollution, presence of certain trophic guilds, habitat preferences,
composition/richness/equitability measures), used to evaluate the ecological status of the rivers [59].
While assessing the composition and abundance of the benthic macroinvertebrate community provides an image of water quality, it is important to note that, according to the holistic perspective implicit in the Water Framework Directive, community sampling of benthic macroinvertebrates should be complemented by other quality elements, allowing a more accurate evaluation of the ecological state of a river [119].
1.5 Objectives
The present work has the following objectives:
1.
Assess the ecological quality of the Sousa river, based on physical, chemical, hydromorphological and biological (benthic macroinvertebrates and diatoms) parameters;2.
Analyse the spatial and temporal dynamics of the main abiotic factors and the diatom and benthic macroinvertebrate communities in places where there is anthropogenic pressure and where it is supposedly absent;3.
Evaluate a possible correlation between the physicochemical parameters of water and the structure of the macroinvertebrate and diatom communities;1 In this dissertation the term "watershed" will be used to define a smaller area of land that drains to a smaller stream.
Hence, there are many smaller watersheds within a river basin.
2. Characterization of Sousa River’s Watershed
1The landscape attributes related to physical characteristics of the habitat – namely land use, geology, relief and hydrography – seem to show great influence on macroinvertebrates [27, 38] and diatoms [45, 153, 157]. Therefore, water management must address aquatic systems in an integrated manner within their respective river basins, seeking to develop their use, protection and, if necessary, recovery [59].
All the non-cited maps were done by the author of this dissertation, using ArcMap 10.4.1., the primary application used in ArcGIS [50].
2.1 Geographical Characterization
The study area chosen for this dissertation was the Sousa River’s watershed, located in the Northwest region of Portugal, which belongs to Douro River’s hydrographic basin (Figure 2).
As can be seen from Figure 3, the watershed of Sousa River covers the areas belonging to the municipalities of Paredes (28%), Penafiel (18%), Lousada (15%), Felgueiras (13%), Paços de Ferreira (12%), Valongo (9%) and Gondomar (6%), located in the Porto district.
It is limited to the north by the hydrographic basin of the Ave River, to the east by the watershed of the Tâmega River, to the South by the Douro River, to the Southwest, by the watersheds of the Torto and Tinto Rivers, and, to the West, by the hydrographic basin of the Leça River.
Figure 3Watershed of the Sousa River.
2.2. Physiographic Characterization
Data on the geometric and relief characteristics and drainage system are essential for the characterization of a basin [112]. The watershed of the Sousa River has an area of approximately 557 km2 and has a perimeter of 180 km, and can be considered an
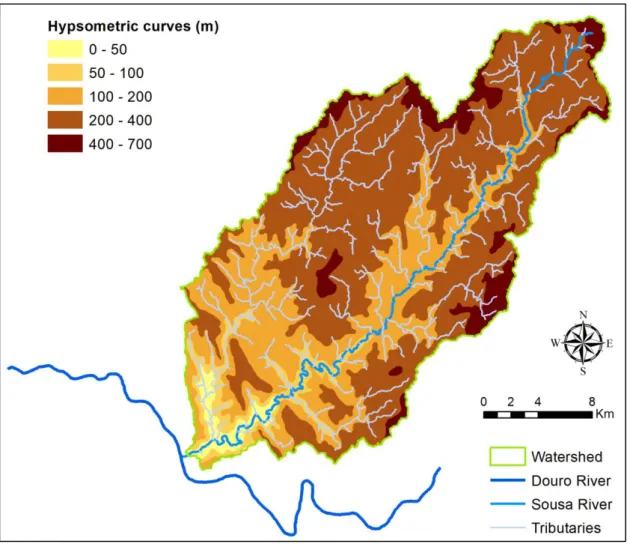
Figure 4 shows the existing altitudes classes in the Sousa River’s watershed.
Figure 4 Altitude classes of Sousa River’s watershed.
The main water course studied corresponds to the Sousa River, which is a tributary of the Douro River and has, as main tributaries, on the left bank, the Cavalum River and, on the right bank, the rivers Mezio and Ferreira, the latter of greater significance with its confluence in Foz do Sousa (Gondomar). The Sousa River’s spring is in Friande, to the east of Felgueiras, at about 400 meters of altitude, passing by the municipalities of Lousada, Penafiel, Paredes and Gondomar, and flowing into the right bank of the river Douro [13]; travels through, approximately, 95 km [5], with an extension of about 14.5 km in Felgueiras, 17.0 km in Lousada, 26.5 km in Penafiel, 23.8 km in Paredes and 13.7 km in Gondomar [50 – values obtained through ArcMap’s “Field Geometry” tool]. The Sousa River is characterized by having an open valley, in the area upstream of its watershed, which covers a large part of the municipality of Felgueiras, since the outskirts of the city. It continues to be slightly excavated in both the municipality of Lousada and in the northern part of the municipality of Penafiel and in the region of the city of Paredes, with a flow direction of NNE-SSW [112]. Downstream, after receiving the Cavalum River on the left bank, it crosses the southern area of the municipality of Paredes in an enclose
and heavily meandering valley, with a flow direction of NE-SW, merging with the Douro River in Foz do Sousa, already in the municipality of Gondomar [13].
Figure 5 Longitudinal profile of Sousa River [24].
According to Cardoso [24], we can verify that the Sousa River’s bed has a fairly smooth slope. However, it is possible to consider the existence of 4 distinct zones taking into account its slope (Figure 5): (1) the most upstream area, from the spring to near the confluence with Ribeira da Longra (195 m), with a length of about 9 km and the highest slope of the river bed being observed (≈ 2%); (2) the mid sector, with about 41.5 km, has a smoother slope (0.3%); (3) and then rises slightly (0.7%) from the confluence with Ribeira de Bustelo (70 m) to the confluence with the Ferreira River (10 m), traveling approximately 13.5 km; (4) the last stretch with about 2 km, to the confluence with the river Douro (8 m), has the smoothest slope (0.03%).
2.3 Geological and Geomorphological Characterization
In order to understand the functioning of a watercourse it is important to know the surrounding terrestrial environment, since there is interdependence between both, namely the geological nature of the river basin [100].
The study area of this work belongs to the Central-Iberian Zone (CIZ): one of the great geological units in which the Ancient Massif (Hesperian, Iberian) is divided. The Central-Iberian Zone is characterized by a great extent of the granitoid rocks, followed by schists affected by multiple degrees of metamorphism which, in general terms, can be considered as materials with poor hydrogeological capacity, i.e., poor in groundwater resources. However, despite the scarcity of groundwater resources, they play an important role both in supplying local populations and agriculture [11].
Through a general analysis of the Lithological Chart, made available by the “Portuguese Environmental Agency” (APA – Figure 6), it is possible to verify that the watershed of Sousa River is in an area where granite and schists massifs dominate, which means the presence of soils with low infiltration rates, and, consequently, high superficial runoff.
Figure 6 Lithological aspects of Sousa River’s watershed.
Relatively to the existing lithologies in the watershed of the Sousa River, three types can be distinguished: alluviums and terraces, metasedimentary rocks and granitoids. The alluviums are abundant in both the Sousa and Ferreira rivers, being their extension greater where these rivers are embedded in granitic rocks.
In the municipality of Felgueiras, the Sousa River’s spring is embedded in metasedimentary formations (440-430 Myr), consisting mainly of schists and black shales. The oldest granitoids also occur in the area around Felgueiras and correspond to a biotitic, porphyroid granodiorite, related to the beginning of the third phase of deformation of the Variscan (Hercynian) Orogeny [13].
In the municipalities of Penafiel and Lousada, the Sousa River is embedded in granite rocks, of different types and ages, with dates between 310 and 290 million years. In the
municipality of Lousada occurs a biotitic, porphyroid, coarse grain granite while, in Penafiel, emerges a monzonite, porphyroid granite of two micas of medium grain [13]. In the municipality of Paredes, the Sousa River is essentially installed in metasediments of diverse ages (about 540-400 Myr), whose sediments were deposited in a marine basin. These are folded in a large tectonic structure, called "Anticlinal de Valongo", which extends from Póvoa do Varzim to near Castro Daire. The metasedimentary sequence is composed of conglomerates, greywackes, quartzites and schists. In the Ordovician shale, there is the valuable heritage of the palaeobiodiversity of the seas that covered the region from 470 to 460 Myr, consisting of trilobites, graptolites, brachiopods, gastropods, cephalopods, among others. It is also possible to find a terrace of the Pliocene epoch (5.3-1.8 Myr) in Paredes [13].
In the area of the Paleozoic Park of Valongo, and in its closest surroundings, the morphology of the terrain is strongly conditioned by the presence of quartzitic rocks that, due to their resistance to erosion, form elongated ridges along a NW-SE direction. These ridges represent vigorous reliefs with variable altitudes (300-500 m), and are commonly designated by "Serras de Valongo". The “Serra de Santa Justa”, in the western branch, and “Serra de Pias”, in the eastern branch, are the ones that stand out the most [13]. From Figure 6, it is possible to see that, between these two branches and over the lands characterized by the Schist--Greywacke Complex, exposed due to the erosion of the axial zone of the “Anticlinal de Valongo”, part of the Ferreira River valley is installed. Parallel to these main ridges, smaller ridges occur, related to the presence of quartzites of less thickness than the previous ones, or with the presence of conglomerates [13]. Regarding the granitic rocks, they occupy the greater part of the Sousa River watershed, with more than 61% [50 – values obtained through the ArcMap’s “Field Geometry” tool]. In the Sousa’s valley, there are two types of valleys: (1) open valleys associated with granites and (2) valleys embedded in Paleozoic formations, of major relevance in areas where water lines cross the rather thick quartzite sequences of the Ordovician base, as it happens in Senhora do Salto (Paredes). Here, we observe the "Marmitas de Gigante", originated by the erosion of the river bed caused by circulatory movements of blocks and/or pebbles transported by the river, excavated in Ordovician quartzites [13].
2.4 Socioeconomic Characterization
Demographic and industrial growth has been increasing in the region of the Sousa River’s watershed, thus increasing the number of environmental pressures on the river. According to the 2011 Census [79], in the watershed area of the Sousa river, there are about 583 000 inhabitants. The number of residents in the municipalities of Felgueiras,
Paços de Ferreira, Valongo, Lousada, Paredes, Penafiel and Gondomar is 58 065, 56 340, 93 858, 47 387, 86 854, 72 265 and 168 027, respectively, being the number total population in Continental Portugal of 10 562 178 individuals. [Figure 7, 79]. Between 2001 and 2011 there was a continuous growth of the population in this region between 7.1% and 19.99% [79].
Figure 7 Resident Population of Sousa River’s watershed area [79].
In the watershed of the Sousa River there is a great predominance of industrial activity. The presence of the processing industry (valorisation of metal waste, manufacture of wood furniture and other purposes, bleaching and dyeing of clothing materials and manufacture of other preparations and pharmaceutical articles) and food (wine and cattle slaughtering for meat production) [6].
As far as agriculture in the region is concerned, it is characterized by small and medium-sized agricultural areas with low productivity. The agricultural activity refers to the production of annual crops, under irrigation, and the exploitation of permanent crops such as vineyards [72].
In the area covered by the Sousa River’s watershed there is a significant socioeconomic development, so it is impossible to separate it from the increased pressure on land use change caused by urban and industrial expansion. There are consequences of these changes, which usually result in deterioration of the environmental quality of the rivers and surrounding areas, when preservation conditions are not kept at acceptable levels or when this pressure exceeds the limits of sustainability [112].
RESIDENT POPULATION
2.5 Soil Typology
The soils of the Entre-Douro and Minho region, where the Sousa River’s watershed is located, resulted from the disintegration of different rocks (see last sub-chapter) in the area due to weathering processes caused by, not only, several environmental factors, such as, climate, relief and vegetation, but also due to anthropogenic actions [111].
Figure 8Soil types of Sousa River’s watershed area.
It is the characteristics of these environmental factors that condition the appearance of specific processes that lead to the formation of different types of soils [111]. Based on the information available in “Environmental Atlas” [147] on soil typology (Figure 8), we can verify that the pedological unit with total expression in the watershed of the Sousa River are the Humic Cambisols. These are composed of eruptive rocks and schists associated with Luvisols, with a strong Atlantic influence [3].
According to APA [3], cambisols possess low amounts of clay and organic matter, thus, being considered soils with an average fertility [3]. Even so, IUSS [81] stated that these soils do make good agricultural land and are intensively used, mainly, due to their favourable aggregate structure and high content of weatherable minerals. Moreover,
cambisols with high base saturation in the temperate zone are among the most productive soils on earth. They are used intensively to produce food and oil crops on irrigated alluvial plains, and are planted with a variety of annual and perennial crops or used as grazing land in undulating or hilly terrains [81].
Cambisols are characterized by a thickness between 50 and 100 cm, having a low risk of erosion in natural conditions [3, 73]. However, poor land management decisions cause damage to the soil and results in water runoffs across the landscape instead of an adequate infiltration [80], changing the water quality. Cambisols are categorized has having low to moderate permeability [3]. This characteristic can influence the leaching of contaminants, such as water-soluble pesticides or fertilizers, into aquifers and water channels, affecting, once again, the water quality.
2.6 Land Use
Land use is the occupation of the territory for a given area, representing the spatial distribution of activities, namely, anthropogenic ones.
The land use analysis intends to characterize the main present uses of the soil of the watershed under study. It is important to know the type of human activities practiced in the area circumscribed by the watershed because it conditions the use of the terrestrial area that circumscribes it and, therefore, the types of substances with polluting potential that are introduced in the waterways [100].
The soil occupation analysis included the current uses of the soil, contemplating the dominant uses in large polygons (patches) [73]. The importance of studying land use in a river basin is that all changes in its use (occurring within the boundary of a given river basin) have an impact on the level of aquatic ecosystems, since the water balance of the river basin is heavily dependent on land occupation.
The land use analysis was based in "Carta de Ocupação e Uso do Solo” (COS), which considers five different levels of class aggregation, in a total of 225 thematic classes. The most aggregate level of LCC, level 1, is divided into five classes, with the most disaggregated level having 10 classes. The LLC was developed at a scale of 1:100000 with a minimum map area of 1 ha.
Figure 9 shows the land use in the watershed of the Sousa River according to COS2010 [48].
Figure 9Land use of Sousa River’s watershed area.
According to Figure 9, we can say that “Forests and natural and semi-natural environments” and “Agricultural and agroforestry areas” occupy most of the area of Sousa River’s watershed, in fact, the two together make up approximately 80% of the total area [50 – values obtained through the ArcMap’s “Field Geometry” tool].
Concerning land use, in the region of the Sousa River’s watershed, monocultures of eucalyptus (15.85%), temporary irrigated crops (12.31%) and discontinuous urban tissue (10.10%) predominate while native forests, constituted by Quercus sp., only correspond to 0.044%, almost same area cover as invasive forests (0.043%) [48, 50 – values obtained through the ArcMap’s “Field Geometry” tool].
Due to the forest artificialization, owed to the monoculture of eucalyptus, several forest fires have been associated with these monocultures. In fact, 77% of all the burned area, within the Sousa River’s watershed, occurred in eucalyptus forests, while the other 33% occurred in non-forest areas and Pinus pinaster and other hardwood forest areas [50 – values obtained through the ArcMap’s “Field Geometry” tool].
The presence of eucalyptus’ monocultures can dry and impoverish soils, leading to a strong reduction in the flow of watercourses and, consequently, biodiversity. Furthermore, some of the paths, built when planting eucalyptus trees, change the normal course of water and the vegetation of riparian zones [29].
Riparian zones represent transition zones, between terrestrial and aquatic ecosystems, of extreme importance for biodiversity and ecosystem services [150]. There are studies that demonstrate that the current changes in land use from native to exotic riparian vegetation can affect fish [33, 57, 60] and macroinvertebrate communities [2, 33, 60]. Autochthonous vegetation is only found in small patches throughout the watershed, usually close to the water lines where riparian vegetation dominates, and marginally in small agricultural fields where some Quercus sp. still appears. Heterogeneous agricultural areas, including annual and permanent crops, mixed systems with important natural spaces, agroforestry territories and complex cultural and partition systems, also cover a very significant area [73].
Artificialized territories occupy, in an unequal way, approximately 21% in the Sousa River’s watershed. Here, discontinuous urban fabric, industries, roads and viaducts have greater expression leading to a vast impermeabilization of the territory and, consequently, to an increase in the leaching of different contaminants.
According to ICNB [71], the main land uses of the Natura 2000 site "Valongo" corresponds to forest (85.94%), natural grasslands and pastures (6.92%), arable farming areas (3.42%), urban and industrial areas and areas without vegetation cover (about 2.23%) and arboreal-shrub agricultural areas (1.50%).
2.7 Conservation Values
Portugal has been, since 1983, regulated by the “National Ecological Reserve” (REN), being currently present in all “Municipal Master Plans” (PDM) of the country. This regulation has contributed to protect natural resources, especially water and soil, to safeguard the processes that are essential for good land management and for the conservation of nature and biodiversity. Hence, REN is designated as a biophysical structure that integrates all the areas that, because of their ecological value and sensitivity or their exposure and susceptibility to natural hazards, are subject to special protection (Article 2, nº 1 of D.L. nº 166/2008). Alongside this legislation, Portugal is regulated by the Natura 2000 network, since the beginning of the 21st century.
The Natura 2000 network is an ecological network for the European Union's Community area resulting from the implementation of Council Directive 79/409/EEC of 2nd April 1979
(Birds Directive) and Directive 92/4 /EEC (Habitats Directive), thus, constituting the main instrument for the conservation of nature in the European Union. This community project aims to promote the maintenance of biodiversity while considering the scientific, economic, social, cultural and regional requirements of each region [29].
Figure 10 Location of the Natura 2000 Site "Valongo".
The geographical positioning that Portugal presents, encompassing 3 Biogeographic Regions, is very elucidative of the high biological diversity that exists in the country. The Natura 2000 site "Valongo" (Atlantic Biogeographic Region, Figure 10), identified by the code PTCON0024 in the National List of Sites, is located in the district of Porto, about 12 km NE from the city of Porto [29]. Its 2,555 hectares of total area are expanded throughout the municipalities of Paredes, Valongo and Gondomar, with the percentage of the Site in the municipalities being 42%, 32% and 26%, respectively [71].
The Natura 2000 "Valongo" Site, recognized as a Site of Community Importance, is characterized by the presence of a complex system of “fojos”, mines, small springs and water lines that create exceptional conditions for the herpetofauna associated with humid environments. It is the only place of occurrence of the pteridophytes Culcita macrocarpa
and Trichomanes speciosum in Portugal, as well as the only place in the country where the species Dicksonia antarctica is naturalized. Also, regarding flora species, the site represents the only known site of the occurrence of Lycopodiella cernua throughout Continental Europe. It is also important because there are some relatively rare carnivorous species and an amphibian species, the Lusitanian Salamander (Chioglossa
lusitanica) endemic to the Iberian Peninsula [73].
Despite its status, this area is threatened, with emphasis on the pollution of the river Ferreira (tributary of the Sousa River), intensive forest activity and artificialization of forest stands, invasion of exotic species such as acacia (Acacia sp.), forest fires (between 1991 and 2003 burned 46% of the Natura 2000 Site "Valongo"), human and urban disturbances (ungoverned deposition of debris, looting of some rare species) and the degradation of the system of mines and “fojos” [71]. In order to reverse the current situation, management measures were planned, mainly, aiming at the recovery and conservation of native forest including riparian forests, as well as the monitoring, maintenance or improvement of the rivers’ water quality. To sum, in these areas of community importance for the conservation of certain habitats and species, human activities should be compatible with the preservation of these values, aiming at a sustainable management from an ecological, economic and social point of view [150].
2.8 Pollution in the Sousa River and its Tributaries
Water pollution poses a threat to the environment, human health and the maintenance of ecosystems. It is therefore important to continue to develop measures to mitigate this problem. There are many causes for this type of degradation, all of which are interrelated, including the accelerated development of economic activities and the high population growth, which, if not accompanied by the construction of basic sanitation infrastructure, cannot ensure a future sustainable development.
The pollution problems affecting the water quality of the Sousa River and its tributaries are mainly related to untreated discharges of domestic and industrial effluents (point sources), as well as pollution from small livestock units, the intensification of the use of pesticides and fertilizers in agriculture (diffuse sources), among others. According to the European Environmental Agency (EEA), point sources are stationary locations or fixed facilities from which pollutants (oxygen consuming substances, nutrients and hazardous substances) are discharged, thus, easier to control and manage [54]. In general, discharges of pollutants from point sources have decreased significantly over the past 30 years. The changes are mainly due to improved purification of urban wastewater and reduced industrial discharges [54]. On the other hand, diffuse sources’ management is
complex and requires the careful analysis and understanding of various natural and anthropogenic processes [55]. Moreover, rivers are victims of physical modifications in their drainage areas, beds and margins with an impact on their morphological conditions and hydrological regimes, i.e. hydromorphological pressures.
Figure 11 Point pollution sources within Sousa River's watershed [5].
According to Figure 11, there are several industries, with different types of activity, able to deteriorate the quality of the Sousa River. Among these are, mineral extracting industries, manufacturing industries (manufacture of wooden furniture and pharmaceutical products, recovery of metal waste and bleaching and dyeing of textile) and food industries (wine industry and slaughter houses for meat production).
Polluting industrial units across Portugal are not obliged by law to possess primary effluent treatment plants (PETPs) within them. These industries can discharge its effluents directly to a stream, or another water body, or into the sewers to be treated, later, by municipal WWTPs. However, these WWTPs are not prepared to treat the toxic chemicals discharged by industries and the effluents pass through them, untreated,
negatively impacting the water [19]. Therefore, it is easy to imagine the areas, in which these WWTPs are located, as sources of great pollution to the environment [112]. According to APA [6], Industries and WWTPs within Sousa River’s watershed, are responsible for the discharge of 545 582 Kg.year-1 of CBO
5, 2 183 447 Kg.year-1 of CQO,
326 250 Kg.year-1 of Nitrogen (N) and 106 816 Kg.year-1 of Phosphorous (P), being the
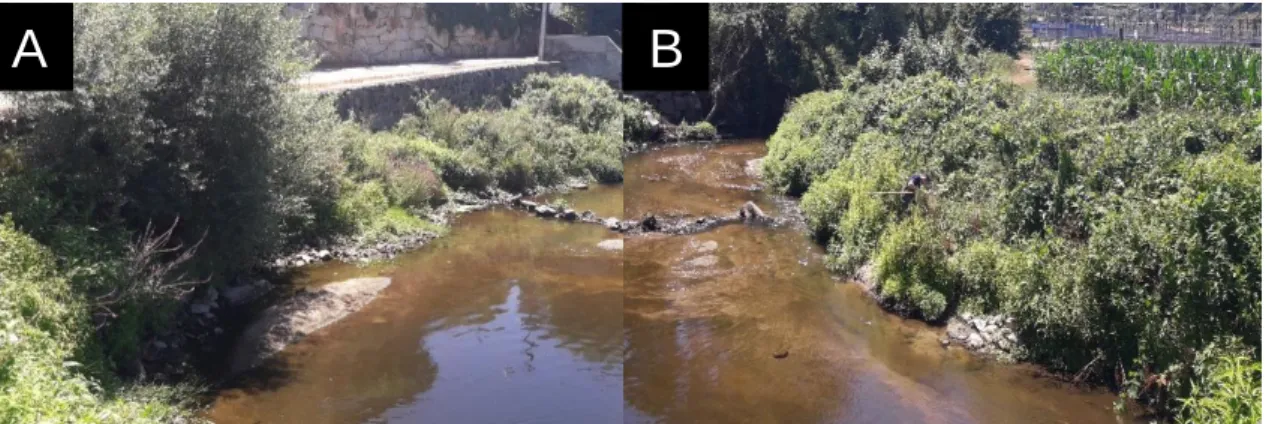
rivers Sousa, Ferreira, Mezio and Cavalum the most affected. The latter suffered, in March 2017, an accidental discharge of 250 thousand litres of manure contained in a byre after a landslide caused the supporting wall to fall (Figure 12A). Also, last year, the Ferreira River was the subject of a "deliberate and programmed" discharge by Arreigada’s WWTP (Figure 12B).
Figure 12(A) Pollution in Cavalum River (Source: Junta de Freguesia de Sobreira); (B) Pollution in Ferreira River (Source:
3. Materials & Methods
3.1 Sampling Sites
According to De Magalhães [41], sampling is a fundamental step in all biological studies, since the validation of the results obtained are dependent of it.
Ideally, in order to know well the functioning of an aquatic ecosystem, it would be necessary to carry out a large number of samples, both spatial and temporal. However, there are some limitations, such as time spent, associated costs and lack of resources. Attempting to maximize the balance between the proposed objectives and the contingencies already mentioned, four sampling points were selected.
Table 2 and Figure 13 present a brief description of the sampling sites under study as well as their geographical localization in the watershed, respectively.
Table IIBrief description of the sampling sites under study.
Sampling
site Description Coordinates
Fraga (LF)
The sampling site “Lugar da Fraga” (LF) is located 5 km from the spring of the Sousa River. It is located in the “União das Freguesias de Pedreira, Rande e Sernande” in the municipality of Felgueiras;
41˚20'10.1"N 8˚12'15.7"W
Poços (LP)
The second sampling site on the Sousa River is situated at “Lugar de Poços” (LP). It is located in the “Freguesia de Guilhufe e Urrô” of the municipality of Penafiel;
41°11'29.5"N 8°20'06.0"W
Senhora do Salto (SS)
The sampling site “Senhora do Salto” (SS) belongs to the Natura 2000 "Valongo" Site (PTCON0024). It is located in the place of Senhora do Salto, in the “Freguesia de Aguiar do Sousa” in the municipality of Paredes;
41°07'43.1"N 8°26'01.7"W
Foz do Sousa (FS)
The last sampling site is located in the “Freguesia da Foz do Sousa” in the municipality of Gondomar. It is the place that is further downstream of the Sousa River, near the confluence with the Ferreira River.
41°05'54.7"N 8°29'38.5"W
Figure 13 Localization of the sampling points in the watershed.
Fraga (LF)
Poços (LP) Senhora do Salto (SS)
3.2 Sampling Frequency
Field trips took place between November 2016 and July 2017, with samplings taking place seasonally.
Macroinvertebrates were collected in spring (April-May), when late larval forms are present, but have not yet begun their final maturation, in summer and, in late autumn (November), after most species have mated and larvae have had the opportunity to develop during the summer [137].
Moreover, water samples, for the determination of some physicochemical parameters, and diatom samples, were done. The determination of the parameters related to hydrology and morphology of the sites under study was also performed, seasonally, when collecting the biological and physicochemical components.
During the winter, no sampling was carried out since the joint increase of rainfall and decreasing solar radiation intensity made samplings more difficult. According to INAG [77], the sampling of macroinvertebrates should never be carried out under the influence of floods and it is necessary to wait until the transparency of the water allows to see the bottom of the river bed. In the case of diatoms, the cell growth rate is lower during this period, and can be translated into smaller responses to environmental conditions [76].
3.3 Habitat Characterization
Jowett [84] was one of the first to define the term “physical habitat”. He suggested that the generic term “habitat” could be used to describe the physical surroundings of plants and animals, and, therefore, aquatic habitat could be defined as the local physical, chemical and biological features that provide an environment for the in-stream biota. Aquatic habitats are affected by in-stream and surrounding topographical features, and are a major determinant of aquatic community potential [1]. There is considerable evidence to suggest that both the quality and quantity of available habitat affect the structure and composition of resident biological communities [23; 70; 107; 173], hence the importance of physical habitat is clear. It is also important to recognize that the term habitat implies some biological significance, and that it is not simply an identifiable physical feature [103].
Indeed, it was recognized by Stalnaker [151] that the productivity of any stream system is likely to be determined by four key factors, namely water quality, the energy budget (e.g. the temperature regime, organic matter, nutrients), the physical structure of the channel, and the flow regime. Based on these factors a combination of the last two produces the physical habitat for the in-stream biota. Indeed, physical habitat is a
![Figure 2 Area of the hydrographic basin of the Douro River [4].](https://thumb-eu.123doks.com/thumbv2/123dok_br/19239154.970762/25.892.131.765.501.1030/figure-area-hydrographic-basin-douro-river.webp)
![Table V Most relevant habitat types to the community of benthic macroinvertebrates (inorganic and organic habitats) and an empirical scale for the identification of inorganic habitats [77].](https://thumb-eu.123doks.com/thumbv2/123dok_br/19239154.970762/49.892.130.763.146.332/relevant-community-macroinvertebrates-inorganic-habitats-empirical-identification-inorganic.webp)

![Table VII Descriptive statistics of the main environmental variables for A) Small Northern Rivers and B) Medium-Large Northern Rivers [75]](https://thumb-eu.123doks.com/thumbv2/123dok_br/19239154.970762/55.892.135.761.249.803/descriptive-statistics-environmental-variables-northern-rivers-medium-northern.webp)
![Figure 14 Spatial-temporal variation of the Visual Habitat Evaluation Index (VHA) [17]](https://thumb-eu.123doks.com/thumbv2/123dok_br/19239154.970762/59.892.128.771.567.887/figure-spatial-temporal-variation-visual-habitat-evaluation-index.webp)