Original
Received 14/5/2010 Accepted 10/10/2011 (004837)
1 Embrapa Uva e Vinho, CP 130, CEP 95700-000, Bento Gonçalves, RS, Brasil, e-mail: miele@cnpuv.embrapa.br *Corresponding author
Analytical characteristics and discrimination of Brazilian commercial grape juice,
nectar, and beverage
Características analíticas e discriminação de suco, néctar e bebida de uva comerciais brasileiros
Luiz Antenor RIZZON1, Alberto MIELE1*
1 Introduction
Serra Gaúcha is the most important Brazilian viticultural region, where more than 80% of the total grape production comes from American and hybrid varieties. These grapes have been processed to make common wine, but they are especially suitable for making grape juice.
In 2009, 207 thousand tons of grapes were crushed to make grape juice; most of them were used for the production of concentrated grape juice (about 65 °Brix). This kind of juice is exported to many countries, and it is usedto make grape nectar and grape beverage. Indeed, Brazil exports about six thousand tons of concentrated grape juice, which places the country among the most important exporters in the world (UNIÃO…, 2009). In addition, whole and sweetened grape juices are mainly made and commercialized in the Brazilian market.
Nowadays, there is an incentive to produce grape juice because it presents important nutritional properties it shows
advantageous alternative to the small farmers, and it is economically sustainable.
There are many papers related to Brazilian grape juices focusing on different aspects of their physicochemical composition and enological processes. Among them, it is important to mention: a) one of the pioneer studies compared juices made from ten American/hybrid grapevine varieties showing that Othelo and Concord juices proved the best varieties due to their sugar/acidity equilibrium (FENOCCHIO, 1973); b) the free amino acids α-alanine, arginine, and glutamic acid were predominant in the American/hybrid grape juices (MIELE; RIZZON, ZANOTTO, 1990); c) the effect of grape ripening on the composition of Isabella, Concord, Ives, and Jacquez juices was studied (ZANUZ, 1991); d) mineral contents of ashes of grape juices made in the state of Rio Grande do Sul, Brazil (RIZZON; MIELE, 1995); e) grape juice discrimination according to their mineral composition through Principal
Resumo
A produção e a comercialização de suco de uva brasileiro estão aumentando anualmente devido a sua tipicidade, qualidade e valor nutritivo. Por isso, realizou-se este trabalho em face de sua importância para a agroindústria de vinho e de suco. O objetivo deste trabalho foi determinar a composição e discriminação do suco de uva em relação a outras bebidas dele derivadas. Avaliaram-se 24 amostras de sucos de uva −integral, adoçado e reprocessado −, néctar de uva e bebida de uva. As variáveis clássicas foram determinadas por meio de métodos físico-químicos; os ácidos tartárico e málico, por HPLC; o metanol, por cromatografia gasosa; e os minerais, por espectrofotometria de absorção atômica. Esses produtos foram discriminados pela Análise de Componentes Principais (ACP). Os resultados mostram que os sucos de uva integral e adoçado discriminaram-se dos demais porque tiveram valores mais elevados de sólidos solúveis totais, ácidos tartárico e málico, a maior parte dos minerais, compostos fenólicos e relação K/Na, enquanto que o néctar de uva e a bebida de uva apresentaram valores mais elevados da relação ºBrix/acidez titulável. O suco de uva reprocessado descriminou-se dos demais devido à elevada concentração de Li e Na e baixo matiz.
Palavras-chave: suco de uva; néctar de uva; bebida de uva; composição; ACP.
Abstract
The production and commercialization of Brazilian grape juice is increasing annually, mainly due to its typicality, quality, and nutritional value. The present research was carried out in view of the great significance of Brazilian grape juice for the grape and wine industry. The purpose of this study, therefore, was to assess its composition as well as the discrimination between grape juice and other beverages. Twenty four samples of whole, sweetened, and reprocessed grape juices, grape nectar, and grape beverage were evaluated. Classical variables were analyzed by means of physicochemical methods; tartaric and malic acids, by HPLC; methanol, by gas chromatography; minerals, by atomic absorption spectrophotometry. These products were discriminated by the Principal Component Analysis (PCA). Results show that whole and sweetened grape juices were discriminated from other grape products because they featured higher values of total soluble solids, tartaric and malic acids, most minerals, phenolic compounds, and K/Na ratio, whereas grape nectar and grape beverage presented higher values of ºBrix/titratable acidity ratio. Reprocessed juice was discriminated due to its higher concentrations of Li and Na and lower hue.
with phosphoric acid to 2.5 pH elution solvent was used. Concentrations were established using an internal standard.
Mineral contents were determined using a Perking Elmer, model 2380, atomic absorption spectrophotometer working in flame ionization. The elements K, Na, Li, and Rb were determined using flame emission, and Ca, Mg, Mn, Fe, Cu, and Zn using atomic absorption (RIZZON; SALVADOR; MIELE, 2008).
The minerals were analyzed without previous sample treatment. When necessary, the samples were diluted in ultrapure deionized quality water (Milli-Q). For each element, the mineral concentrations were determined according to a calibration curve with Merck standard solutions. Phosphorus was determined using the ammonium molibdate (RIBÉREAU-GAYON et al., 1998).
The means and standard errors of each variable were determined for each grape juice type – whole, sweetened, and reprocessed – grape nectar, and grape beverage, and the discrimination among these products was performed by the Principal Component Analysis (PCA) (HAIR JUNIOR et al., 1995) using the Statistica 6.0 program.
3 Results and discussion
The means and standard errors of the analyzed parameters for grape juices – whole, sweetened, and reprocessed –, grape nectar, and grape beverage are shown in Table 1.
It can be seen (Table 1) that the physicochemical compositions of the analyzed products are in accordance with the identity and quality standards concerning variables that meet the parameters established by the Brazilian Ministry of Agriculture, Livestock, and Food Supply related to grape juice, grape nectar, and grape beverage (BRASIL, 2000, 2009).
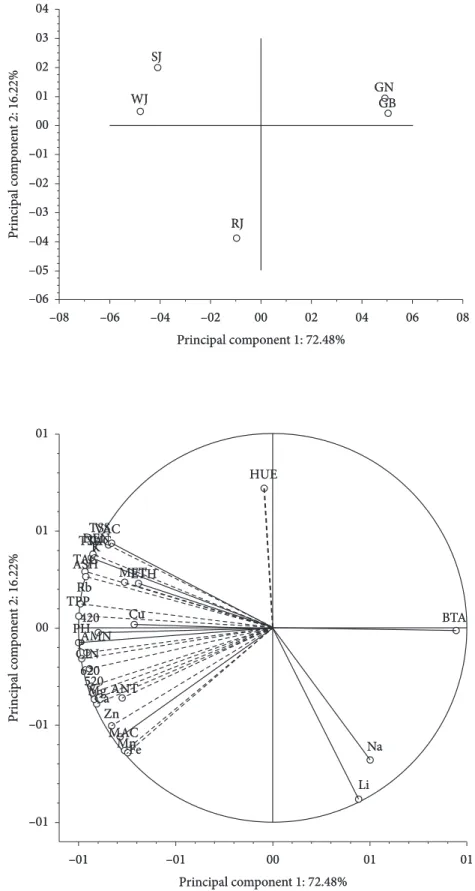
PCA shows that the two principal components were responsible for 88.70% of the total variation, in which PC1 represented 72.48% and PC2 16.22%. PC1 discriminated whole and sweetened grape juices from grape nectar and grape beverage while PC2 discriminated reprocessed juice from the others (Figure 1).
Considering the variables evaluated, PC1 discriminated − values within parentheses represent the correlation coefficients r between the variables and the principal components – pH (–0.994), Rb (–0.988), total polyphenols (–0.986), P (–0.974), titratable acidity (–0.957), ashes (–0.954), color intensity (–0.933), density (–0.932), total sugars (–0.932), tartaric acid (–0.930), OD at 620 nm (–0.926), OD at 520 nm (–0.925), K (–0.924), Mg (–0.921), ammonium nitrogen (–0.918), Ca (–0.902), OD at 420 nm (–0.898), total soluble solids (–0.862), Zn (–0.834), volatile acidity (–0.829), malic acid (–0.790), anthocyanins (–0.776), Mn (–0.763), methanol (–0.759), Fe (–0.748), Cu (–0.710), ethanol (–0.688) and by ºBrix/titratable acidity ratio (0.953). CP2 discriminated Li (–0.881), Na (–0.682), and hue(0.727).
Whole and sweetened juices were analytically similar because in general they were characterized by higher Component Analysis and Hierarchical Clustering Procedures
(FERREIRA et al., 2002); f ) the composition of Isabella, Concord, and Ives grape juices utilizing an extractor panel (RIZZON; LINK, 2006); g) the description of two processes to make grape juices: one of them the extractor panel and the other a tubular heater for color extraction (RIZZON; MANFROI; MENEGUZZO, 1998; RIZZON; MENEGUZZO, 2007); h) anthocyanin contents in whole and reprocessed grape juices (MALACRIDA; MOTTA, 2005, 2006); i) sensory characteristics of grape juice made in the state of Minas Gerais, Brazil, where Folha de Figo (Bordô, Ives) and Isabella proved the best varieties (PEREIRA et al., 2008); j) the characterization of 20 grape juices according to their mineral and heavy metal contents (ASSIS et al., 2008); and k) characterization of grape juices made in two Brazilian viticultural regions (SANTANA et al., 2008).
The concentrated grape juice is a raw material to make grape nectar and grape beverage; in such a case, it should contain 30% of grape juice volume with a minimum of 14 °Brix (BRASIL, 2009). It is also used to make grape soda, which should contain 10% of grape juice volume and carbon dioxide must be supplemented (BRASIL, 2005). Both, grape nectar and grape beverage in general are taken as grape juices despite the fact that they had been diluted.
Accordingly, the purpose of this study was to determine the physicochemical differences among juices – whole, sweetened, and reprocessed − grape nectar, and grape beverage, which may contribute to the quality control, authenticity, and typicality of these Brazilian products.
2 Material and methods
Twenty four grape juices samples– whole, sweetened, and reprocessed − grape nectar, and grape beverage were assessed. The analyses were performed in the laboratories of Embrapa Uva e Vinho, located in Bento Gonçalves, RS, Brazil.
The analyzed variables were: density, ethanol, total soluble solids, titratable acidity, volatile acidity, pH, total sugars, ashes, ammonium nitrogen, total polyphenols, anthocyanins, OD at 420, 520 and 620 nm, color intensity, hue, ºBrix/titratable acidity ratio, methanol, tartaric, and malic acids and minerals (K, Na, Ca, Mg, Mn, Cu, Fe, Zn, P, Rb, and Li). These variables were determined by physicochemical procedures established by the Brazilian Ministry of Agriculture, Livestock, and Food Supply related to fermented and nonalcoholic beverages (BRASIL, 2005).
of chemical additives and preservatives, such as sodium benzoate, since grape must has low concentration of this cation (RIZZON; MIELE, 1995; RIZZON; SALVADOR; MIELE, 2008). The observed low hue was due to a greater absorbance at the wavelength of 420 nm − yellow color − which is a visual positive aspect that is transmitted by the concentrated juice. Another aspect observed was related to the low K, ashes, and tartaric acid contents as compared with whole and sweetened juices. In this case, the reduction of these components was a direct consequence of the enological practices during grape juice processing, which had the objective to attain tartaric stabilization. Hence, the juice loses health beneficial compounds, like as the mineral K, and acquires Na, that could not be desired when it achieves a certain concentration. Because of this, a decrease in the K/Na ratio was already observed (RIZZON; MIELE, 1995).
The lowest pH values present in the reprocessed juices were due to the decrease of tartaric acid concentration compared to the whole grape juice. In the case of the grape nectar and grape beverage, their decrease could have been the consequence of concentrations of most compounds. These juices presented a
physicochemical composition similar to those from the whole grape musts. Usually, they contain no chemical additives or preservatives. Among the compounds that presented higher values are sugars, most minerals, organic acids, and phenolic compounds. The highest anthocyanin concentrations and the lowest OD at 520 nm values presented by whole juices compared to sweetened and reprocessed juices are probably due to the higher coefficient of variation of the commercial whole juice samples.
Reprocessed grape juice is made from diluted concentrated grape juice. This dilution can be done just to reach the whole concentration of the grape must. In this case, the addition of sucrose is permitted, but this practice should be mentioned on the labeling. Samples of this juice showed high contents of Li and Na and low hue. These minerals might be incorporated to the reprocessed juice during dilution with water and addition of sugar and additives occasionally used (FERREIRA et al., 2002; FERRARI; SOARES, 2003; ASSIS et al., 2008). Indeed, the presence of high Na content is an indicative of the use
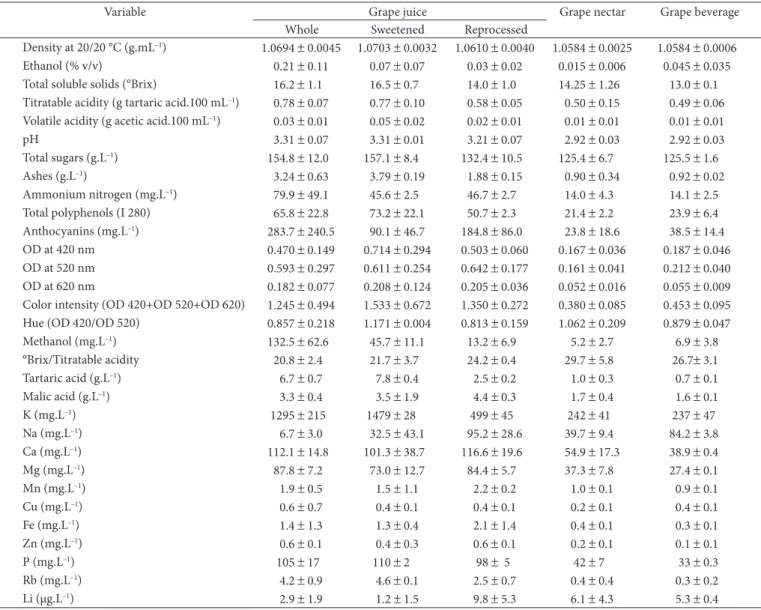
Table 1. Means and standard errors of Brazilian grape juice – whole, sweetened, and reprocessed – grape nectar, and grape beverage.
Variable Grape juice Grape nectar Grape beverage
Whole Sweetened Reprocessed
Density at 20/20 °C (g.mL–1) 1.0694 ± 0.0045 1.0703 ± 0.0032 1.0610 ± 0.0040 1.0584 ± 0.0025 1.0584 ± 0.0006 Ethanol (% v/v) 0.21 ± 0.11 0.07 ± 0.07 0.03 ± 0.02 0.015 ± 0.006 0.045 ± 0.035 Total soluble solids (°Brix) 16.2 ± 1.1 16.5 ± 0.7 14.0 ± 1.0 14.25 ± 1.26 13.0 ± 0.1 Titratable acidity (g tartaric acid.100 mL–1) 0.78
± 0.07 0.77 ± 0.10 0.58 ± 0.05 0.50 ± 0.15 0.49 ± 0.06
Volatile acidity (g acetic acid.100 mL–1) 0.03
± 0.01 0.05 ± 0.02 0.02 ± 0.01 0.01 ± 0.01 0.01 ± 0.01
pH 3.31 ± 0.07 3.31 ± 0.01 3.21 ± 0.07 2.92 ± 0.03 2.92 ± 0.03
Total sugars (g.L–1) 154.8
± 12.0 157.1 ± 8.4 132.4 ± 10.5 125.4 ± 6.7 125.5 ± 1.6
Ashes (g.L–1) 3.24
± 0.63 3.79 ± 0.19 1.88 ± 0.15 0.90 ± 0.34 0.92 ± 0.02 Ammonium nitrogen (mg.L–1) 79.9
± 49.1 45.6 ± 2.5 46.7 ± 2.7 14.0 ± 4.3 14.1 ± 2.5
Total polyphenols (I 280) 65.8 ± 22.8 73.2 ± 22.1 50.7 ± 2.3 21.4 ± 2.2 23.9 ± 6.4 Anthocyanins (mg.L–1) 283.7 ± 240.5 90.1 ± 46.7 184.8 ± 86.0 23.8 ± 18.6 38.5 ± 14.4 OD at 420 nm 0.470 ± 0.149 0.714 ± 0.294 0.503 ± 0.060 0.167 ± 0.036 0.187 ± 0.046 OD at 520 nm 0.593 ± 0.297 0.611 ± 0.254 0.642 ± 0.177 0.161 ± 0.041 0.212 ± 0.040 OD at 620 nm 0.182 ± 0.077 0.208 ± 0.124 0.205 ± 0.036 0.052 ± 0.016 0.055 ± 0.009 Color intensity (OD 420+OD 520+OD 620) 1.245 ± 0.494 1.533 ± 0.672 1.350 ± 0.272 0.380 ± 0.085 0.453 ± 0.095 Hue (OD 420/OD 520) 0.857 ± 0.218 1.171 ± 0.004 0.813 ± 0.159 1.062 ± 0.209 0.879 ± 0.047
Methanol (mg.L–1) 132.5
± 62.6 45.7 ± 11.1 13.2 ± 6.9 5.2 ± 2.7 6.9 ± 3.8 °Brix/Titratable acidity 20.8 ± 2.4 21.7 ± 3.7 24.2 ± 0.4 29.7 ± 5.8 26.7± 3.1 Tartaric acid (g.L–1) 6.7 ± 0.7 7.8 ± 0.4 2.5 ± 0.2 1.0 ± 0.3 0.7 ± 0.1
Malic acid (g.L–1) 3.3
± 0.4 3.5 ± 1.9 4.4 ± 0.3 1.7 ± 0.4 1.6 ± 0.1
K (mg.L–1) 1295 ± 215 1479 ± 28 499 ± 45 242 ± 41 237 ± 47
Na (mg.L–1) 6.7
± 3.0 32.5 ± 43.1 95.2 ± 28.6 39.7 ± 9.4 84.2 ± 3.8
Ca (mg.L–1) 112.1
± 14.8 101.3 ± 38.7 116.6 ± 19.6 54.9 ± 17.3 38.9 ± 0.4 Mg (mg.L–1) 87.8 ± 7.2 73.0 ± 12.7 84.4 ± 5.7 37.3 ± 7.8 27.4 ± 0.1
Mn (mg.L–1) 1.9
± 0.5 1.5 ± 1.1 2.2 ± 0.2 1.0 ± 0.1 0.9 ± 0.1
Cu (mg.L–1) 0.6
± 0.7 0.4 ± 0.1 0.4 ± 0.1 0.2 ± 0.1 0.4 ± 0.1
Fe (mg.L–1) 1.4 ± 1.3 1.3 ± 0.4 2.1 ± 1.4 0.4 ± 0.1 0.3 ± 0.1
Zn (mg.L–1) 0.6
± 0.1 0.4 ± 0.3 0.6 ± 0.1 0.2 ± 0.1 0.1 ± 0.1
P (mg.L–1) 105 ± 17 110 ± 2 98 ± 5 42 ± 7 33 ± 0.3
Rb (mg.L–1) 4.2
± 0.9 4.6 ± 0.1 2.5 ± 0.7 0.4 ± 0.4 0.3 ± 0.2
Li (µg.L–1) 2.9
Figure 1. Projection of grape juices – whole, sweetened, and reprocessed – grape nectar, and grape beverage on the plane formed by the principal components 1 × 2 of the PCA. Legend: WJ – Whole grape juice; SJ – Sweetened grape juice; RJ – Reprocessed grape juice; GN – Grape nectar; GB – Grape beverage; DEN – Density; ETH - Ethanol; TSS – Total soluble solids; TAC – Titratable acidity; VAC – Volatile acidity; PH − pH; TSU – Total sugars; ASH – Ashes; AMN – Ammonium nitrogen; TPP – Total polyphenols; ANT – Anthocyanins; 420 – OD at 420 nm; 520 – OD at 520 nm; 620 – OD at 620 nm; CIN – Color intensity; HUE – Hue; BTA – ºBrix/Titratable acidity; MET − Methanol; TAC – Tartaric acid; MAC – Malic acid; K, Na, Ca, Mg, Mn, Fe, Cu, Zn, Li, Rb, and P.
AMN
MAC
–06 –04 –02 00 02 04 06 08
–08 –06 –05 –04 –03 –02 –01 00 01 02 03 04
WJ SJ
GN
RJ
GB
P
rin
ci
pa
l co
m
po
n
en
t 2: 16.22%
Principal component 1: 72.48%
Fe Mn Zn
ANT Ca Mg 520 620 CINP PH420
Cu TPP
Rb ASH
ETH MET TAC
VAC TSS DEN K
HUE
BTA
Na
Li TAC
TSU
–01 –01 00 01 01
Principal component 1: 72.48% 01
01
00
–01
–01
P
rin
ci
pa
l co
m
po
n
en
FENOCCHIO, P. Competição de matéria-prima para elab’oração de suco de uva. Pesquisa Agropecuária Brasileira, v. 8, n. 8, p. 263-266, 1973. FERRARI, C. C.; SOARES, L. M. V. Concentrações de sódio em bebidas
carbonatadas nacionais. Ciência e Tecnologia de Alimentos, v. 23, n. 3, p. 414-417, 2003. http://dx.doi.org/10.1590/S0101-20612003000300021 FERREIRA, E. C. et al. Análise exploratória dos teores de constituintes inorgânicos em sucos e refrigerantes de uva. Eclética Química, v. 27, n. 1, p. 1-12, 2002.
HAIR JUNIOR, J. F. et al. Multivariate data analysis: with readings. 4. ed. Upper Saddle River: Prentice Hall, 1995.758 p.
MALACRIDA, C. R.; MOTTA, S. Compostos fenólicos totais e antocianinas em suco de uva. Ciência e Tecnologia de Alimentos, v. 25, n. 4, p. 659-664, 2005. http://dx.doi.org/10.1590/S0101-20612005000400006
MALACRIDA, C. R.; MOTTA, S. Antocianinas em suco de uva: composição e estabilidade. Boletim do Centro de Pesquisa e Processamento de Alimentos, v. 24, n. 1, p. 59-82, 2006.
MIELE, A.; RIZZON, L. A.; ZANOTTO, D. Free amino acids in Brazilian grape juices. Rivista di Viticoltura e di Enologia,v. 43, n. 3, p. 15-21, 1990.
PEREIRA, G. E. et al. Avaliação do potencial de cinco cultivares de videiras americanas para sucos de uva no sul de Minas Gerais. Ciência e Agrotecnologia, v. 32, n. 5, p. 1531-1537, 2008. RIBÉREAU-GAYON, P. et al. Traité d’œnologie: 2. chimie du vin;
stabilisation et traitements. Paris: Dunod, 1998. 519 p.
RIZZON, L. A.; MIELE, A. Características analíticas de sucos de uva elaborados no Rio Grande do Sul. Boletim da Sociedade Brasileira de Ciência e Tecnologia de Alimentos, v. 29, n. 2, p. 129-133, 1995. RIZZON, L. A.; MANFROI, V.; MENEGUZZO, J. Elaboração de suco de uva na propriedade vitícola. Bento Gonçalves: Embrapa Uva e Vinho, 1998. (Documentos, 21).
RIZZON, L. A.; LINK, M. Composição do suco de uva caseiro de diferentes cultivares. Ciência Rural, v. 36, n. 2, p. 689-692, 2006. http://dx.doi.org/10.1590/S0103-84782006000200055
RIZZON, L. A.; MENEGUZZO, J. Suco de uva. Brasília: Embrapa, 2007. (Coleção Agroindústria Familiar).
RIZZON, L. A.; SALVADOR, M. B. G.; MIELE, A. Teores de cátions dos vinhos da Serra Gaúcha. Ciência e Tecnologia de Alimentos, v. 28, n. 3, p. 1-7, 2008.
SANTANA, M. T. A. et al. Caracterização de diferentes marcas de sucos de uva comercializados em duas regiões do Brasil. Ciência e Agrotecnologia, v. 32, n. 3, p. 882-886, 2008. http://dx.doi. org/10.1590/S1413-70542008000300027
UNIÃO BRASILEIRA DE VITINICULTURA - UVIBRA. Dados da vitivinicultura: quantidade de uvas processadas no Rio Grande do Sul. Bento Gonçalves, 2009, Embrapa Uva e Vinho. In: EMBRAPA Uva e Vinho. Disponível em: <http://www.cnpuv.embrapa.br/ prodserv/vitivinicultura>. Acesso em: 31 mar. 2010.
ZANUZ, M. C. Efeito da maturação sobre a composição do mosto e qualidade do suco de uva. 1991, 177 f. Dissertação (Mestrado em Fitotecnia)- Universidade Federal do Rio Grande do Sul, Porto Alegre, 1991.
the higher proportion of free tartaric acid in these products in relation to the salified tartaric acid. Moreover, another reason have been the addition of acidulate products.
Grape nectar and grape beverage showed a distinct composition because they were processed from the dilution of whole grape juice. These products should be made by using a minimum of 30% of whole grape juice (14 °Brix) in volume (BRASIL, 2009). They had low concentrations of the most variables evaluated, except for Li and Na concentrations. For this reason, they have lower nutritional importance as compared to the grape juices, especially the whole and sweetened products.
4 Conclusions
Grape juices – whole, sweetened, and reprocessed − grape nectar, and grape beverage are discriminated by the Principal Component Analysis according to their physicochemical composition. Among these products, whole and sweetened grape juices show higher values of almost all compounds analyzed, especially sugars, tartaric and malic acids, minerals, and phenolic compounds. In addition, they have a higher K/ Na ratio. Reprocessed juice discriminates from the other juice products due to its high Li and Na concentrations. Grape nectar and grape beverage are characterized by a higher °Brix/ titratable ratio.
References
ASSIS, R. A. et al. Elementos-traço e sódio em suco de uva: aspectos nutricionais e toxicológicos. Química Nova, v. 31, n. 8, p. 1948-1952, 2008. http://dx.doi.org/10.1590/S0100-40422008000800006
AUGUSTE, M. H. Application de la chromatographie en
phase liquide à haute pression à l´analyse des moûts et des vins. 1979, 135 f. Thèse (Doctorat en Oenologie-Ampélologie)- Institut d´Oenologie, Université de Bordeaux II, Talence, 1979. BERTRAND, A. Recherches sur l’analyse des vins par chromatographie
en phase gazeuse.1975, 291 f. Thèse (Doctorat d’État ès Sciences)- Institut d’Oenologie, Université de Bordeaux II, Talence, 1975. BRASIL. Ministério da Agricultura e do Abastecimento. Instrução
Normativa nº 01, de 07 de janeiro de 2000. Regulamento técnico geral para fixação dos padrões de identidade e qualidade para polpa de fruta. Diário Oficial da República Federativa do Brasil, Brasília, DF, 10 jan. 2000, Seção 1, p. 54-58.
BRASIL. Ministério da Agricultura, Pecuária e Abastecimento. Secretaria de Defesa Agropecuária. Instrução Normativa nº 24, de 8 de setembro de 2005. Diário Oficial da República Federativa do Brasil, Brasília, DF, 20 set. 2005, Seção 1, p. 11.