NET PRECIPITATION IN A SEMIDECIDUOUS FOREST FRAGMENT IN
VIÇOSA CITY, MG
1João Paulo Oliveira Freitas2*, Herly Carlos Teixeira Dias3, Elias Silva3 and Kelly Cristina Tonello4
1 Received on 23.09.2015 accepted for publication on 01.09.2016.
2 Universidade Federal de Viçosa, Programa de Pós-Graduação em Ciência Florestal, Viçosa, MG - Brasil. E-mail: <jpfreitaz@yahoo.com.br>.
3 Universidade Federal de Viçosa, Departamento de Engenharia Florestal, Viçosa, MG - Brasil. E-mail: <herlycarlostdias@gmail.com> and <eshamir@ufv.br>.
4 Universidade Federal de São Carlos, Departamento de Ciências Ambientais , Sorocaba, SP - Brasil. E-mail: <kellytonello@yahoo.com>. *Corresponding author.
ABSTRACT – We aimed to evaluate the net precipitation and rainfall interception in a fragment of semideciduous forest at both early and advanced stages of regeneration in Viçosa city, Minas Gerais state, southeastern Brazil, from January 2012 through July 2013. Six plots were stablished, three in each regeneration stage area. For throughfall and stemflow quantification, 25 rain gauges and collectors were installed in trees having circumference higher than 15 cm, in each plot. An additional rain gauge was installed in an open area to quantify gross precipitation. Gross precipitation in the studied period was 1934 mm. On average, 79.3% and 72.6% of gross precipitation reached the soil via net precipitation in the areas at early and advanced regeneration stages, respectively. Rainfall interception by the forest canopy was higher in the advanced-regeneration area, corresponding to 25.8% of gross precipitation. In the early- regeneration area, on the other hand, rainfall interception accounted for 20.2% of gross precipitation. This suggests that more densely populated areas intercept more rainfall, and consequently have lower net precipitation. Thus, our study shows that rainwater distribution in forest environments changes according to their regeneration status. The replacement of species at different successional stages renders the water to follow different pathways, such as interception, stemflow, and throughfall. This information helps us understand that the succession process can be slow, yet it is the natural way of forest regeneration.
Keywords: Forest hydrology; Watershed management; Interception.
PRECIPITAÇÃO EFETIVA EM UM FRAGMENTO FLORESTAL ESTACIONAL
SEMIDECIDUAL, VIÇOSA, MG
1. INTRODUCTION
The hydrologic cycle is defined as the movement of water and the changes in its state during such movement. Understanding the water dynamics on the planet is the starting point for hydrologic studies (QUEIROZ; OLIVEIRA, 2013).
Universally, the volume of water in each stage of the hydrologic cycle is relatively constant. However, when considering a limited area, the amounts of water in each part of the cycle vary continuously within a wide range. Overabundance and scarcity of rainfall represent the extremes of this variation in a given area (GARCEZ, 1976).
The rainfall that precipitates in a forest may follow two pathways: it may either return to the atmosphere through evapotranspiration (concomitant loss of soil water through evaporation and of plant water through transpiration) or reach the soil through the litter or trees stems. A portion of the water that reaches the soil generates surface runoff and reaches watercourses or surface water tanks. The other part is temporarily stored through soil infiltration and may be released to the atmosphere through evapotranspiration, be kept as soil water for a while longer, or get filtrated as underground water. Anyway, the soil-stored water that was not evapotranspirated flows slowly through the forest and originates runoff, which sustains water sources (FREITAS et al., 2013).
The hydrologic cycle has several components, but one of them is often overlooked in research: rainfall interception by vegetation. Rainfall interception has a major importance in water balance, especially in areas with large forests. The influence of vegetation on catching and redistributing rainwater is quite significant in the context of water balance of a given area (OLIVEIRA et al., 2008).
The amount of water precipitated above the canopy is frequently confused with the amount of water available to the soil. The lack of information on interception of the water that precipitates through the vegetation can lead to errors in the real measures of the amount
sucessionais, faz com que a água siga caminhos diferentes, interceptação, escoamento pelo tronco, precipitação interna. Esta informação nos ajuda a compreender que este processo pode ser demorado e é o caminho natural das regenerações.
Palavras-chave: Hidrologia florestal; Manejo de bacias hidrográficas; Interceptação.
of water that will effectively contribute to maintaining soil available humidity, which may compromise water balance calculation. This is due to the fact that part of the precipitation in contact with vegetation accumulates on leaves and branches and then returns to the atmosphere through evaporation (losses by interception). Another part of the water flows through stems and drips from leaves, reaching the soil. This other part, added to the part of the rain that directly crosses the canopy, forms the net precipitation, which effectively contributes to recharging soil water (OLIVEIRA et al., 2008).
Stemflow is the rainwater which, after being retained by the canopy, runs off through branches and stems toward the soil. In order for stemflow to occur, canopy must first be saturated, i.e., the maximum water retention capacity must be reached. After the canopy is saturated, as the rain continues to fall, the process of stemflow takes place (SHINZATO et al., 2011).
In view of the importance of the Atlantic Forest biome and of the great devastation that its ecosystems have been going through, studies that characterize the water regime in its areas are needed. Such studies would enable a better understanding of how water gets distributed across the biome and how the relationship between water and ecosystems takes place at different successional stages of the Forest.
Thus, we aimed to compare the throughfall, rainfall interception, stemflow, and net precipitation in areas of a semideciduous seasonal forest fragment at early and advanced stages of regeneration in Viçosa city, Minas Gerais state, southeastern Brazil.
2. MATERIAL AND METHODS
The conservation unit is located in the Córrego Santa Catarina Watershed, which is an affluent of São Bartolomeu River, on the Rio Doce Watershed. Vegetation in the site is semideciduous seasonal tropical forest (VELOSO, 1991).
According to Köppen’s classification, the region has a hot temperate climate, with rainy summers and dry, cold winters (Cwb). Mean annual precipitation, mean relative humidity, and mean annual temperature are 1268.2 mm, 81%, and 20 ºC respectively, according to the data obtained in a local meteorological station for the 1968-2010 period (LORENZON et al., 2013).
Gross precipitation was measured using a rain gauge with a 167-cm2 catchment area, which was installed
in a tower above the forest canopy.
For throughfall quantification, six plots (20 x 20 m) were established, three in each regeneration stage area, with a 10-m spacing among them. Each plot consisted
of 25 rain gauges distant 5 m from each other. Gauges had an individual catchment area of 75.4 cm2 in the
early regeneration area and 81.7 cm2 in the advanced
regeneration area. Throughfall was quantified using the equation:
where Tf is the throughfall (mm), V is the volume of water collected in each rain gauge (ml), and A is the catchment area of each gauge (cm2).
For stemflow calculation, a subplot (10 x 10 m) was established within each throughfall plot. In those subplots, polyurethane rainfall collectors were adapted to tree stems having circumference at breast height > 15 cm, totalizing 129 trees: 27 in plot 1, 19 in plot 2, 23 in plot 3, 26 in plot 4, and 17 in plots 5 and 6, each. A hose was affixed to the collectors and directed rainwater to individual plastic recipients. Stemflow was calculated using the equation:
where Sf is the stemflow (mm), V is the volume of water gathered in each collector (L), and SA is the subplot area (100 m2).
Net precipitation (NP) was obtained by the sum of throughfall and stemflow, according to the equation:
NP = Tf + Sf, mm
Losses by interception (I) were measured by the difference between gross precipitation (GP) and net precipitation, according to the equation:
I = GP – NP, mm
Gross precipitation, stemflow, and net precipitation were calculated for each rainfall event collected in the plots, and then averages were taken for each plot. Data was obtained between January 2012 and June 2013. Whenever possible, recordings were made soon after each rainfall event. Thus, each data collection consisted of one or more precipitations. Measurements were taken using measuring cylinders and measuring buckets.
Pi = (–)AV x 10
Et =
AS
__
V
Figure 1 – Mata do Paraíso conservation unit. Adapted from LORENZON 2011.
Data was recorded in spreadsheets and subjected to correlation analysis, analysis of variance (ANOVA) at 5% probability using software SAS (SAS Institute, 2002), and linear regression analysis.
3. RESULTS
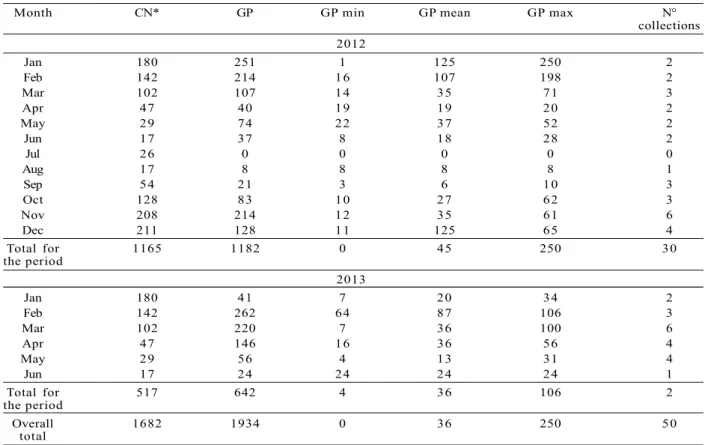
Gross precipitation in the period was 1934 mm, the rainiest months being January, February, and November 2012 and February, March, and April 2013. The driest months were April through September 2012 and May and June 2013. July 2012 was the only month with no precipitation. A striking difference of more than 200 mm could be noticed between January 2012 and January 2013 (TABLE 1).
Throughfall was 1526 mm in the area at early stage of regeneration, which corresponded to 79.3% of gross precipitation, and 1406 mm in the area at advanced
stage of regeneration, the equivalent to 72.6% of gross precipitation. On average, throughfall was higher in plots of the area at early stage of regeneration (TABLE 2), except in May and August 2012. Throughfall in the early-regeneration area was lower than in the advanced-regeneration one only at the rainfall class lower than 2.5 mm (TABLE 3).
Stemflow varied considerably between the areas at early and advanced stages of regeneration, by F test at 5% probability (F1,100 = 31.705; P = 0.00). The
values recorded for this parameter were 8.62 mm in the early-regeneration area and 29.42 mm in the advanced-regeneration one (TABLE 2), corresponding to 0.44% and 1.52% of gross precipitation, respectively. Additionally, stemflow showed a high coefficient of correlation with gross precipitation in the early-regeneration area, unlike what was observed the advanced-regeneration one (Figure 2).
Table 1 – Monthly values of gross precipitation (mm) and climate normals (CN) in Mata do Paraíso, Viçosa city – Minas Gerais state, southeastern Brazil. January 2012 through June 2013.
Tabela 1 – Valores mensais (mm) de precipitação (P) em aberto, Normais Climatológicas (NC) na Mata do Paraiso, Viçosa-MG. Janeiro 2012 a junho 2013.
Month CN* GP GP min GP mean GP max N°
collections 2012
Jan 180 251 1 125 250 2
Feb 142 214 16 107 198 2
Mar 102 107 14 35 71 3
Apr 47 40 19 19 20 2
May 29 74 22 37 52 2
Jun 17 37 8 18 28 2
Jul 26 0 0 0 0 0
Aug 17 8 8 8 8 1
Sep 54 21 3 6 10 3
Oct 128 83 10 27 62 3
Nov 208 214 12 35 61 6
Dec 211 128 11 125 65 4
Total for 1165 1182 0 45 250 30
the period
2013
Jan 180 41 7 20 34 2
Feb 142 262 64 87 106 3
Mar 102 220 7 36 100 6
Apr 47 146 16 36 56 4
May 29 56 4 13 31 4
Jun 17 24 24 24 24 1
Total for 517 642 4 36 106 2
the period
Overall 1682 1934 0 36 250 50
total
4. DISCUSSION
Gross precipitation in the studied period differed from climate normals in only 252 mm, showing that the period was quite typical in terms of rainfall distribution.
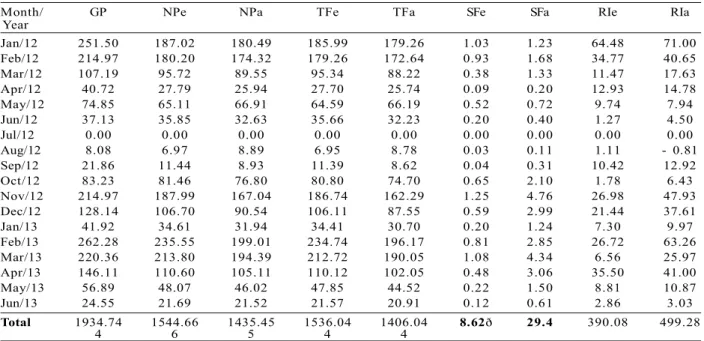
In August 2012, throughfall in the advanced-regeneration area was higher than gross precipitation, resulting in a negative interception. As throughfall is usually lower than gross precipitation due to rainwater interception by the forest canopy, this value can be explained by the rainfall spatial distribution, which Table 2 – Gross precipitation (GP), net precipitation (NP), throughfall (TF), stemflow (SF), and rainfall interception (RI) (mm) in areas at early (e) and advanced (a) stages of regeneration in Mata do Paraíso, Viçosa city – Minas Gerais state, southeastern Brazil. January 2012 through June 2013.
Tabela 2 – Valores (mm) referentes a precipitação em aberto (PA), precipitação efetiva (PE), precipitação interna (PI), escoamento pelo tronco (Et) e interceptação (I) em estagio inicial (i) e avançado (a) de regeneração na Mata do Paraiso, Viçosa-MG. Janeiro 2012 a junho 2013.
Month/ GP NPe NPa TFe TFa SFe SFa RIe RIa
Year
Jan/12 251.50 187.02 180.49 185.99 179.26 1.03 1.23 64.48 71.00
Feb/12 214.97 180.20 174.32 179.26 172.64 0.93 1.68 34.77 40.65
Mar/12 107.19 95.72 89.55 95.34 88.22 0.38 1.33 11.47 17.63
Apr/12 40.72 27.79 25.94 27.70 25.74 0.09 0.20 12.93 14.78
May/12 74.85 65.11 66.91 64.59 66.19 0.52 0.72 9.74 7.94
Jun/12 37.13 35.85 32.63 35.66 32.23 0.20 0.40 1.27 4.50
Jul/12 0.00 0.00 0.00 0.00 0.00 0.00 0.00 0.00 0.00
Aug/12 8.08 6.97 8.89 6.95 8.78 0.03 0.11 1.11 - 0.81
Sep/12 21.86 11.44 8.93 11.39 8.62 0.04 0.31 10.42 12.92
Oct/12 83.23 81.46 76.80 80.80 74.70 0.65 2.10 1.78 6.43
Nov/12 214.97 187.99 167.04 186.74 162.29 1.25 4.76 26.98 47.93
Dec/12 128.14 106.70 90.54 106.11 87.55 0.59 2.99 21.44 37.61
Jan/13 41.92 34.61 31.94 34.41 30.70 0.20 1.24 7.30 9.97
Feb/13 262.28 235.55 199.01 234.74 196.17 0.81 2.85 26.72 63.26
Mar/13 220.36 213.80 194.39 212.72 190.05 1.08 4.34 6.56 25.97
Apr/13 146.11 110.60 105.11 110.12 102.05 0.48 3.06 35.50 41.00
May/13 56.89 48.07 46.02 47.85 44.52 0.22 1.50 8.81 10.87
Jun/13 24.55 21.69 21.52 21.57 20.91 0.12 0.61 2.86 3.03
Total 1934.74 1544.66 1435.45 1536.04 1406.04 8.62ð 29.4 390.08 499.28
4 6 5 4 4
** Significant by F test at 5% probability.
Table 3 – Gross precipitation (GP), net precipitation (NP), throughfall (TF), stemflow (SF), and rainfall interception (RI) (mm) in areas at early (e) and advanced (a) stages of regeneration in Mata do Paraíso, Viçosa city – Minas Gerais state, southeastern Brazil, by rainfall classes. January 2012 through June 2013.
Tabela 3 – Valores (mm) referentes a precipitação em aberto (PA), precipitação efetiva (PE), precipitação interna (PI), escoamento pelo tronco (Et) e interceptação (i) em estagio inicial (i) e avançado (a) de regeneração, por classe de precipitação na Mata do Paraiso, Viçosa-MG. Janeiro 2012 a junho 2013.
Rainfall class Frequency GP NPe NPa TFe TFa SFe SFa RIe RIa
< 2.5 1 1.20 2.14 4.33 2.14 4.24 0.00 0.09 -0.94 -3.13
2.5 -5.0 2 4.34 3.55 2.91 3.55 2.84 0.00 0.07 0.80 1.44
5.0 - 10.0 7 7.91 8.49 8.19 8.48 8.05 0.02 0.14 -0.58 -0.28
10.0 - 20.0 11 13.34 11.65 10.35 11.60 10.07 0.04 0.27 1.69 2.99
20.0 - 30.0 10 24.55 26.40 20.32 26.30 19.85 0.10 0.47 -1.85 4.23
30.0 - 40.0 3 35.13 27.90 26.14 27.77 25.30 0.13 0.84 7.23 8.99
40.0 - 50.0 3 44.71 39.66 35.04 39.42 34.06 0.23 0.98 5.05 9.67
50.0 - 60.0 3 54.89 42.19 38.54 41.90 37.77 0.29 0.78 12.70 16.35
60.0 - 70.0 4 63.47 58.95 53.30 58.52 51.87 0.43 1.42 4.53 10.18
was not uniform across the entire watershed area. Besides, rain gauges installed within the forest can also collect an additional amount of water that isdirected to the
gauge by leaves located above it. Lorenzon et al. (2013), working in the same area, also observed throughfall values higher than gross precipitation ones.
Figure 2 – The relationship between gross precipitation and throughfall (A), stemflow (B), net precipitation (C), and rainfall interception (D) in areas at early (e) and advanced (a) stages of regeneration in Mata do Paraíso, Viçosa city – Minas Gerais state, southeastern Brazil. January 2012 through June 2013.
The percent throughfall values we found differed slightly from those reported by Lorenzon et al. (2013), who found 84.39% and 73.04% in the same areas at early and advanced stages of regeneration, respectively. Such small difference can be explained by several factors that affect throughfall, such as the death and birth of trees in the study area, in view of the temporal difference in the two studies; and rainfall intensity.
Throughfall data from areas at both regeneration stages was subjected to linear regression analysisand showed high correlation with gross precipitation, the highest coefficient of determination (R2) for the
early-regeneration area being 0.89 and the highest one for the advanced-regeneration area being 0.88.
The coefficients of determination we found were lower than the ones reported to the same site in other studies (OLIVEIRA JUNIOR; DIAS, 2005; LORENZON et al., 2013). Precipitations higher than 200 mm showed lower correlation. This can be explained by the loss of water during the monitoring, due to fact that the amount rainwater at some precipitation events was higher than the storage capacity of the rain gauges. When precipitation data above 200 mm was excluded from the analysis, we obtained a coefficient of 0.97, which approximates the ones observed by the other authors.
Stemflow in the advanced-regeneration area was higher at all rainfall classes, probably due to the higher rainfall interception by the dense tree crowns. In the early-regeneration area, only rainfall events above 5.0 mm generated stemflow. According to Oliveira Junior and Dias (2005), such percentages, despite low, are very important as the amount and slow velocity of the portion of water that reaches the soil through stemflow facilitates infiltration.
According to Lima (1979), tree roots develop deeply in zones of the soil profile that have an adequate humidity supply. For instance, the author reported a high concentration of roots around and near stems of neighboring trees, probably due to the high water-recharge of the soil in that region caused by stemflow water. Among other responsible factors, in general the high root concentration on superficial soil layers might be due to the higher amount of water available in those layers. The low stemflow value found in the area at early stage of regeneration in relation to the one at advanced stage of regeneration is due to the more closed canopy
of the latter, which intercepts more rainwater and consequently presents higher stemflow.
Net precipitation was 1544 mm in the early-regeneration area and 1435 mm in the advanced-regeneration area, which corresponds to 79.8% and 74.2% of gross precipitation, respectively. Net precipitation in the early-regeneration area was only lower at the rainfall class below 2.5 mm in relation to the advanced-regeneration one. Oliveira Junior and Dias (2005) reported a net precipitation of 81.7% to the same area, a value very close to the one we found. Oliveira et al. (2008) found 78.5% of net precipitation in the Amazon Forest. Diniz et al. (2013) found similar values in the Atlantic Forest at Rio de Janeiro state: 77.89% of total precipitation in the Secondary Forest at early stage, 79.26% in the Secondary Forest at mid stage, and 76.98% at the Secondary Forest at advanced stage.
Net precipitation did not vary significantly among plots of the areas at early and advanced stages of regeneration, by F test at 5% probability (F1,100 = 0.170; P = 0.6812).
The correlation between gross and net precipitation was 0.89 and 0.88 in the areas at early and advanced stages of regeneration, respectively. These values shows that there is a strong relationship between rainwater that precipitates above the forest canopy and the amount of water that effectively reaches the forest soil.
Rainfall interception was 390.08 and 499.28 mm in the areas at early and advanced stages of regeneration, which corresponds to 20.16% and 25.80% of gross precipitation, respectively. This difference between the areas may be due to a more closed canopy in the advanced-regeneration one, which intercepts more rainwater. In lighter rains, usually higher amounts of water get intercepted. The negative values found are due to the irregular rainfall distribution across the watershed area, which was higher at the area where the throughfall plots were located than at the area with the gross precipitation rain gauges.
Rainfall interception did not vary significantly among plots of the areas at early and advanced stages of regeneration (F1,100 =1.702; P = 0.1950). The coefficient of determination was as low as 0.52 and 0.33 in the areas at early and advanced stages of regeneration, respectively. This can be explained by several factors that affect rainfall, such as: the last precipitation in the site, which can interfere with the volume of intercepted rainwater; canopy humidity, since an already humid canopy intercepts less rain than a dry one; canopy density, as a more closed canopy intercepts more water than an open one; rain intensity, since lighter rainfalls get intercepted to a higher extent; and wind occurrence, which, by shaking the tree crowns, drops the water that got temporarily intercepted.
Although Lorenzon et al. (2013) had already evaluated hydrological variables in the studied site, monitoring such variables across the years is important due to changes in the forest dynamics. For instance, forest ecosystems can change over time due to the death of trees, which alters the canopy structure, or to the birth of new individuals. Additionally, rainfall distribution may also change along the years, which corroborates the need for a continuing monitoring of the studied variables.
5. CONCLUSIONS
The amount of water that runs off through trees stems, i.e. the stemflow, increases along with forest age, as does rainfall interception by the forest canopy. However, rainfall interception showed a low correlation with gross precipitation. Throughfall and net precipitation showed a linear tendency in relation to gross precipitation, the former being the one that contributes the most to recharging soil water.
Stemflow also increases linearly along with gross precipitation in the forest area at early stage of regeneration. Such correlation is lower in the area at advanced stage of regeneration.
Our study showed that rainwater distribution in the forest changes as its regeneration progresses. The replacement of species along different successional stages renders water to follow different pathways, such as interception by the canopy, stemflow, and throughfall. This information helps us comprehend that this process can be slow, yet it is the natural way of forest regeneration.
6. REFERENCES
DINIZ, A.R.; PEREIRA, M.G.; BALIEIRO, F.C.; MACHADO, D.L.; MENEZES, C.E.G.
Precipitação e aporte de nutrientes em diferentes estádios sucessionais de Floresta Atlântica, Pinheiral- RJ. Ciência Florestal,
v.23, n.3, p.389-399, 2013.
FREITAS, J.P.O.; DIAS, H.C.T.; BARROSO, T.H.A.; POYARES, L.B.Q. Distribuição da água de chuva em Mata Atlântica. Ambi-Agua, v.8, n.2, p.100-108, 2013.
GARCEZ, N.L. Hidrologia. São Paulo: Edgard Blucher, 1976. 249p.
INSTITUTO NACIONAL DE METEOROLOGIA -INMET. Normais climatológicas.
[acessado em 25 jan. 2014]. Disponível em: http://www.inmet.gov.br/portal/
index.php?r=clima/normaisClimatologicas.
LIMA, W.P. A água do solo e o
crescimento da floresta. Piracicaba: IPEF,
1979. (Circular Técnica IPEF, 59)
LORENZON, A.S.; DIAS, H.C.T.; LEITE, H.G. Precipitação efetiva e interceptação da chuva em um fragmento florestal com diferentes estágios de regeneração. Revista Árvore,
v.37, n.4, p.619-627, 2013.
OLIVEIRA JUNIOR, J.C.; DIAS, H.C.T.
Precipitação efetiva em fragmento secundário da Mata Atlântica. Revista Árvore, v.29, n.1, p.9-15, 2005.
OLIVEIRA, L.L.; COSTA, R.F.; SOUSA, F.A.S.; COSTA, A.C.L.; BRAGA, A.P. Precipitação efetiva e interceptação em Caxiuanã, na Amazônia Oriental. Acta Amazonica, v.38, n.4, p.723-732, 2008.
QUEIROZ, A.T.; OLIVEIRA, L.A. Relação entre produção e demanda hídrica na bacia do Rio Uberabinha, estado de Minas Gerais, Brasil.
Sociedade & Natureza, v.25, n.1,
p.191-204, 2013.
SHINZATO, E.T.; TONELLO, K.C.; GASPAROTO, E.A.G.; VALENTE, R.O.A. Escoamento pelo tronco em diferentes povoamentos florestais na Floresta Nacional de Ipanema em Iperó, Brasil.
Scientia Forestalis, v.39, n.92, p.395-402,
2011.
VELOSO, H.P.; RANGEL-FILHO, A.L.R.; LIMA, J.C.A. Classificação da vegetação brasileira, adaptada a um sistema
universal. Rio de Janeiro: IBGE,