http://dx.doi.org/10.1590/1806-9061-2015-0032
Author(s)
Mert NI
Yildirim BAII
I Department of Biochemistry, Faculty of
Ve-terinary Medicine, University of Yuzuncu Yil, 65080, Van, Turkey
II Department of Biochemistry, Faculty of
Ve-terinary Medicine, University of Ataturk, 25200, ERZURUM, Turkey
Mail Address
Corresponding author e-mail address Betul Apaydin Yildirim
Department of Biochemistry, Faculty of Veterinary Medicine, University of Ataturk, 25200, ERZURUM-TURKEY
Tel: +90 535 2729293
Email: [email protected]
Keywords
Antioxidant, lipid peroxidation, molting, ovarium, thyroid.
Submitted: May/2016 Approved: August/2016
ABSTRACT
The aim of this study was to evaluate the effects of forced molting using biochemical parameters and histopathological findings in laying hens. 36 Hyline W36 strain laying hens, 90 weeks old were chosen for this research. Eight of these chickens were randomly selected and placed in a cage as the control group before the molting program began. All the others 28 chickens were used for the forced molting program. Eight laying hens were slaughtered at the end of the molting program named as molting group. The remaining 20 hens were fed for 37 days, weighted and slaughtered when they reached the maximum egg production (80%) as postmolting group. Then, blood was analyzed for malondialdehyde, glutathione, catalase, glucose, calcium, phosphorus, albumin, globulin, total protein, triiodothyronine, thyroxine and Vitamin C. The malondialdehyde and glutathione levels of the thyroid and liver tissues were also analyzed along with an examination of the histopathological changes of the liver, ovarium and thyroid glands; and live body, liver, ovarium, thyroid weights and thyroid lengths. In conclusion, it was found that forced molting produces stress and notable side effects in hens, like the oxidant and antioxidant status of the organs, tissue weights and sizes, hormon profiles, blood biochemical and histopathological parameter changes. The activities of thyroid malondialdehyde (p<0.05), liver glutathione (p<0.01), plasma catalase (p<0.001) were significantly decreased in molting group compared to control values, while liver malondialdehyde levels were significantly increased (p<0.001) and thyroid glutathione levels had nonsignificant effect. These levels in molting hens were the first study for veterinary science.
INTRODUCTION
Molting is a natural process that occurs in all adult birds for renewing feathers, resulting in weight loss, regression of the reproductive organs and cutting of egg production (Park et al. 2004).
Forced molting is a procedure that when egg production falls below economical levels, hens are forced to stop laying eggs and molt using enviromental modifications. This application causes some physiological changes and resting of the reproductive organs. At the end of molting, egg production returns close to its former level (Brake et al. 1984;
Gildersleeve et al. 1982). During molting, the reproductive system of birds undergoes complete remodeling regression and regeneration (Sundaresan et al. 2006).
Free radicals are responsible for the irreversible damage of membrane lipids and proteins. In protein metabolism sulfhydryl groups the focus is on the effect of free radicals and changes to the S-S band formation. Reactive oxygen species (ROS) can easily affect the membrane lipids and cause the formation of unsaturated aldehydes which are more resistant than free radicals, directly disturbing the structure of the cellular biomolecules and causing the modification of protein and other molecules, lipid peroxidation, erythrocyte hemolysis; and inhibition of protein synthesis (Halliwell & Gutteridge, 1985).
Glucose is the main sugar in the body and is used for energy production and formation of different substances using the carbohydrate metabolism in the body (Martin, 1981).
Calcium (Ca) and phosphorus (P), organic substanes in an organism, were examined together in terms of nutrition and metabolism and are closely associated with each other (Mert, 1996; Kramer, 1980). Ca and P play an important role in the formation of the laying hens where Ca is the most abundant cation in the chicken´s body. This amount is approximately 20 g and daily 10% of what the body stores is released for the formation of the egg shell (Hudson et al. 1971). Egg
formation begins with ovulation and approximately 8 days later the ovum falls into the infindibulum in the form of a follicle, then finds it´s way to the uterus for calcification which takes 19 hours in the uterus. Ca comes from the intestine and is transfered to the egg shell region by blood and calcium binding protein (CaBP), which facilitates the transfer of Ca in the intestinal wall and uterus (Hudson et al. 1971; Gilbert,
1971; Guyer et al. 1980).
It is known that more than 20 proteins are found in serum and each one has a different function in the body. They have different physical and biochemical properties and serum proteins change in various physiological and pathological conditions. They fullfill numerous physiological functions like regulation of celluler transport, celluler activity, osmotic pressure, homeostasis, the immune system hormone; and enzymatic mechanisms (Beseoglu, 2002).
The thyroid follicular cells secret triiodothyronine (T3) and thyroxine (T4) hormones; and in addition calcitonin is secreted from the parafollicular cells which is effective to the calcium metabolism. In general T3 and T4 hormonel regulate the basal metabolism. Their binding to a receptor regulates protein production within the cell, accelerates oxidation in the mitochondria and controls the activity of the structure of the enzyme membrane (Tezelman & Siperstein, 1997).
Vitamins are necessary to maintain the normal metabolic events in the body and must be taken in small quantities in food and participate in the structure and functions of many many enzymes and hormones, which play an important role in the growth, development, reproductive, and immune systems because of their distinctive structures (Brown, 1997; Akkan, 1999).
The histological process of oviducal regression during the molting period and regeneration of reproductive organs has been examined. During the molting period a reduction in cell size of regression during atresia is accompanied by autolysis of follicular cells (Yoshimura & Tamura, 1985; Yoshimura et al., 1989) and apoptosis (Johnson et al., 1996).
The aim of this study was to evaluate the effects of forced molting using biochemical and histopathological parameters in laying hens.
MATERIAL AND METHODS
Animals
In this study, 90 week old Hyline W36 strain laying hens were chosen as research material from a Commercial Egg Production Farm (BAY-TAV), in Van, TURKEY. The experiments were conducted according to the ethical norms approved by the Ethic Committee of Experimental Animal Teaching and Researcher Center (No: 26.02.2009 2009-YYU-02). All hens were placed in cages of 40x80 cm and their feet numbered. Eight randomly selected hens were weighed, placed in a cage; and labeled as the control (C). The other 28 hens were weighted and placed in cages for the molting procedure. Eight days later; the hens were slaughtered and labeled as the food deprived group or molting (M). The remaining 20 hens were fed for 37 days, reached their maximum egg production, were weighed hormonel slaughtered and labeled as the post-molting group (PM).
Chemicals
All chemicals were purchased from Sigma Chemical Company (St. Louis, MO, USA).
Forced Molting Procedure
of the molting program, when they had lost 25% of their live weight, we stopped giving them marble powder. These eight chickens that were starved, were slaughtered and blood and tissue samples were taken (M: molting group). The other 20 hens were feed respectively with cracked wheat from the first to the fourth days as 25-50-75-100 g/per hen. In the fifth day all hens were feed with chicken growing feed until reaching 5% of egg production or the 25th day of the
molting program with 14 hours of light per day. Egg starting feed was begun and given to all the animals until the 36th day or when 50% of egg production
was reached and in the meantime vitamins A, D, E, C and K were added to their water. Hens were fed with laying feed with 17 hours of light per day until they reached maximum egg production at the 45th day of
the trails, then all hens (PM: post molting group) were slaughtered and blood and tissue samples were taken for biochemical analysis.
Biochemical Analysis
Blood samples were taken by head cutting, collect-ed into heparinizcollect-ed tubes and immcollect-ediately an MDA (Slater 1984; Sushil et al. 1989) and GSH (Beutler et al.
1963; Rizzi et al. 1988) analysis was done from all the
blood. The remaining blood samples were centrifuged at 200 x g for 10 minutes, plasma was separated and kept in a deep-freezer until the analysis (-24ºC). At the time of analysis the plasma was thawed and glucose, Ca, P, albumin, globulin, total protein, T3 and T4 analysis was done by an autoanalyzer (Roche, Abbott). Plasma vitamin C (Omaye et al. 1979) and CAT (Goth, 1991) analysis was also done with the appropiate techniques as cited. After slaughtering the hens, their livers and ovariums were weighed, and thyroid weight and thy-roid length were recorded. The liver and thythy-roid tissue samples were analyzed for MDA (Xia, 1994; Marklund, 1990)and GSH (Ball, 1966; Fernandez & Videla,1981).
Histopathological Analysis
The middle portion of the liver, ovarium and thyroid tissues were removed and immediately half of them were embedded into a 10% formalin solution for 48h. After dehydration in a graded ethanol series and clearing with xylene, the sample material was embedded in paraffin. Paraffin blocks were prepared and 5 μm-thin sections were sliced using microtome (LEICA RM2255), then the sections were stained with a Hematoxylin-Eosin (HXE) stain for observation under the light microscope and were examined and photographed using an Olympus BX51 light microscope.
Statistical Analysis
Statistical analysis was done by one-way analysis of variance (ANOVA) using SPSS software package, version 20.00. Post-hoc Tukey’s test was used to compare the studied parameters between the groups, p values <0.05 were considered as significant.
RESULTS
The body, liver, ovarium, thyroid weight and thyroid length changes in the three groups are shown in Table1.
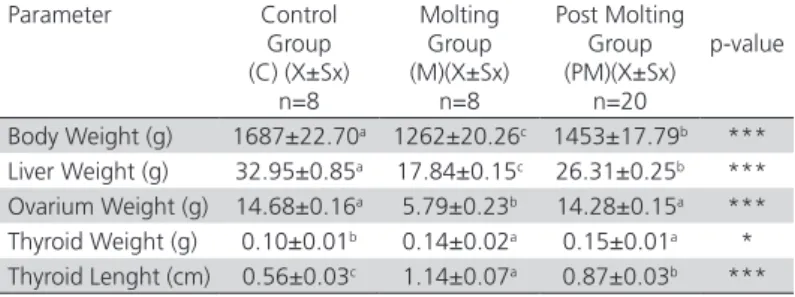
Table 1 – The body weight, liver, ovarium, thyroid weight and thyroid length of hens in the control (C), molting (M) and post molting (PM) groups
Parameter Control Group (C) (X±Sx)
n=8
Molting Group (M)(X±Sx) n=8
Post Molting Group (PM)(X±Sx)
n=20
p-value
Body Weight (g) 1687±22.70a 1262±20.26c 1453±17.79b ***
Liver Weight (g) 32.95±0.85a 17.84±0.15c 26.31±0.25b ***
Ovarium Weight (g) 14.68±0.16a 5.79±0.23b 14.28±0.15a ***
Thyroid Weight (g) 0.10±0.01b 0.14±0.02a 0.15±0.01a *
Thyroid Lenght (cm) 0.56±0.03c 1.14±0.07a 0.87±0.03b ***
Different letters in the same line are important (*p<0.05, **p<0.01, ***p<0.001), a,b,c
superscripts in the same row indicate significant differences between groups.
Weight and feather loss were observed in the forced molting hens. The liver and ovarium weights decreased, but the thyroid was enlarged when the macroscopic and absolute examination of organs was performed. Thyroid weight and length increased significantly in the molting and post molting group, but not in the control group.
In the Table 2-3 the blood, liver and thyroid tissues levels of MDA, GSH, plasma glucose, Ca, P, albumin,
Table 2 – Blood, liver and thyroid tissues levels of MDA and GSH of hens in the control (C), molting (M) and post molting (PM) groups.
Parameter Control Group (C) (X±Sx)
n=8
Molting Group (X±Sx) (M)
n=8
Post Molting Group (PM)(X±Sx)
n=20
p-value
Blood MDA (nmol/L)
0.94±0.13a 2.10±0.27b 2.01±0.27a *
Liver MDA (nmol/g)
1.29±0.02a 1.39±0.03a 1.22±0.02b ***
Thyroid MDA (nmol/g)
393.17±8.08a 371.99±14.40b 408.82±7.49a *
Blood GSH (mg/dL)
324.29±17.09a 354.53±16.57a 27.58±4.79b ***
Liver GSH (μmol/g)
0.18±0.05b 0.16±0.02b 0.66±0.13a **
Thyroid GSH (μmol/g)
4.59±0.59a 3.52±0.63a 4.04±0.46a NS
globulin, total protein (TP), T3 , T4, Vitamin C and CAT are shown.
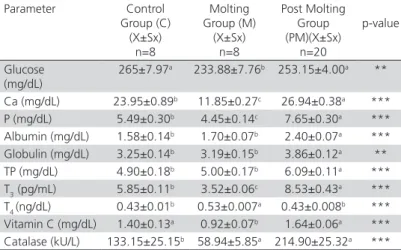
Table 3 – Plasma glucose, Ca, P, albumin, globulin, TP, T3, T4, Vitamin C and catalase of hens in the control (C), molting (M) and post molting (PM) groups.
Parameter Control Group (C) (X±Sx)
n=8
Molting Group (M) (X±Sx)
n=8
Post Molting Group (PM)(X±Sx)
n=20
p-value
Glucose (mg/dL)
265±7.97a 233.88±7.76b 253.15±4.00a **
Ca (mg/dL) 23.95±0.89b 11.85±0.27c 26.94±0.38a ***
P (mg/dL) 5.49±0.30b 4.45±0.14c 7.65±0.30a ***
Albumin (mg/dL) 1.58±0.14b 1.70±0.07b 2.40±0.07a ***
Globulin (mg/dL) 3.25±0.14b 3.19±0.15b 3.86±0.12a **
TP (mg/dL) 4.90±0.18b 5.00±0.17b 6.09±0.11a ***
T3 (pg/mL) 5.85±0.11
b 3.52±0.06c 8.53±0.43a ***
T4 (ng/dL) 0.43±0.01b 0.53±0.007a 0.43±0.008b ***
Vitamin C (mg/dL) 1.40±0.13a 0.92±0.07b 1.64±0.06a ***
Catalase (kU/L) 133.15±25.15b 58.94±5.85a 214.90±25.32a ***
Different letters in the same line are important (*p<0.05, ** p<0.01, *** p<0.001).
a,b,c superscripts in the same row indicate significant differences between groups.
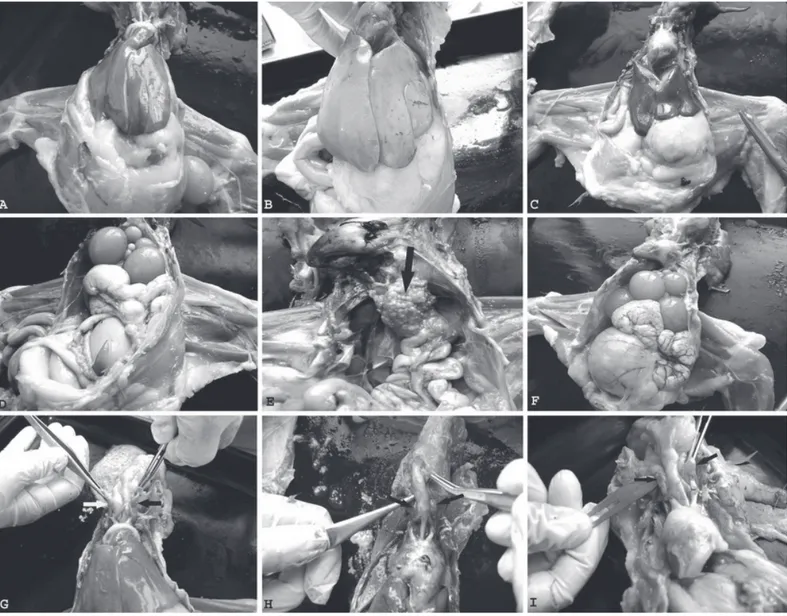
Macroscopically findings (Fig. 1) and microscopically examined sections (Fig. 2) showed the histopathological architecture of the liver, ovarium and thyroid tissues in hens. The liver had a normal apperance in the C and PM group (Fig. 1-A,C) but liver looked pale, roundness in the edges of liver lobes were observed and there was a slightly growth in the molting group (Fig. 1. B). The ovarium had a lot of mature follicles in the C and PM group (Fig. 1- D, F), but we didn’t find any follicles in the molting group (Fig. 1-E). The thyroid was enlarged when the macroscopic and absolute examination in the molting and post molting group compaired with the control group (Fig. 1-H,I).
The liver had a normal histological appearance in the control group (Fig. 2-A). The liver tissue of molting group had hyperemia, sinusoidal dilatation and severe degeneration (hydrophic degeneration) (Fig. 2-B). The liver tissue of post molting group had slightly hyperemia and a few degeneration of hepatocytes (Fig. 2-C).
The ovarium (Fig. 2-D,F) and thyroid (Fig. 2-G,I) had a normal histological apperance in the control group and post molting group. The ovarium had the lower primer, seconder and tertier follicles; and connective tissue increased in the interstitium are shown in the molting group (Fig. 2-E). In the molting group the concentration of colloidal secretion increased and lumen dilatition formed (Fig. 2-H).
DISCUSSION
At the end of 12–15 months of egg production, commercial egg laying hens lost their economical values, then new hens or hens after a forced molting
program can be used to extend the economical life of the herd (North & Bell, 1990). Low egg prices, the prices of large eggs and high costs of chichen growth are the main advantages of forced molting. Forced molting reduces the share of chicken cost in the total chicken egg production expenditure (Erensayin, 1992; Senkoylu, 1995).
The weight loss and then regaining of the lost weight during the forced molting program is called regeneration and rejuvenation (Decuypere & Verheyen, 1986; Decuypere et al. 2005). In the fasting period,
up to a 30% increase in weight loss causes a decrease in egg production and egg shell quality (Baker, 1981; Hazan & Yalçın, 1985). Complete cessation of egg
production at the end of the fasting period proves the stopping of ovarial activity (Garlich, 1984).
One of the negative effects of forced molting is body weight loss. The average live weight of laying hens, decreased 25% at the 8th day of the molting program
but after normal feed and water were given to the hen´s average weights approached the previous levels. The liver and ovarium also decreased during molting and the size of the thyroid was enlarged. The weight of the thyroid gland was higher in the molting and post molting group than in the control group (p<0.05). The lengths of the thyroid increased during molting but decreased in the post- molting period. These changes are due to an increase of colloidal liquid in the thyroid (Bostanci, 1979; Brake et al. 1979).
In chickens, ovarian and oviductal regression was achieved through apoptosis (Heryanto et al., 1997). Increased expression of these two proinflammatory cytokines, from the first day of molting suggests their role in the initiation of apoptosis. Yoshimura
et al. (1997) and Sundaresan et al. (2006) reported
similarly findings, stained sections of ovarium were also analyzed histologically for atrophic changes in the regressing ovarium of chickens during molting.
Stress factors like starvation, low and high heat hormon increase the lipid peroxidation in animals. Here, the MDA values of the 3 groups are shown in Table 4 and significant increases were determined during molting and then slightly decreased in the egg laying period. These changes are statistically important (p< 0.05). Szabo et al. (2005) found a significant decrease of liver weight and crude fat during absolute and relative long term starvation. The amount of MDA increased by membrane lipid degredation.
Decrease in antioxidant levels in living organisms cause an increase in lipid peroxidation septic shock, organ function disorders, malnutrition and food deficiencies result with decreased tissue GSH levels. In these cases tissue damage was increased by lipid peroxidation or oxidants (Robinson et al.1997).
The liver plays an important role in GSH homeostasis and the stress hormon stimulates the secretion of GSH from liver. During stress conditions, depending on the release, the hepatic GSH level decreases and the blood GSH level increases (Mahmoud & Edens, 2003). This was also observed in the presented study. The liver GSH levels decreased but blood GSH level increased during the molting program. Song et al. (2000) evalueted that GSH mobilization from the liver pool causes an increase of blood GSH.
The level of thyroidal GSH decreased like the extra and hepatic amount when stress factors were
introduced. However, it reached normal values when the hen began egg production.
The catalase activity reaches high levels during regular feeding but during the food restriction of starvation program CAT levels decreased (Pascual et al.
2003). Indeed, in this study the CAT levels were low during molting (food restriction-thirsty) as the result of the elimination of H2O2 produced stress, in the post molting or egg laying period it began to rise again to normal levels (p<0.001).
Brake et al.(1981) reported decreased serum glucose
concentration during the molting period. Brake and Thaxton (1979) applied two different heat programs to hens in molting at different ages and found no significant changes in plasma glucose levels which suggest that a complex hormonal mechanism may be involved in the regulations. Differences in glucose between the three groups were found statistically important (p<0.01).
Glucose and catalase protect cells against oxidative changes. Because glycolytic and pentose phosphate pathways use glucose, it leads to redox imbalances, an accumulation of endogen peroxides cells which are sensitive to peroxides. It is well known that their increased oxidant substances cause cell death. As a result, glucose indirectly regulates pentose phosphate activity and GSH/GSSG ratios and is a good metabolite for cellular antioxidant defense.
Brake and Thaxton (1979) found that plasma, Ca and P levels in the premolting period as 22mg/dL and 3.8 mg/dL respectively. Ca levels decreased to 7 mg/ dL during molting. Garlich et al.(1984), also determined
Ca and P levels in pre molting as 27.5–6.04 mg/dL. They found significant decreases in the levels of Ca and P to be 6.9–4.43 mg/dL respectively. Gildersleeve
et al. (1983) found the Ca and P levels in the control
Albumin levels in 2-8 week old chickens were determined as 12.3-13.9 g/L (Sreemannarayana et al. 1989), in 42 days old chickens 14.2 g/L (Bowes et al. 1989) and Gildersleeve et al. (1983) found serum
albumin levels as 2.5 mg/dL. Some other reports also supported the high albumin levels. Egg production and genetic variations could affect these differences (Poyraz et al. 1988). In this study the average
concentration of albumin increased in the molting and post molting groups, more than in the control group. These differences are statistically important (p<0.001).
The globulin levels were significantly affected by the fasting program but increased significantly after molting (p<0.01) Table 2. Total protein levels also increased (p<0.001) and this could be due to increased protein synthesis and this finding was in accordance with Gildersleeve et al.(1983).
The increase of T4 is not dependable on the increases of TSH secretion during fasting (Van Der Geyten et al.
1999). Hoshino et al. (1988) reported increased T
4
levels during the beginning of the 8 days starvation and 2 days thirst program and then reached normal levels when laying. In the presented study T3 and T4 levels were measured at every stage and discussed. The decreased T3 and increased T4 levels were found during molting. The growth of feather, regression of ovarium and increased metabolic activity during molting could be the main causes for thyroidal changes.
The Vitamin C levels were affected by various factors such as stress, disease, feed, consuption and season. In the present study the plasma Vitamin C levels decreased during molting and increased when the hens began normal feeding. Changes between the 3 groups were found statistically important p<0.001.
As a result, the molting process causes stress in laying hens, affects the oxidant/antioxidant status; changes the sizes of the organs and their weights; changes the hormone´s profile of the thyroid as T3 decrease and T4 increase; decreases the concentration of plasma, Ca and P, protein fractions, tissue and blood antioxidant levels; decreases blood glucose and increases lipid peroxidation. The activities of thyroid MDA, liver GSH and plasma CAT were significantly decreased in the molting group compared to the control values, while liver MDA levels were significantly increased and thyroid GSH levels had non-significant effects. It was presented here, that the liver and thyroid tissue levels of MDA, GSH and plasma CAT were the first reports in scientific literature of the forced molting processes. Molting has economical profitability for enterprizes but has side-effects too. Despite all the disadvantages,
regeneration of organs, quality increases of the egg shell and egg, increased economical income and contributions to public health diets, the adverse effects of molting can be ignored.
ACKNOWLEDGEMENTS
The authors wish to thank the Department of Phatology (YYU Veterinary Faculty, VAN) and BAYTAV Egg Production and Marketing Limited Company (VAN) for supporting this study.
REFERENCES
Akkan AG. Vitaminler, İÜ. Cerrahpaşa tıp fakültesi sürekli tıp eğitim etkinlikleri. İstanbul: Cerrahpaşa Tıp Fakültesi;1999.
Baker M, Brake J, Krista M. Total body lipid and uterine lipid changes during a forced molt of caged layers. Poultry Science 1981;60:1593.
Ball CR. Estimation and identification of thiols in rat spleen after cysteine or glutathione treatment: relevance to protection against nitrojen mustards. Biochemical Pharmacology 1966;15:809-816.
Beşeoğlu N. Serum proteinlerinin iki boyutlu elektroforez ile ayrılması. Istambul: Sağlık Bilimleri Enstitüsü Biyofizik Anabilim Dalı Yüksek Lisans Tezi; 2002.
Beutler E, Duran O, Kelly BM. Improved method fort the determination of blood glutathione. Journal of Laboratory and Clinical Medicine 1963;61(5):882-888.
Bostancı AN. Tiroid ve Paratiroid Hastalıkları, Endokrinoloji–11. Bozak Matbaası 1979;(1):249.
Bowes VA, Julian RJ, Stirtzinger T. Comparison of serum biochemical profiles of male broilers with female broilers and White Leghorn chickens. Canadian Journal of Veterinary Research 1989;53:711.
Brake J, Garlich JD, Carter JA. Relationship of dietary calcium level during the prelay phase of an induced molt to postmolt performance. Poultry Science 1984;63:2497-2588.
Brake J, Garlich JD, Parkhurst CR, Thaxton P, Morgan GW. Physiological profile of caged layers during one production season, molt and postmolt: Organ weights and blood constituents. Poultry Science 1981;60:2157-2160.
Brake J, Thaxton P. Physiological changes in caged layers during a forced molt. 1-Body temperature and selected blood constituents. Poultry Science 1979;58:699-706.
Brake J, Thaxton P, Benton EH. Physiological changes in caged layers during a forced molt. 3- Plasma thyroxine, plasma triiodothyronine, adrenal cholesterol and total adrenal steroids. Poultry Science 1979;58:1345-1350.
Brown RE. Infection of nutrition and infection in clinical practice. Pediatric Clinics of North America 1997;24:241–251.
Decuypere E, Van As P, Van Der Geyten S, Darras VM. Thyroid hormone availability and activity in avian species: a review. Domestic Animal Endocrinology 2005;29:63–77.
Decuypere E, Verheyen G. Physiolojical basis of induced moulting and tissue regeneration in fowls. World’s Poultry Science Journal 1986;42(1):56-68.
Fernandez V, Videla LA. Effect of acute and chronic ethanol ingestion on the content of reduced glutathione of varios tissues of the rat. Experientia 1981;37:392-394.
Garlich JD, Brake J, Parkhurst CR, Thaxton JP, Morgan GW. Physiolojical prophile of caged layers during one production year molt and postmolt: Egg production, egg shell quality, liver, femur and blood parameters. Poultry Science 1984;63:339-343.
Gilbert AB. Transport of fhe egg trough the oviduct and oviposition. In: Bill DJ, Freeman BM. Physiology and biochemistry of the domestic fowl. London: Academic Press; 1971. p.1345–1350.
Gildersleeve RP, Satterlee DG, Johnson WA, Scott TR. The effect of forced molt treatment on selected steroids in hens. Poultry Science 1982;6:2362-2369.
Gildersleeve RP, Satterlee DG, Johnson WA, Scott TR. The effects of forced molt treatment on blood biochemicals in hens. Poultry Science 1983;62:755-762.
Goth L. A simple method for determenation of serum catalase activity and revision of serum catalase activity and revision of reference range. Clinica Chimica Acta 1991;196:143-152.
Guyer RB, Grunder AA, Buss EG, Clagett CO. Calcium-binding proteins in serum of chickens: Vitellogenin and albumin. Poultry Science 1980;59:874-879.
Halliwell B, Gutteridge JMC. The important of free radicals and catalytic metal ions in human disease. Molecular Aspects of Medicine 1985;8:89-91.
Hazan A, Yalçın S. Effect of body weight loss and feeding regimen on the performance of molted breeder layers. British Poultry Science 1988;29;513-520.
Heryanto B, Yoshimura Y, Tamura T, Okamoto T. Involvement of apoptosis and lysosomal hydrolase activity in the oviducal regression during induced molting in chickens: a cytochemical study for end labeling of fragmented DNA and acid phosphatase. Poultry Science 1997;76:67– 72.
Hoshino S, Suzuki M, Kakegawa T, Imai K, Wakita M, Kobayashi Y, et al. Changes in plasma thyroid hormones, luteinizing hormone (LH), estradiol, progesterone and corticosterone of laying hens during a forced molt. Comparative Biochemistry and Physiology 1988;90(2):355–359.
Hudson DA, Levin RJ, Smith DH. Absorption from the alimentary tract In: Bell DJ, Freeman BM. Physiology and biochemistry of fhe domestic fowl. New York: Academic Press; 1971. p.52–71 .
Johnson AL, Bridgham JT, Witty JP, Tilly JL. Susceptibility of avian ovarian granulosa cells to apoptosis is dependent upon stage of follicle development and is related to endogenous levels of bc1-xlong gene expression. Endocrinology 1996;137:2059-2066.
Kramer JW. Clinical enzymology. In: Kaneko JJ. Clinical biochemistry of domestic animals. 3rd ed. New York: Academic Press; 1980. p.183–186.
Mahmoud ZK, Edens FW. Influence of selenium sources on age-related and mild heat stress-related changes of blood and liver glutathione redox cycle in broiler chickens (Gallus domesticus). Comparative Biochemistry and Physiology 2003;136(4):921–934.
Marklund SL. Analysis of ekstracellular superoxide dismutase in tissue homogenates and ekstracellular fluids. Methods in Enzymology 1990;186:260–265.
Martin DW, Mayes PA, Rothbell VW. Harper’s rewiev of biochemistry. 18th ed. Tokyo: Maruzen; 1981.
Mert N. Veteriner klinik biyokimya. Bursa: U.Ü. Vet Fak; 1996. p.151–153.
North MO, Bell DD. Commercial chicken production manual. 4th ed. New York: Chapman & Hall; 1990.
Omaye ST, Turbul JD, Savberlich HE. Ascorbic acid analyses. II. determination after derivation with 2,2 dinitrophenylhidrazine, selected methods for determination of ascorbic acid in animal cell, tissues and fluids. Methods Enzymology1979;62:7–8.
Ozen N. Tavukçuluk. Samsun: 19 Mayıs Üniversitesi Yayınları; 1986.
Park SY, Birhold SG, Kubena LF, Nisbet, DJ, Ricke, SC. Effects of high zinc diets using zinc propionate on molt induction, organs and postmolt egg production and quality in laying hens. Poultry Science 2004;83:24-33.
Pascual P, Pedrajas JR, Toribio F, López-Barea J, Peinado J. Effect of food deprivation on oxidative stress biomarkers in fish (Sparus aurata). Chemical Biological Interactions 2003;145:191–199.
Poyraz O, Iscan K, Ozcan I. Etçi damızlıklarda zorlamalı tüy dökümü yöntemleri üzerine bir araştırma. Lalahan Hay Arast Enst Derg 1988;28:13-23.
Rizzi R, Caroli A, Bolla P, Acciailoi A, Pagnacco G. Variability of reduced glutathione levels in massese ewes and its effect on daily milk 55. Production. Journal of Dairy Research 1988;345-353.
Robinson MK, Rustum RR, Chmbers EA, Rounds JD, Wilmore DW, Jacobs DO. Starvation enhances hepatic free radical release following endotoxemia. Journal Surgical Research 1997;69: 325-330.
Roland DA, Brake J. Influence of premolt production on postmolt performance with explanation for improvement in egg production due to force moulting. Poultry Science 1982;61:2473-2481.
Slater TF. Overwiev of methods used for detecting lipid peroxidation. Methods in Enzymology 1984;105:283-305.
Song Z, Cawthon D, Beers K, Bottje WG. Hepatic and extra-hepatic stimulation of glutathione release into plasma by norepinephrine in vivo. Poultry Science 2000;79:1632–1639.
Sreemannarayana O, Marquardt RR, Frohlich AA, Guenter W. Enzyme activities, protein, metabolites and electrolyte concentrations in the serum of single comp white leghorn chickens. Indian Veterinary Journal 1989;66:435-440.
Sundaresan NR, Anish D, Sastry KVY, Saxena VK, Mohan J, Ahmed KA. Cytokines in reproductive remodeling of molting White Leghorn hens. Journal of Reproductive Immunology 2006;73:39-50.
Sushil JK, Mcvie R, Duett J, Herbst JJ. Erytrocyte membrane lipid peroksidation and glycosylated hemoglobin in diabetes. Diabetes 1989;38:1539-1543.
Szabo A, Fébel M, Mézes M, Horn P, Balogh K, Romvári R. Differential utilization of hepatic and myocardial fatty acids during forced molt of laying hens. Poultry Science 2005;84:106–112.
Senkoylu N. Modern tavuk uretimi. Istanbul: Anadolu Matbaa; 1995. p.247–257.
Tezelman ST, Siperstein AE. Signal transduction in thyroid neoplasms. In: Clark OH, Duh QY. Textbook of endocrine surgery. Philadelphia: WB Saunders; 1997. v.28, p.214-227.
Van Der Geyten S, Van Rompaey E, Sanders JP, Visser TJ, Kühn ER, Darras VM. Regulation of thyroid hormone metabolism during fasting and refeeding in chicken. General and Comparative Endocrinology 1999;116:272-280.
Xia E, Rao G, Remmen HV, Heydari AR, Richardson A. Activities of antioxidant enzymes in various tissues of male Fischer 344 Rats are altered by food restriction. Journal of Nutrition 1994;125:195-201.
Yalcın SA. Antioksidanlar. Klinik Gelisim 1998;11:342–346.
Yoshimura Y, Heryanto B, Tamura T. Changes in the population of proliferating cells in chicken anterior pituitary during induced molting: an immunocytochemical analysis for proliferating cell nuclear antigen. Poultry Science 1997;76:1569–1573.
Yoshimura Y, Tamura T. Histological and histochemical observation on the atretic follicles induced by adenohypophysectomy in the hen. Japanese Poultry Science 1985;22:134–141.