Tel.: (12) 3625-4212
Changes in rainfall patterns in the eastern area of La Pampa province,
Argentina
(http://dx.doi.org/10.4136/ambi-agua.692)
Silvia Pérez; Eduardo Sierra
Faculty of Agronomy, University of Buenos Aires, Buenos Aires, Argentina e-mail: [email protected]; [email protected]
ABSTRACT
The eastern area of the Province of La Pampa, Argentina lies in a transition zone between the humid temperate climate stretching east and the steppe climate stretching west. The area is very sensitive to changes in precipitation patterns, especially when changes are sudden and there is no time to take adaptive measures to cope with the impacts of climate change. In such cases, agricultural production and the balance of the environment are threatened by potential disaster. In order to determine the long-term occurrence of such phenomena, long-term annual precipitation series (1921–2009) from 14 stations in the study area were analyzed using the procedure of hydrometeorological series segmentation. The results for the study period show a succession of abrupt increases, with annual precipitation increasing by about 30%. Each increase in rainfall can be seen as a fostering factor for the expansion of crop planted area in the following years. However, in recent years, there has been an abrupt and significant decrease in precipitation with a marked return to the conditions that prevailed at the beginning of the period. Because agriculture intensified during the period of increased rainfall, the carrying capacity of the environment could be exceeded if rainfall continues to decrease over a long period of time, causing a decline in production accompanied by environmental degradation.
Keywords: Agroclimatology; climatological time series; shift in the mean.
Mudanças no regime de precipitações do este do município La Pampa,
Argentina
RESUMO
significativamente a precipitação com um retorno marcado para as condições que prevaleceram no início do período analisado. Devido à expansão da agricultura observada no período de incremento das chuvas e, posteriormente, a diminuição dessas chuvas durante um longo período, poderia resultar na queda da produtividade e resultar em uma deterioração ambiental.
Palavras-chave: Agroclimatologia; série climatológica de tempo; mudanças na precipitação.
1. INTRODUCTION
Rainfall variability for different regions of South America has been studied by several authors. Garreaud and Aceituno (2001) studied interannual rainfall variability over the South America Altiplano. Paegle and Mo (2002) invested linkage between summer rainfall variability over South America and sea surface temperature anomalies. Pasquini et al. (2006) with statistical and spectral analysis show that there is significant evidence that rainfall has increased in central Argentina since the 2nd half of the 20th century. De la Casa and Nasello (2010) analyzed breakpoints in annual rainfall trends in Córdoba, Argentina in the period 1930-2006, they observed from negative to positive in the 1950s in the north area of the region, while in the other areas the opposite change occurs in the 1970s. More recently Junquas et al. (2011) studied summer precipitation variability over Southeastern South America in a global warming scenario.
According to Köppen’s climatic classification as modified by Trewartha (Köppen, 1948; Trewartha, 1968), the western border of Argentina's agricultural area is located in a transition zone between the humid temperate climate (C), which extends eastward, and the steppe climate (BS), which extends westward. For this reason, the agricultural economy of the area is vulnerable to changes in water regime. Changes can produce strong positive or negative impacts on agricultural production (Viglizzo et al., 1995, 1997, 2001; Viglizzo and Frank, 2006).
From the mid 1970s, a sharp increase in rainfall regime provided most of the area with a supply of moisture higher than previously reported (Sierra et al., 1994; Pérez et al., 1999; Forte Lay et al., 2008; Pérez et al., 2011). This led to a strong increase in agricultural activity (Sierra et al., 1995; Solbrig and Viglizzo, 1999; Bernardos et al., 2001; Viglizzo et al., 1995, 1997, 2002, 2003; Manuel-Navarrete et al., 2009).
However, in recent years, the area has suffered from a marked recurrence of drought, which has seriously affected farming (Earth Observatory, 2009; WMO, 2009). Minetti et al. (2003) noted that severe droughts associated with La Niña during the periods 1988-1989 and 1995-1996 had reversed the rainfall trend over much of Argentina. The gradual increase in rainfall during the second half of the twentieth century has given way to a gradual decrease in rainfall during the early years of the 21st century.
This paper examines changes in annual precipitation in the eastern area of the Province of La Pampa during the period 1921-2009. It assesses the alternation of wet and dry periods and considers whether transitions between periods allow sufficient time for adaptive adjustments or whether transitions are so abrupt that severe impacts are almost unavoidable.
2. MATERIAL AND METHODS
2.1. Data
of Agricultural Technology (INTA) and the Directorate General of Statistics and Censuses (DGEyC) of the Province of La Pampa. The tests were applied to series of annual values obtained by adding together the monthly values for each year.
Table 1. Rain gauges geographical informations.
Locality Latitude
(S)
Longitude
(W)
Altitude
(msl)
Sub
zone
Origin of
the data
Intendente Alvear 35° 14´ 63° 35´ 123 North DGEyCa
Eduardo Castex 35° 53´ 64° 17´ 171 North DGEyCa
Conhello 36° 01´ 64° 35´ 201 North DGEyCa
Rucanelo 36° 02´ 64° 49´ 244 North DGEyCa
Catrilo 36° 26´ 63° 24´ 113 Center DGEyCa
Lonquimay 36° 28´ 63° 37´ 136 Center DGEyCa
Anguil 36° 31´ 64° 01´ 152 Center INTAb
Santa Rosa 36° 37´ 64° 16´ 175 Center SMNc
Macachín 37° 08´ 63° 38´ 130 Center DGEyCa
Doblas 37° 08´ 64° 01´ 157 Center DGEyCa
Perú 37° 37´ 64° 09´ 200 South DGEyCa
Guatraché 37° 40´ 63° 32´ 169 South DGEyCa
Bernasconi 37° 54´ 63° 43´ 162 South DGEyCa
Gral San Martín 37° 58´ 63° 34´ 164 South DGEyCa
a
DGEyC Directorate General of Statistics and Censuses, b
INTA National Institute of Agricultural Technology,
c
SMN National Weather Service
2.2. Quality Control
The data from the 14 selected locations was subjected to a process of quality control in order to control for possible errors.
All data above the third quartile plus three times the interquartile range and located more than five standard deviations from the mean was treated as outliers. These outliers were then contrasted climatographically with readings from nearby stations. If the same reading was labeled as out of range for more than two seasons, the value was considered to be correct.
Months classed as outliers and those without data were treated as gaps. Both types of gaps were filled but no missing data was completed if there were more than three gaps in one year. The missing data were estimated from the records of the nearest stations taking into account the correlation coefficient between the various observation posts on a monthly basis.
2.3. Homogeneity Test
The homogeneity of the precipitation series was tested by Alexandersson and Moberg’s (1997) Standard Normal Homogeneity Test (SNHT). For this purpose we used AnClim software (Štĕpánek, 2006).
We used the series from the National Weather Service’ recording station in Santa Rosa as a reference series because it is part of the network of stations reporting daily to the World Meteorological Organization (WMO ID No. 87623).
The SNHT was applied to each of the remaining series. A series of ratios 𝑞i 𝑖𝑁=1 were
estimated between the observed value of the series to which the test was applied and the value of the reference station. The standardized set of ratios 𝑧i 𝑖𝑁=1 was estimated for which
𝑧i = (𝑞i - 𝑞i )/Sq [1]
where 𝑞i and Sq are the mean and sample standard deviation of the series qi,
Let 1 ≤ 𝑣 <𝑁 and 𝜇1≠𝜇2 where N is the number of years of data available,
The aim is to test the null hypothesis: 𝐻0:𝑧𝑖~𝑁 0,1 ∀𝑖
Against the alternative hypothesis: 𝐻1:𝑧𝑖~𝑁 µ1, 1 𝑖 ≤ 𝑣 𝐻1:𝑧𝑖~𝑁 𝜇2, 1 𝑖>𝑣
The null hypothesis states that the average of the standardized set zi does not change over
time, while the alternative hypothesis states that for a time period ν there is a shift in the mean of the series.
The test statistic to determine whether a shift has occurred in the mean of the series zi is
𝑇0 = max1≤𝑣<𝑁 𝑇𝑣 [2]
where
[3]
𝑧1 and 𝑧2 are the sample means of the first νand last (N−ν) values of the serieszi. If T0 is greater than some
critical level for a given level of significance of the test, we can reject the null hypothesis which states that the series is homogeneous. According to Alexandersson (1986), the critical values for the test at significance level
2.4. Detecting shifts in the mean
In order to detect shifts in mean annual precipitation we used Hubert’s method of segmentation of hydrometeorological time series (Hubert et al., 1989). This method divides the series into m segments (m > 1) so that the calculated mean over the entire series is significantly different from the means of neighboring segments.
Segmentation is defined as follows: Any series xi, i = i1, i2 with i1 ≥ 1 and i2≤ N where
(i1 < i2) is a segment of the initial series of (xi), I = 1, … , N
Any division of the initial series into m segments is an m-order segmentation of this series.
Thus, from a particular m-order segmentation of the initial series, we define:
𝑖𝑘,𝑘= 1,2,…,𝑚
𝑛𝑘=𝑖𝑘− 𝑖𝑘−1
𝑥𝑘 = 𝑖𝑖==𝑖𝑖𝑘𝑘−1+1𝑥𝑖 /𝑛𝑘 [4]
𝐷𝑚 = 𝑘𝑘==1𝑚𝑑𝑘 with 𝑑𝑘 = 𝑖 𝑥𝑖− 𝑥𝑘 2
=𝑖𝑘
𝑖=𝑖𝑘−1+1 [5]
The segmentation obtained should be such that for a given segment order m, the standard deviation Dm is minimal. This is a necessary but not a sufficient condition to determine the
optimal segmentation. It should be noted that the means of two adjacent segments must be significantly different. This constraint is met by applying the Scheffé test (Dagnélie, 1970).
3. RESULTS AND DISCUSSION
3.1. Homogeneity test
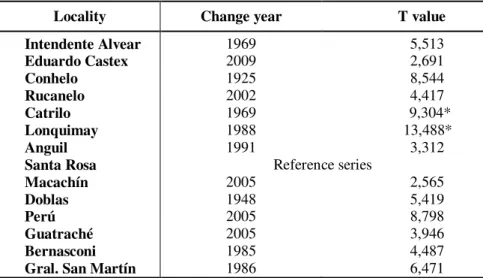
Twelve of the available annual rainfall series (Table 2) showed a T value smaller than the critical value (Alexandersson, 1986) and can be considered homogeneous at the level of significance α = 0,05. The other two series had T values greater than the critical value and were thus considered non- homogeneous. These were eliminated from the analysis.
Table 2. Test results of the Standard Normal Homogeneity Test applied to annual precipitation series from towns in the Province of La Pampa, and the series from the Santa Rosa station are used as a reference.
Locality Change year T value
Intendente Alvear 1969 5,513
Eduardo Castex 2009 2,691
Conhelo 1925 8,544
Rucanelo 2002 4,417
Catrilo 1969 9,304*
Lonquimay 1988 13,488*
Anguil 1991 3,312
Santa Rosa Reference series
Macachín 2005 2,565
Doblas 1948 5,419
Perú 2005 8,798
Guatraché 2005 3,946
Bernasconi 1985 4,487
Gral. San Martín 1986 6,471
3.2. Hubert’s Hydrometeorological Time Series Segmentation
Area and sub area means for annual precipitation series in the eastern area of the Province of La Pampa by Hubert’s segmentation method (Hubert et al., 1989) are detailed in Table 3.
Table 3. Segmentation of the annual precipitation series for the northern, central, and southern sub-areas of the eastern area of the Province of La Pampa
by Hubert’s segmentation method (Hubert et al., 1989).
Sub area Sub-period Mean
Standard deviation
Coefficient of Variation
North 1921-1971 596,6 133,8 22,4
1972-1998 813,9 148,3 18,2
1999-2001 1179,1 189,5 16,1
2002-2009 657,1 199,6 30,4
Center 1921-1975 583,5 151,3 25,9
1976-2000 788,4 177,5 22,5
2001-2001 1400,0 0,0 0,0
2002-2009 608,6 193,4 31,8
South 1921-1975 544,7 141,2 25,9
1976-2004 728,5 184,6 25,3
2005-2009 420,4 137,8 32,8
Whole area 1921-1972 564,0 136,6 24,2
1973-1995 706,4 146,9 20,8
1996-2002 930,3 174,5 18,8
2003-2009 567,4 189,1 33,3
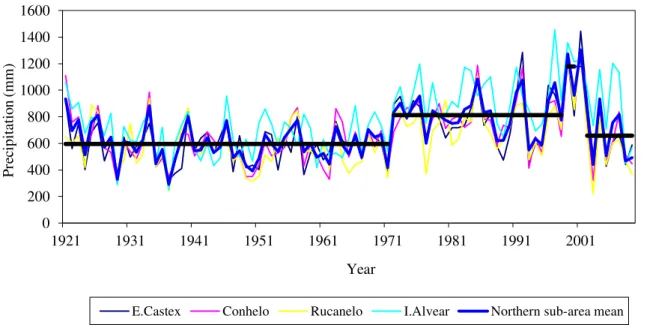
The behavior of localities in the northern sub-area was quite homogeneous (Figure 2), making the sub-area average representative of the ensemble.
Only Alvear seemed to show a slightly different behavior, but it was due to its higher rainfall average, and it showed the same abrupt changes as the other localities in the northern sub-area.
Figure 2. Annual precipitation and means for the sub-periods in the northern sub-area by
Hubert’s segmentation method.
The behavior of localities in the central sub-area was very homogeneous (Figure 3), making the sub-area average representative of the ensemble.
Although it showed the same abrupt changes than the other localities in the central sub-area, Doblas showed slightly more marked behavior, with higher increases in the positive changes, and greater decreases in the negative changes.
The central sub area showed two abrupt positive changes (Table 3 and Figure 3). The first of these brought average annual rainfall from 583,5 mm during the 1921-1975 sub-period to 788,4 mm during the 1976-2000 sub-period; the second change was an increase in annual rainfall to 1400 mm in 2001. After this brief wet spell, there was an abrupt negative change in 2002. This lowered the average annual rainfall to 608,6 mm, which is very similar to what it had been during the initial 1921-1975 period.
Figure 3. Annual precipitation and means for the sub-periods in the central sub-area by
Hubert’s segmentation method.
0 200 400 600 800 1000 1200 1400 1600
1921 1931 1941 1951 1961 1971 1981 1991 2001
Pr
ec
ipi
ta
ti
on
(m
m
)
Year
E.Castex Conhelo Rucanelo I.Alvear Northern sub-area mean
0 200 400 600 800 1000 1200 1400 1600 1800
1921 1931 1941 1951 1961 1971 1981 1991 2001
Pr
ec
ipi
ta
ti
on
(m
m
)
Year
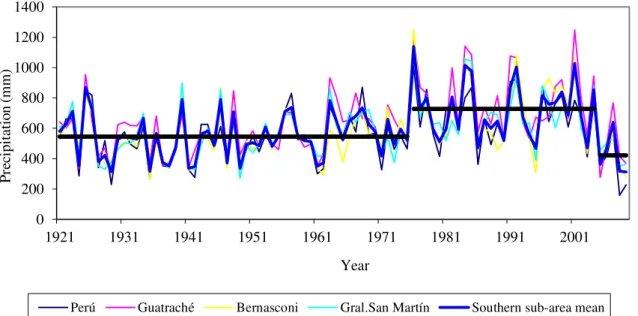
The behavior of localities in the southern sub-area was very homogeneous (Figure 4), making the sub-area average representative of the ensemble.
Although it showed the same abrupt changes than the other localities in the southern sub-area, Guatrache showed higher increases in the positive changes, while the decreases in the negative changes were less marked.
The southern sub-area showed two abrupt changes (Table 3 and Figure 4). The first was positive, with average annual rainfall rising from 544,7 mm during the sub-period 1921-1975, to 728,5 mm during the sub-period 1976-2004. The second abrupt change, which began in 2005, was negative. Here average annual rainfall fell to 420,4 mm, which is considerably lower than what it had been during the initial 1921-1975 period.
Figure 4. Annual precipitation and means for the sub-periods in the southern sub-area by
Hubert’s segmentation method.
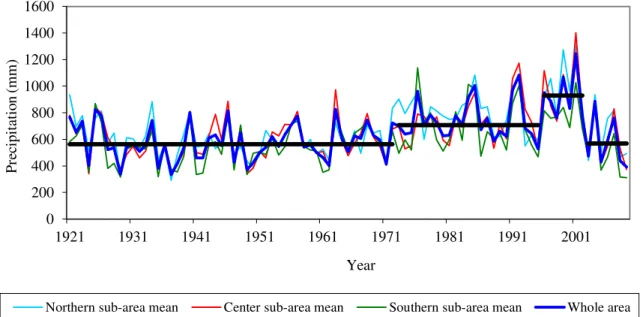
The average for the whole area (Table 3 and Figure 5) showed two successive abrupt positive changes. The first brought average annual precipitation from 564,0 mm during the 1921-1972 sub-period to 706,4 mm during the 1973-1995 sub-period. The second abrupt positive change raised average annual rainfall to 930,3 mm in the 1996-2002 sub-period. It is noteworthy that after this short wet sub-period of just six years, an abrupt negative change starting in 2003 reduced average annual rainfall to 567,4 mm, which is very similar to the average for the initial 1921-1972 period.
It can be seen that there were always one and sometimes two abrupt positive changes in all the different sub-areas, as well as two abrupt positive changes in the area average in the second half of the twentieth century. Average rainfall increased, favoring the expansion of agriculture (Sierra et al., 1995; Solbrig and Viglizzo, 1999; Bernardos et al., 2001; Viglizzo et al., 1995, 1997, 2002, 2003; Manuel-Navarrete et al., 2009).
The behavior of the sub-areas was quite homogeneous (Figure 5), making the whole area average representative of the ensemble.
Nevertheless some minor differences in the behavior of the sub-areas were observed: a)The northern sub-area showed higher increases in the positive changes, while the negative changes were of a lesser magnitude.
0 200 400 600 800 1000 1200 1400
1921 1931 1941 1951 1961 1971 1981 1991 2001
Pr
ec
ipi
ta
ti
on
(m
m
)
Year
Those differences show that abrupt changes are the most dangerous in the southern sub-area, where the range of the fluctuations is very marked. This was very evident during the drought which affected the whole area during the 2008/2009 season, causing great damage to crops and cattle.
Figure 5. Annual precipitation and means for the whole area and the sub areas during the
sub-periods by Hubert’s segmentation method.
In the early years of the 21st century, not only individual locations and sub areas but also the area as a whole showed abrupt negative changes in average annual rainfall with a return to levels similar to the initial values. Thus, although the agricultural aptitude of the land had previously increased, much of it has now been lost again, placing the production and the environment of the area at risk.
3.3. Possible causes of the as Pacific Decadal Oscillation (PDO) phenomena
The causes of abrupt changes in rainfall in the eastern area of the Province of La Pampa are possibly associated with a phenomenon known as Pacific Decadal Oscillation (PDO) (Mantua et al., 1997), which has a warm and a cold phase, each lasting about 30 years.
During the warm phase (positive values), the Low Level Jet (low-altitude air current) strengthens. This increases the supply of moist tropical air from the Atlantic Ocean to the South American continent (Vimeux et al., 2005; Vimeux et al., 2009; Garreaud et al., 2009), and causes a corresponding increase in precipitation.
Conversely, during the cool phase (negative values), the Low Level Jet weakens, reducing the supply of moist air to the South American continent and thus reducing rainfall.
The rapid transition from one PDO phase to another is consistent with the abrupt changes in rainfall observed in this study. Specifically, the abrupt increase in rainfall in the area during the 1970s may be associated with the onset of a warm phase PDO at the same time, while the abrupt decrease of rainfall in the same area in the early 21st century may be related to the simultaneous onset of a cool phase PDO.
If these pairings are correct, one would expect a dry phase in the eastern area of the Province of La Pampa lasting for about 30 years. Another rainy phase could not be expected until the beginning of the next warm phase PDO.
0 200 400 600 800 1000 1200 1400 1600
1921 1931 1941 1951 1961 1971 1981 1991 2001
Pr
ec
ipi
ta
ti
on
(m
m
)
Year
4. CONCLUSIONS
Segmentation of the annual precipitation series for the eastern area of the Province of La Pampa by Hubert’s segmentation method (Hubert et al., 1989) revealed that the area is subject to abrupt changes in rainfall.
In the second half of the twentieth century there was a succession of abrupt positive changes, with annual precipitation increasing by about 30%. Increased rainfall can be considered one of the causes behind the crop extension area expansion in the years after the event.
However, it should be noted that in the early years of this century, there was an abrupt negative change. Rainfall was significantly reduced with a marked return to low values. If this regime continues for a long time, the carrying capability of the environment could be exceeded, causing a fall in production and parallel environmental degradation.
5. REFERENCES
ALEXANDERSSON, H. A homogeneity test applied to precipitation data. Journal of Climatology, San Francisco, v. 6, p. 661-675, 1986.
ALEXANDERSSON, H.; MOBERG, A. Homogenization of Swedish temperature data. Part I: homogeneity test for linear trends. International Journal of Climatology, London, v. 17, p. 25-34, 1997.
http://dx.doi.org/10.1002/(SICI)1097-0088(199701)17:1<25::AID-JOC103>3.0.CO;2-J
BERNARDOS, J. N.; VIGLIZZO, E. F.; JOUVET, V.; LÉRTORA, F. A.; PORDOMINGO, A. J.; CID, F. D. The use of EPIC model to study the agroecological change during 93 years of farming transformation in the Argentine pampas. Agricultural Systems, Netherlands, v. 69, p. 215-234, 2001.
http://dx.doi.org/10.1016/S0308-521X(01)00027-0
DE LA CASA, A.; NASELLO, O. Breakpoints in annual rainfall trenes in Córdoba, Argentina. Atmospheric Research, v. 95, p. 419-427, 2010.
http://dx.doi.org/10.1016/j.atmosres.2009.11.005
DAGNÉLIE, P. Théorie et Méthodes Statistiques. Gembloux : Les Presses Agronomiques de Gembloux, 1970. 463 p.
EARTH OBSERVATORY. Drought in Argentina. Natural Hazards, 2009. Available in: <http://earthobservatory.nasa.gov/NaturalHazards/view.php?id=37105>. Access in: June 1st. 2011.
FORTE LAY, J.; SCARPATI, O.; CAPRIOLO, A. Precipitation variability and soil content in Pampean Flatlands (Argentina). Geofísica Internacional, México, v. 47, n. 4, p. 341-354, 2008.
GARREAUD, R. D.; ACEITUNO, P. Interannual rainfall variability over South America Altiplano. Journal of Climate, v. 14, p. 2779-2789, 2001.
http://dx.doi.org/10.1175/1520-0442(2001)014<2779:IRVOTS>2.0.CO;2
HUBERT, P.; CARBONNEL, P.; CHAOUCHE, A. Segmentation des séries hydrométriques. Application à des séries de précipitations et de débits de l'Afrique de l'ouest. Journal of Hydrology, Stuttgart, v. 110, p. 349-367, 1989.
JUNQUAS, C.; VERA, C.; LI, L.; LE TREUT, H. Summer precipitation variability over southeastern South America in a global warming scenario. Climatic Dynamics, DOI 10.1007/s00382-011-1141-y, 2011.
http://dx.doi.org/10.1007/s00382-011-1141-y
KÖPPEN, W. Climatología. Ciudad de Mexico: Fondo de Cultura Económica, 1948. 478 p. MANUEL-NAVARRETE, D.; GALLOPÍN, G.; BLANCO, M.; DÍAZ ZORITA, M.;
FERRARO, D.; HERZER, H.; et al. Multi-causal and integrated assessment of sustainability: the case of agriculturization in the Argentine Pampas. Environment Development and Sustainability, London, v. 11, n. 3, p. 621-638, 2009.
http://dx.doi.org/10.1007/s10668-007-9133-0
MANTUA, N. J.; HARE, S.; ZHANG,Y.; WALLACE, J. M.; FRANCIS, R. C. A Pacific interdecadal climate oscillation with impacts on salmon production. Bulletin of American Meteorological Society, v. 78, p. 1069–1079, 1997.
http://dx.doi.org/10.1175/1520-0477(1997)078<1069:APICOW>2.0.CO;2
MINETTI, J. L.; VARGAS, W.; POBLETE, A. G.; ACUÑA, L. R.; CASAGRANDE, G. Non-linear trends and low frequency oscillations in annual precipitation over Argentina and Chile, 1931-1999. Atmósfera, Ciudad de México, v. 16, p. 119-135, 2003.
PAEGLE, N.; MO, K.C. Linkages between summer rainfall variability over South America and sea surface temperature anomalies. Journal of Climate, v. 15, p. 1389-1407, 2002.
http://dx.doi.org/10.1175/1520-0442(2002)015<1389:LBSRVO>2.0.CO;2
PASQUINI, A.; LECOMTE, K.; PIOVANO, E.; DEPETRIS, P. Recent rainfall and runoff variability in Central Argentina. Quaternary International, v. 158, p. 127-139, 2006
http://dx.doi.org/10.1016/j.quaint.2006.05.021
PÉREZ, S.; SIERRA, E.M.; CASAGRANDE, G.; VERGARA, G. Incremento de las precipitaciones (1921/1998) en el centro-este de la provincia de La Pampa (Argentina). Revista de Facultad de Agronomía, Buenos Aires, v. 19, n. 2, p. 193-196, 1999. PÉREZ, S.; SIERRA, E.; LÓPEZ, E.; NIZZERO, G.; MOMO, F.; MASSOBRIO, M. Abrupt
changes in rainfall in the Eastern area of La Pampa Province, Argentina. Theoretical and Applied Climatology, Hamburg, v. 103, p. 159-165, 2011.
http://dx.doi.org/10.1007/s00704-010-0290-y
SIERRA, E. M.; HURTADO, R.; SPESCHA, L. Corrimiento de las isoyetas anuales medias decenales en la Región Pampeana 1941-1990. Revista de Facultad de Agronomía, Buenos Aires, v. 14, n. 2, p. 139-144, 1994.
SIERRA, E. M.; CONDE PRAT, M.; PÉREZ, S. La migración de cultivos de granos como indicador del cambio climático 1941-93 en la Región Pampeana Argentina. Revista de Facultad de Agronomía, Buenos Aires, v. 15, n. 2-3, p. 171-176, 1995.
SOLBRIG, O. T.; VIGLIZZO, E. F. Sustainable farming in the Argentine pampas : history, society, economy and ecology. Paper N° 99/00-1 DRCLAS (Working papers on Latin America); Cambridge: Harvard University Cambridge, 1999.
TREWARTHA, G. T. An introduction to climate. 4th. Edition. New York: Mc Graw-Hill, 1968. 408 p.
VIGLIZZO, E. F.; ROBERTO, Z. E.; FILIPPIN, M. C.; PORDOMINGO, A. J. Climate variability and agroecological change in the Central Pampas of Argentina. Agriculture Ecosystems and Environment, Zürich, v. 55, p. 7-16, 1995.
VIGLIZZO, E. F.; ROBERTO, Z. E.; LÉRTORA, F.; LÓPEZ GAY, E.; BERNARDOS, J. Climate and land-use change in field-crop ecosystems of Argentina. Agriculture Ecosystems and Environment, Zürich, v. 66, p. 61-70, 1997.
VIGLIZZO, E. F.; LÉRTORA, F.; PORDOMINGO, A. J.; BERNARDOS, J. N.; ROBERTO, Z. E.; DEL VALLE, H. Ecological lessons and applications from one century of low external-input farming in the pampas of Argentina. Agriculture Ecosystems and Environment, Zürich, v. 83, p. 65-81, 2001.
VIGLIZZO, E.; PORDOMINGO, A. J.; CASTRO, M. G.; LÉRTORA, F.; SOLBRIG, O. T. Environmental sustainability of Argentine agriculture: patterns, gradients and tendencies 1960-2000. Working Paper N° 01/02-2. Cambridge: Harvard University, The David Rockefeller Center for Latin American Studies, 2002.
VIGLIZZO, E. F.; PORDOMINGO, A. J.; CASTRO, M. G.; LÉRTORA, F. Environmental assessment of agricultura at a regional scale in the Pampas of Argentina. Environmental Monitoring and Assessment, Maine, v. 87, p. 169-195, 2003.
http://dx.doi.org/10.1023/A:1024654316879
VIGLIZZO, E. F.; FRANK, F. C. Ecological interactions, feedbacks, thresholds and collapses in the Argentine Pampas in response to climate and farming during the last century. Quaternary International, Canada, v. 158, p. 122-126, 2006.
VIMEUX, F.; GALLAIRE, R.; BONY, S.; HOFFMANN, G.; CHIANG, J. C. H. What are the climate controls on delta D in precipitation in the Zongo Valley (Bolivia)? Implications for the Illimani ice core interpretation, Earth and Planetary Science Letters, v. 240, P. 205-220, 2005.
http://dx.doi.org/10.1016/j.epsl.2005.09.031
VIMEUX, F.; GINOT, P.; SCHWIKOWSKI, M.; VUILLE, M.; HOFFMANN, G.; THOMPSON, L. G. et al. Climate variability during the last 1000 years inferred from Andean ice cores: A review of methodology and recent results, Palaeogeography, Palaeoclimatology, Palaeoecology, v. 281, P. 229–241, 2009.
http://dx.doi.org/10.1016/j.palaeo.2008.03.054