and Paulo de Souza Gonçalves(1)
(1)Instituto Agronômico de Campinas, Programa Seringueira, Caixa Postal 28, CEP 13001-970 Campinas, SP, Brazil. E-mail: [email protected],
[email protected], [email protected] (2)Agência Paulista de Tecnologia dos Agronegócios, Pólo Regional Noroeste Paulista,
Caixa Postal 61, CEP 15500-970 Votuporanga, SP, Brazil. E-mail:[email protected]
Abstract – The objective of this work was to assess, during six years, the temporal stability of natural rubber yield of 25 superior Hevea brasiliensis genotypes, using the Wricke, Eberhart & Russell, Lin & Binns, additive main effect and multiplicative interaction (AMMI) analysis, and harmonic mean of the relative performance of the genetic values (HMRPGV) methods. The IAC 40 and IAC 300 genotypes were identified as stable and high yielding by the Eberhart & Russell, Lin & Binns, HMRPGV, and AMMI Biplot methods. The ranking of the other more stable genotypes identified by these analyses was altered. The observed results in the AMMI Biplot agreed with those observed in the Wricke method for identifying stable, but lower yielding genotypes. The simultaneous use of different methods allows a more accurate indication of stable genotypes. Stability analyses based on different principles show agreement in indicating stable genotypes.
Index terms: Hevea brasiliensis, genotype selection, genotype x year interaction.
Diferentes métodos para avaliar a estabilidade temporal do rendimento em
seringueira
Resumo – O objetivo deste trabalho foi avaliar, durante seis anos, a estabilidade temporal da produção de borracha natural de 25 genótipos superiores de Hevea brasiliensis, utilizando os métodos de Wricke, Eberhart & Russell, Lin & Binns, análise dos efeitos aditivos principais e interação multiplicativa (AMMI) e média harmônica da performance relativa dos valores genéticos (MHPRV). Os genótipos IAC 40 e IAC 300 foram identificados como estáveis e produtivos, pelos métodos de Eberhart & Russell, Lin & Binns, MHPRV e Biplot AMMI. Houve alteração no ordenamento dos demais genótipos mais estáveis identificados a partir dessas análises. Os resultados observados no Biplot AMMI mostraram concordância com os observados no método de Wricke para a identificação de genótipos estáveis, mas menos produtivos. A utilização simultânea de diferentes métodos permite a indicação mais precisa de genótipos estáveis. Análises de estabilidade baseadas em diferentes princípios mostram concordância na indicação de genótipos estáveis.
Termos para indexação: Hevea brasiliensis, seleção de genótipos, interação genótipo x ano.
Introduction
The main source of natural rubber, Hevea brasiliensis (Willd. ex A. Juss.) Muell. Arg., is an important commercial species, which has been the object of genetic breeding to increase latex yield. However, this is a slow and laborious process, due to the perennial nature of the crop and to the several selection and assessment stages of the breeding cycle (Chandrasekhar et al., 2007; Priyadarshan et al., 2009). In one of these stages, the selection process involves assessing the adaptability and stability of genotypes in different environments.
Plant breeders usually estimate adaptability and phenotype stability parameters to assess new genotypes before recommending them as cultivars (Silva & Duarte,
2006). In the case of H. brasiliensis, the most desirable genotypes are those that show stability in vigor and high yield over the years and locations (Gonçalves et al., 2003). Genotype x year interaction in perennial crops represents the different responses of genotypes to changes in annual conditions. In genotype x year interaction, the relative performance of genotypes varies with the year (Gonçalves et al., 2005).
stable (Cruz et al., 2004). The method proposed by Eberhart & Russell (1966), based on linear regression, measures the response of each genotype to environmental
variations. Regression coefficients of each genotype,
regarding the environmental index of the deviations of this regression, represent the estimates of the adaptability and stability parameters (Cruz et al., 2004). In the nonparametric analysis by Lin & Binns (1988), the measurement used to estimate the stability and adaptability of cultivars is the mean of the square of the distance between the cultivar and the mean maximum response obtained in the environment (Cruz & Carneiro, 2006). The additive main effect and multiplicative interaction (AMMI) model combines a univariate method, i.e., analysis of variance for additive effects of genotype and environment, with a multivariate method, i.e., analysis of principal components for multiplicative effect of genotype x environment interaction (Gauch & Zobel, 1988). This method enables a more precise estimate of genotypic responses and an easy graphic interpretation of statistical analysis results by plot procedure (Zobel et al., 1988). According to Resende (2004), in the context of mixed models, the harmonic mean of the relative performance of the genetic values (HMRPGV), predicted by Blup, is an option for simultaneous selection based on yield, stability, and adaptability.
Recently, several methods have been used simultaneously to assess stability and adaptability in various crops, such as guarana (Nascimento Filho et al., 2009), cotton (Silva Filho et al., 2008), beans (Melo et al., 2007; Pereira et al., 2009a, 2009b), corn (Cargnelluti Filho et al., 2007), soybean (Silva & Duarte, 2006), sugarcane (Rosse et al., 2002), and eucalyptus (Resende et al., 2001). In some cases, these methods can be complementary, since the simultaneous use of different methods generates estimates with different approaches (Pereira et al., 2009b).
The most recent studies on stability and adaptability regarding H. brasiliensis have been based on the Finlay & Wilkinson (Gonçalves et al., 2009), Reml/Blup (Verardi et al., 2009), Eberhart & Russell (Gonçalves et al., 2008), and GGE-Biplot (Priyadarshan et al., 2008) methods. However, there is no record of different methods being used simultaneously.
The objective of this work was to assess, during six years, the temporal stability of natural rubber yield of 25 superior H. brasiliensis genotypes, using the Wricke,
Eberhart & Russell, Lin & Binns, additive main effect and multiplicative interaction (AMMI) analysis, and harmonic mean of the relative performance of the genetic values (HMRPGV) methods.
Materials and Methods
A total of 25 genotypes were used in the experiment: one Malay clone (RRIM 600), eight Amazon clones
(five IAN, two Fx, and one RO), and 16 local clones
(IAC). The Amazon clones derived from crosses and selections made in Brazil by Ford and Instituto Agronômico do Norte (IAN); except RO 45, a primary clone, derived from unknown parents, from a collection in the state of Rondônia. The IAC clones are the result of crosses and selection by Instituto Agronômico de Campinas (IAC).
The experiment was set up in the experimental area of Pólo Regional Noroeste Paulista, at the Estação Experimental de Votuporanga, located in the northwestern region of São Paulo State, Brazil, at 20º25'S and 49º50'W, at 450-m altitude. The mean temperature during the growing season was 32ºC, and the mean annual rainfall was 1,480 mm. The soil is
classified as Paleudalf (Argissolo), with average nutrient
status and poor physical structure. A randomized complete block design, with three replicates, was used. Each plot consisted of one row of six plants, with 7.0 m between rows and 3.0 m between plants. Rubber yield was assessed with half spiral tapping, at
three‑day intervals, five days a week, during eleven
months of the year. Yield was measured by the amount of coagulated latex in the bowls, which were attached to each tapped tree and collected randomly twice a month; the latex was dried under normal shade and ventilation conditions during the assessment period. The total annual rubber yield per tree was divided by the number of coagulates, and the results were expressed in grams per tree per tapping.
Data were subjected to individual and joint analyses
of variance. After verifying significant genotype x
year interaction, analyses of genotype adaptability and phenotype stability were carried out using the Wricke (1965), Eberhart & Russell (1966), Lin & Binns (1988), AMMI (Zobel et al., 1988), and Blup prediction (HMRPGV) methods, described by Resende (2004).
The analyses of the first three methods were carried
out using the Genes program (Cruz, 2006), while the
the SAS (SAS Institute, 2002) and the Selegen Reml/ Blup (Resende, 2007) programs, respectively. The statistical models used in these analyses are described below.
The stability of the genotypes by the Wricke method was estimated by:
in which: ωι is the contribution of the ith genotype in the total of the interaction; Yij is the mean of the ith
genotype in environment j; Yi. is the total of the ith
genotype in all locations; Y.j is the total of environment
j considering all genotypes;
in which: G is the number of genotypes assessed; and L is the number of experimental locations.
In the analysis by Eberhart & Russell (1966), the linear regression model was represented by:
Yij = mi + biIj + dij + ēij,
in which: Yij is the observed mean of the ith genotype
in environment j; mi is the general mean of the ith
genotype; bi is the regression coefficient of the ith
genotype; Ij is the jth environmental index; dij is the
deviation of the regression of the ith genotype in the jth
environment; and ēij is the mean error associated to the
mean. With this methodology, two stability parameters
were estimated: regression coefficient (ˆβi), i.e., the regression of the performance of each genotype in different years on the annual mean over all genotypes, and variance of the deviation ( ) from the regression
line. The coefficient of determination (R2) for regression
was used to determine how well the linear model fit
the data. The environmental index was calculated by:
in which n is the number of environments.
In the method by Lin & Binns, Pi is the mean quadratic distance between genotype i and the genotype with maximum response in environment j, as follows:
in which: Pi is the superiority index of the ith genotype; Yij is the yield of the ith genotype in the jth environment;
Mj is the yield of the genotype with maximum response
among all genotypes in the jth environment; and n is
the number of environments. Modifications were used
to discriminate Pi values for favorable and unfavorable environments, as reported in Cruz & Carneiro (2006).
The model below was used in AMMI analysis, which involves additive components to study principal effects, and multiplicative components to study interaction:
in which: Yij is the mean response of the ith genotype
(i = 1, 2, ..., G genotypes) in the jth environment
(j = 1, 2,..., A environments); μ is the general mean
of the experiments; gi is the fixed effect of the ith
genotype; ej is the fixed effect of the jth environment;
λk is the kth singular value (scale) of the original
interaction matrix (shown by GA); γik is the element
corresponding to the ith singular vector column of the GA matrix; αjk is the element corresponding to the jth
environment in the kth singular vector line of the GA matrix; ρij is the noise associated to the (ga)ij term of
the classic interaction of the ith genotype with the jth environment j; and ε is the mean experimental error.
The HMRPGV from the program Selegen-Reml/ Blup, which is used for complete block designs with temporal stability and adaptability, according to the statistical model number 79, was used in the joint selection for yield, stability, and adaptability of genetic materials:
y = Xm + Zg + Wp + Ti + Qs + ε,
in which: y is the data vector; m is the vector of the effects of evaluation-replicate combinations (assumed
as fixed) added to the general mean; g is the vector of
Results and Discussion
Highly significant (p<0.01) effects were observed
in the individual variance analyses of the genotypes for rubber yield each year, suggesting that the differences among the genotypes within each year were attributable to genetic causes. The joint analysis
of variance showed highly significant effects (p<0.01)
for genotypes, years, and genotype x year interaction, which indicates, respectively, presence of variability among genotypes, differences between years, and differences in the relative performance of genotypes in the years assessed.
Since the focus of the present study was to select stable genotypes over time, comparisons between the different methods of stability assessment concentrated mainly on the genotype with the best performance for the parameters assessed.
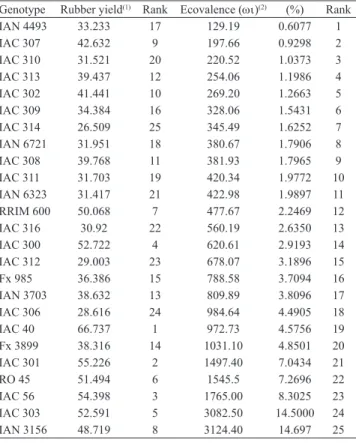
Table 1 shows the stability parameters (ωι) obtained with the Wricke method, based on analysis of variance, in which the lowest values indicate greater stability. The most stable genotypes (IAN 4493, IAC 307, IAC 310, IAC 313, and IAC 302) were not amongst
the highest yielding; the genotypes identified as least
stable (IAN 3156, IAC 303, IAC 56, RO 45, and IAC 301) had better yields. According to Cargnelutti Filho et al. (2007), the Wricke method does not depend on the mean yield or on the response to variations in environmental conditions (adaptability); thus, methods
based on analysis of variance may not be very efficient.
Nascimento Filho et al. (2009) reported similar results to those obtained in the present study, but for guarana [Paullinia cupana var. sorbilis (Mart.) Ducke], while using a method based on analysis of variance. The
authors verified that the clones with minimum variance
among the environments were generally lower yielding and highly stable, but not of interest for breeding to increase yield. In the case of the genotypes used in the present study, which had been previously assessed and selected, even those with lower yields have potential for use. The results found for the most stable genotype agreed with those found in AMMI analysis. Silva Filho et al. (2008) and Silva & Duarte (2006) also observed agreement between the Wricke method and AMMI analysis in cotton and soybean, respectively.
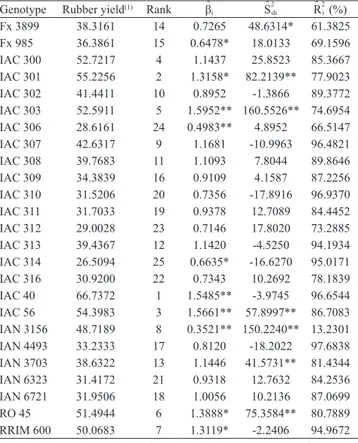
The parameters obtained by the Eberhart & Russell method are shown in Table 2. High values were observed
for the determination coefficient (R2), indicating that
the genotypes fitted the stability model. Eighteen of the 25 genotypes assessed showed nonsignificant deviations
from the regression ( = 0), indicating stability. The Fx 3899, IAC 301, IAC 303, IAC 56, IAN 3156, IAN 3703, and RO 45 genotypes did not show stability. Regarding adaptability, six genotypes (IAC 303, IAC 56, IAC 40,
RO 45, IAC 301, and RRIM 600) showed specific
adaptability in favorable environments (ˆβi>1.0),
while genotypes IAN 3156, IAC 306, Fx 985, and
IAC 314 showed specific adaptability for unfavorable
environments (ˆβi<1.0). The genotypes showed general
adaptability (ˆβi = 1.0). According to Resende et al.
(2001), genotypes with (ˆβi = 1.0) are only desirable if
they have maximum yield. IAC 40, IAC 300, and the control RRIM 600 were among the highest yielding stable genotypes, and were considered stable by the Lin & Binns, HMRPGV, and AMMI1 biplot analyses. There was agreement among the genotypes that showed
Table 1. Estimates of phenotypic stability obtained by the Wricke method, and mean rubber yield (grams per tree per tapping) of 25 Heveabrasiliensis genotypes assessed, during six years.
Genotype Rubber yield(1) Rank Ecovalence (ωι)(2) (%) Rank
IAN 4493 33.233 17 129.19 0.6077 1
IAC 307 42.632 9 197.66 0.9298 2
IAC 310 31.521 20 220.52 1.0373 3
IAC 313 39.437 12 254.06 1.1986 4
IAC 302 41.441 10 269.20 1.2663 5
IAC 309 34.384 16 328.06 1.5431 6
IAC 314 26.509 25 345.49 1.6252 7
IAN 6721 31.951 18 380.67 1.7906 8
IAC 308 39.768 11 381.93 1.7965 9
IAC 311 31.703 19 420.34 1.9772 10
IAN 6323 31.417 21 422.98 1.9897 11
RRIM 600 50.068 7 477.67 2.2469 12
IAC 316 30.92 22 560.19 2.6350 13
IAC 300 52.722 4 620.61 2.9193 14
IAC 312 29.003 23 678.07 3.1896 15
Fx 985 36.386 15 788.58 3.7094 16
IAN 3703 38.632 13 809.89 3.8096 17
IAC 306 28.616 24 984.64 4.4905 18
IAC 40 66.737 1 972.73 4.5756 19
Fx 3899 38.316 14 1031.10 4.8501 20
IAC 301 55.226 2 1497.40 7.0434 21
RO 45 51.494 6 1545.5 7.2696 22
IAC 56 54.398 3 1765.00 8.3025 23
IAC 303 52.591 5 3082.50 14.5000 24
IAN 3156 48.719 8 3124.40 14.697 25
specific adaptability in favorable environments by the
Eberhart & Russell method and by the Lin & Binns method. Cargnelutti Filho et al. (2007), Silva Filho et al. (2008), and Nascimento Filho et al. (2009) found agreement between the Eberhart & Russell and Lin & Binns methods.
Table 3 shows the ranking of the genotypes according to the Lin & Binns method for stability, adaptability, and yield, with the alteration proposed by Cruz & Carneiro (2006), which separates clones with greater stability and phenotypic adaptability for
favorable and unfavorable environments (<Pi). IAC 40 was classified as the most stable and adapted genotype
in favorable and unfavorable environments, whereas IAC 300 was among the most stable and adapted in
general and unfavorable environments. Genotypes IAC 303, IAC 56, IAC 301, and RRIM 600 showed
specific adaptability to favorable environments, while IAN 3156, IAC 300, IAC 301, and RO 45 had specific
adaptability to unfavorable environments. Besides identifying the most stable and adaptive genotypes among the highest yielding, the Lin & Binns method is easy to apply and interpret, and discriminates the best clones for performance in both favorable and unfavorable environments (Nascimento Filho et al., 2009; Pereira et al., 2009a).
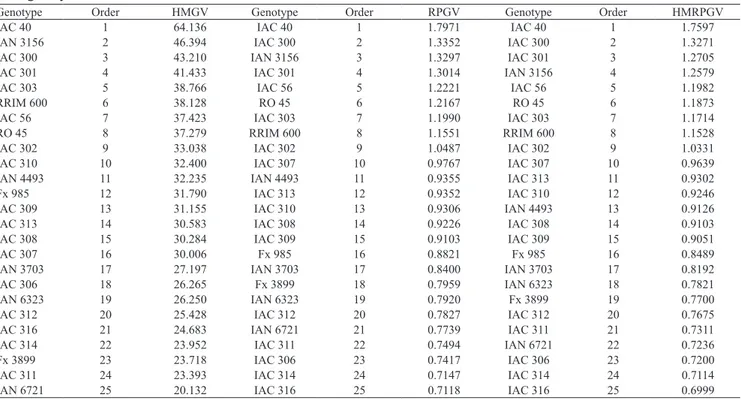
In the analyses carried out by HMRPGV (Table 4),
IAC 40 and IAC 300 were among the first genotypes
for all the parameters assessed. The highest genetic values for stability were found for IAC 40, IAC 3156, IAC 300, IAC 301, and IAC 303, and the greatest adaptability was found for IAC 40, IAC 300, IAC 3156, IAC 301, and IAC 56. The genotypes that showed highest stability and adaptability were IAC 40, IAC 300, IAC 301, IAC 3156, and IAC 56. As observed by Maia et al. (2009), there are similarities among the rankings of these materials by the different methods. According to the authors, this could be a result of the positive correlation and the mean magnitude involving genotypic performance in the environments.
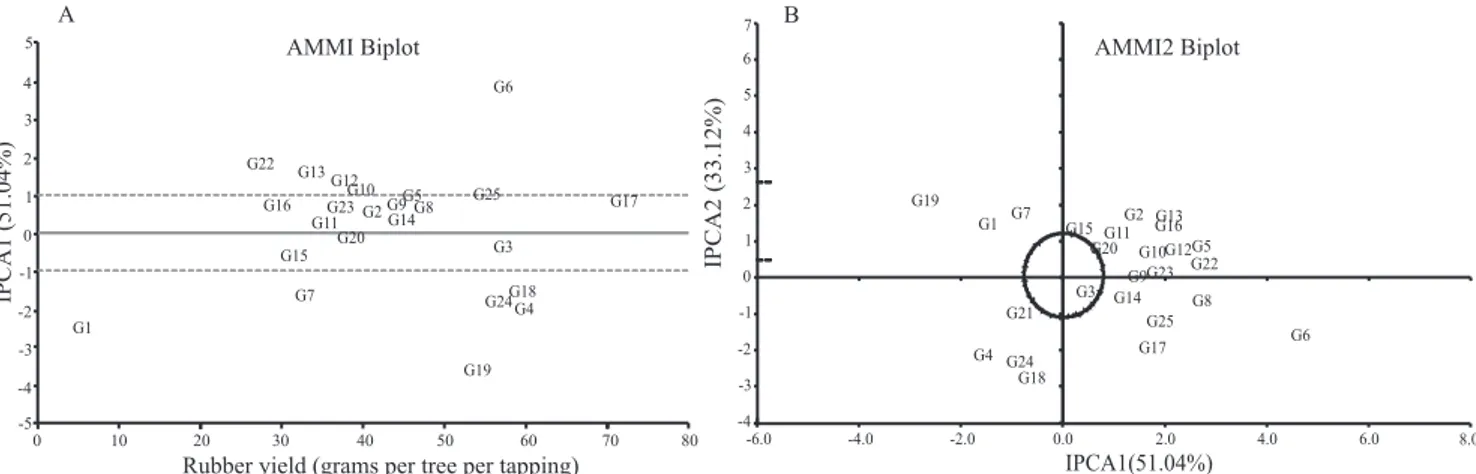
Five components were obtained by AMMI analysis
(IPCA). There was significance up to the AMMI2 model, which was the first to associate significance for axles (IPCA) with nonsignificance for residue (noise). According to Gauch (1988), the first AMMI
axles capture a greater percentage of pattern. The subsequent increase in dimensions (axles) results in a decrease in the percentage of pattern and in an increase in noise. Therefore, in spite of selection on a single axle, which explains a small portion of the original sum of squares of the genotype x environment interaction (SSGxE), the capture of
a greater percentage of pattern was expected. In
the present study, the first axle (IPCA 1) explained
51.04% of the sum of squares of the interaction of the variation, and the second (IPCA 2) explained
33.12%, totaling 84.16% in the first two components.
Figure 1 shows the AMMI1 biplot analyses for IPCA x rubber yield data and the AMMI2 biplot analyses for IPCA 1 x IPCA 2. According to Duarte & Vencovsky (1999), in AMMI analysis, the biplot is interpreted by the magnitude and the sign of the genotype and environment scores for the interaction axles. Thus, scores close to zero characterize genotypes and
Table 2. Estimates of phenotypic stability and adaptability obtained by the Eberhart & Russell method, and mean rubber yield (gram per tree per tapping) of 25 Hevea brasiliensis
genotypes assessed, during six years. Genotype Rubber yield(1) Rank βˆ
i ˆS
2 di ˆR
2 i (%)
Fx 3899 38.3161 14 0.7265 48.6314* 61.3825 Fx 985 36.3861 15 0.6478* 18.0133 69.1596 IAC 300 52.7217 4 1.1437 25.8523 85.3667 IAC 301 55.2256 2 1.3158* 82.2139** 77.9023 IAC 302 41.4411 10 0.8952 -1.3866 89.3772 IAC 303 52.5911 5 1.5952** 160.5526** 74.6954 IAC 306 28.6161 24 0.4983** 4.8952 66.5147 IAC 307 42.6317 9 1.1681 -10.9963 96.4821 IAC 308 39.7683 11 1.1093 7.8044 89.8646 IAC 309 34.3839 16 0.9109 4.1587 87.2256 IAC 310 31.5206 20 0.7356 -17.8916 96.9370 IAC 311 31.7033 19 0.9378 12.7089 84.4452 IAC 312 29.0028 23 0.7146 17.8020 73.2885 IAC 313 39.4367 12 1.1420 -4.5250 94.1934 IAC 314 26.5094 25 0.6635* -16.6270 95.0171 IAC 316 30.9200 22 0.7343 10.2692 78.1839 IAC 40 66.7372 1 1.5485** -3.9745 96.6544 IAC 56 54.3983 3 1.5661** 57.8997** 86.7083 IAN 3156 48.7189 8 0.3521** 150.2240** 13.2301 IAN 4493 33.2333 17 0.8120 -18.2022 97.6838 IAN 3703 38.6322 13 1.1446 41.5731** 81.4344 IAN 6323 31.4172 21 0.9318 12.7632 84.2536 IAN 6721 31.9506 18 1.0056 10.2136 87.0699 RO 45 51.4944 6 1.3888* 75.3584** 80.7889 RRIM 600 50.0683 7 1.3119* -2.2406 94.9672
(1)Mean yield of six years. ˆβ
i, regression coefficient. H0, ˆβi = 1 and
HA, ˆβi ≠ 1. * and **Significant by the t test at 5 and 1% probability,
respectively. Sˆ2di: deviation of the regression coefficient. H0, ˆS 2 di = 0 and
HA, ˆS 2
di ≠ 0. * and **Significant by the f test, at 5 and 1% probability,
Table 3. Estimates of phenotypic stability and adaptability obtained by the Lin & Binns method, with the alteration proposed by Cruz & Carneiro 2006 and mean rubber yield (grams per tree per tapping) of 25 Hevea brasiliensis genotypes assessed, during six years(1).
Genotype Rubber yield General Pi Rank Favorable Pi Rank Unfavorable Pi Rank
IAC 40 66.7372 18.8244 1 6.9162 1 42.6409 1
IAC 301 55.2256 169.6429 2 192.6872 4 123.5543 4
IAC 300 52.7217 189.2094 3 243.2734 6 81.0813 3
IAC 56 54.3983 189.3249 4 169.4281 3 229.1185 6
RRIM 600 50.0683 219.5556 5 212.1379 5 234.3909 7
IAC 303 52.5911 220.6021 6 158.9637 2 343.8791 10
RO 45 51.4944 231.4335 7 252.5771 7 189.1463 5
IAN 3156 48.7189 392.1168 8 558.3374 12 59.6756 2
IAC 307 42.6317 407.0212 9 396.9746 8 427.1145 12
IAC 302 41.4411 449.8353 10 499.1332 10 351.2396 11
IAC 313 39.4367 501.9152 11 493.7025 9 518.3408 16
IAC 308 39.7683 503.7598 12 520.8373 11 469.6047 13
IAN 3703 38.6322 562.6114 13 607.4329 13 472.9684 14
Fx 3899 38.3161 588.9922 14 741.7744 14 283.4279 8
Fx 985 36.3861 630.8047 15 798.6014 17 295.2112 9
IAC 309 34.3839 682.6774 16 764.4721 15 519.0881 17
IAN 4493 33.2333 731.4238 17 834.6248 18 525.0219 18
IAN 6721 31.9506 775.1583 18 770.7880 16 783.8991 25
IAC 311 31.7033 787.6565 19 849.2486 20 664.4723 22
IAN 6323 31.4172 796.8074 20 841.1832 19 708.0559 24
IAC 310 31.5206 799.4209 21 927.4925 22 543.2777 19
IAC 316 30.9200 828.5439 22 919.5880 21 646.4557 21
IAC 312 29.0028 910.1217 23 1,062.0425 23 606.2803 20
IAC 306 28.6161 956.8838 24 1,195.7316 25 479.1881 15
IAC 314 26.5094 1,022.0931 25 1,180.9025 24 704.4743 23
(1)Pi, measure to evaluate phenotypic adaptability and stability.
Table 4. Estimates of harmonic mean of the genetic values (HMGV), relative performance of the genetic values (RPGV), and harmonic mean of the relative performance of the genetic values (HMRPGV) of 25 Hevea brasiliensis genotypes assessed, during six years.
Genotype Order HMGV Genotype Order RPGV Genotype Order HMRPGV
IAC 40 1 64.136 IAC 40 1 1.7971 IAC 40 1 1.7597
IAN 3156 2 46.394 IAC 300 2 1.3352 IAC 300 2 1.3271
IAC 300 3 43.210 IAN 3156 3 1.3297 IAC 301 3 1.2705
IAC 301 4 41.433 IAC 301 4 1.3014 IAN 3156 4 1.2579
IAC 303 5 38.766 IAC 56 5 1.2221 IAC 56 5 1.1982
RRIM 600 6 38.128 RO 45 6 1.2167 RO 45 6 1.1873
IAC 56 7 37.423 IAC 303 7 1.1990 IAC 303 7 1.1714
RO 45 8 37.279 RRIM 600 8 1.1551 RRIM 600 8 1.1528
IAC 302 9 33.038 IAC 302 9 1.0487 IAC 302 9 1.0331
IAC 310 10 32.400 IAC 307 10 0.9767 IAC 307 10 0.9639
IAN 4493 11 32.235 IAN 4493 11 0.9355 IAC 313 11 0.9302
Fx 985 12 31.790 IAC 313 12 0.9352 IAC 310 12 0.9246
IAC 309 13 31.155 IAC 310 13 0.9306 IAN 4493 13 0.9126
IAC 313 14 30.583 IAC 308 14 0.9226 IAC 308 14 0.9103
IAC 308 15 30.284 IAC 309 15 0.9103 IAC 309 15 0.9051
IAC 307 16 30.006 Fx 985 16 0.8821 Fx 985 16 0.8489
IAN 3703 17 27.197 IAN 3703 17 0.8400 IAN 3703 17 0.8192
IAC 306 18 26.265 Fx 3899 18 0.7959 IAN 6323 18 0.7821
IAN 6323 19 26.250 IAN 6323 19 0.7920 Fx 3899 19 0.7700
IAC 312 20 25.428 IAC 312 20 0.7827 IAC 312 20 0.7675
IAC 316 21 24.683 IAN 6721 21 0.7739 IAC 311 21 0.7311
IAC 314 22 23.952 IAC 311 22 0.7494 IAN 6721 22 0.7236
Fx 3899 23 23.718 IAC 306 23 0.7417 IAC 306 23 0.7200
IAC 311 24 23.393 IAC 314 24 0.7147 IAC 314 24 0.7114
environments that contribute little to interaction, i.e., are stable. In the AMMI2 biplot, stable genotypes and environments are those whose points are close to zero for the two interaction axles (IPCA1 x IPCA2). The most stable genotypes in the AMMI biplot were IAC 310, IAN 4493, IAN 6721, IAC 313, IAC 314, and IAC 307, all with low yield. IAC 40 and IAC 300 were among the high yielding and stable genotypes, as observed in previous analyses. The results found for stable genotypes, but with lower yield, were in line with those found with the Wricke method. In AMMI2, genotypes IAN 4493, IAC 300, and IAC 314 were considered stable.
There was coherence among the most stable
genotypes identified with the different analytical
methods; however, the ranking of some genotypes was altered. IAC 40 and IAC 300 were considered the most stable in the analyses that associated stability to yield. From the breeder’s point of view, processing data by several methods of adaptability and stability analysis, while considering the peculiarities of each method, is better for decision-making when indicating cultivars (Cargnelutti Filho et al., 2007). When the genotype x environment interaction results in the variation of unpredictable environmental factors, such as year to year variation, as was the case in the present study, breeders need to develop more stable genotypes that can perform reasonably well in a wide range of conditions. Such breeding
strategies can help rubber producers to avoid risks (Gonçalves et al., 2008).
Conclusions
1. The simultaneous use of different methods leads to a more accurate indication of stable Hevea brasiliensis
genotypes.
2. Stability analyses based on different principles show agreement in indicating stable H. brasiliensis
genotypes.
Acknowledgements
To Fundação de Amparo à Pesquisa do Estado de São Paulo, and to Conselho Nacional de Desenvolvimento
Científico e Tecnológico, for financial support.
References
CARGNELLUTI FILHO, A.; PERECIN, D.; MELHEIROS, E.B.; GUADAGNIN, J.P. Comparação de métodos de adaptabilidade e estabilidade relacionados à produtividade de grãos de cultivares de milho. Bragantia, v.66, p.571-578, 2007.
CHANDRASEKHAR, T.R.; MARATTUKALAM, J.G.; MERCYKUTTY, V.C.; PRIYADARSHAN, P.M. Age of yield stabilization and its implications for optimizing selection and shortening breeding cycle in rubber (Hevea brasiliensis Muell. Arg.). Euphytica, v.156, p.67-75, 2007.
CRUZ, C.D. Programa Genes: análise multivariada e simulação. Viçosa: UFV, 2006. 175p.
CRUZ, C.D.; CARNEIRO, P.C.S. Modelos biométricos aplicados ao melhoramento genético. Viçosa: UFV, 2006. v.2, 585p.
CRUZ, C.D.; REGAZZI, A.J.; CARNEIRO, P.C.S. Modelos biométricos aplicados ao melhoramento genético. Viçosa: UFV, 2004. 480p.
DUARTE, J.B.; VENCOVSKY, R. Interação genótipo x ambiente: uma introdução à análise “AMMI”. Ribeirão Preto: Sociedade Brasileira
de Genética, 1999. 60p. (SBG. Série monografias, 9).
EBERHART, S.A.; RUSSELL, W.A. Stability parameters for comparing varieties. Crop Science, v.6, p.36-40, 1966.
GAUCH, H.G. Model selection and validation for yield trials with interaction. Biometrics, v.44, p.705-715, 1988.
GAUCH, H.G.; ZOBEL, R.W. Predictive and postdictive success of statistical analyses of yield trials. Theoretical and Applied Genetics, v.76, p.1-10, 1988.
GONÇALVES, P. de S.; BORTOLETTO, N.; CARDINAL, Á.B.B.; GOUVÊA, L.R.L.; COSTA, R.B. de; MORAES, M.L.T. Age-age correlation for early selection of rubber tree genotypes in São Paulo State, Brazil. Genetics and Molecular Biology, v.28, p.758-764, 2005. GONÇALVES, P. de S.; BORTOLETTO, N.; MARTINS, A.L.M.; COSTA, R.B. da; GALLO, P.B. Genotype-environment interaction and phenotypic stability for girth growth and rubber yield of Hevea clones in São Paulo State, Brazil. Genetics and Molecular Biology, v.26, p.441-448, 2003.
GONÇALVES, P. de S.; MORAES, M.L.T. de; GOUVÊA, L.R.L.; AGUIAR, A.T. da E.; SCALOPPI JUNIOR, J.R. Temporal stability for unpredictable annual climatic variability for Hevea genotype selection.
Brazilian Archives of Biology and Technology,v.51, p.11-18, 2008. GONÇALVES, P. de S.; MORAES, M.L.T. de; SILVA, M. de A.; GOUVÊA, L.R.L.; AGUIAR, A.T. da E.; COSTA, R.B. da. Prediction of Hevea progeny performance in the presence of genotype-environment interaction. Brazilian Archives of Biology and Technology, v.52, p.25-33, 2009.
LIN, C.S.; BINNS, M.R. A superiority measure of cultivar performance for cultivar x location data. Canadian Journal of Plant Science, v.68, p.193-198, 1988.
MAIA, M.C.C.; RESENDE, M.D.V. de; PAIVA, J.R. de; CAVALCANTI, J.J.V.; BARROS, L. de M. Seleção simultânea para produção, adaptabilidade e estabilidade genotípicas em clones de cajueiro, via modelos mistos. Pesquisa Agropecuária Tropical, v.39, p.43-50, 2009.
MELO, L.C.; MELO, P.G.; FARIA, L.C. de; CABRERA DIAZ, J.L.; DEL PELOSO, M.J.; RAVA, C.A.; COSTA, J.G.C. da. Interação com ambientes e estabilidade de genótipos de feijoeiro-comum na Região Centro-Sul do Brasil. Pesquisa Agropecuária Brasileira, v.42, p.715-723, 2007.
NASCIMENTO FILHO, F.J. do; ATROCH, A.L,; CRUZ, C.D.; CARNEIRO, P.C.S. Adaptabilidade e estabilidade de clones de guaraná.
Pesquisa Agropecuária Brasileira, v.44, p.1138-1144, 2009.
PEREIRA, H.S.; MELO, L.C.; DEL PELOSO, M.J.; FARIA, L.C. de; COSTA, J.G.C. da; CABRERA DÍAZ, J.L.; RAVA, C.A.;
WENDLAND, A. Comparação de métodos de análise de adaptabilidade e estabilidade fenotípica em feijoeiro-comum. Pesquisa Agropecuária Brasileira, v.44, p.374-383, 2009a.
PEREIRA, H.S.; MELO, L.C.; FARIA, L.C. de; DEL PELOSO, M.J.; COSTA, J.G.C. da; RAVA, C.A.; WENDLAND, A. Adaptabilidade e estabilidade de genótipos de feijoeiro-comum com grãos tipo carioca na Região Central do Brasil. Pesquisa Agropecuária Brasileira, v.44, p.29-37, 2009b.
PRIYADARSHAN, P.M.; DEY, S.K.; NAZEER, M.A.; VARGHESE, Y.A.; KANG, M.S. Adaptability analysis of rubber (Hevea Brasiliensis
Muell.-Arg.) clones via GGE Biplot. Journal of Rubber Research, v.11, p.237-244, 2008.
PRIYADARSHAN, P.M.; GONÇALVES, P. de S.; OMOKHAFE, K.O. Breeding Hevea rubber. In: JAIN, S.M.; PRIYADARSHAN, P.M. (Ed.). Breeding plantation tree crops: tropical species. New York: Springer Science, 2009. p.469-524.
RESENDE, M.D.V. de. Métodos estatísticos ótimos na análise de experimentos de campo. Colombo: Embrapa Florestas, 2004. 57p. (Embrapa Florestas. Documentos, 100).
RESENDE, M.D.V. de. SELEGEN REML/BLUP: sistema estatístico e seleção genética computadorizada via modelos lineares mistos. Colombo: Embrapa Florestas, 2007. 359p.
RESENDE, M.D.V. de; DUARTE, J.B. Precisão e controle de qualidade em experimentos de avaliação de cultivares. Pesquisa Agropecuária Tropical, v.37, p.182-194, 2007.
RESENDE, M.D.V. de; STURION, J.A.; HIGA, A.R. Comparação entre métodos de avaliação da estabilidade fenotípica e adaptabilidade aplicados a dados de Eucalyptus cloeziana (F. Muell). Boletim de Pesquisa Florestal, n.42, p.3-34, 2001. ROSSE, L.N.; VENCOVSKY, R.; FERREIRA, D.F. Comparação de métodos de regressão para avaliar a estabilidade fenotípica em cana-de-açúcar. Pesquisa Agropecuária Brasileira, v.37, p.25-32, 2002.
SAS INSTITUTE. SAS: user’s guide. Versão 9.1.3. Cary: SAS Institute, 2002.
SILVA FILHO, J.L. da; MORELLO, C. de L.; FARIAS, F.J.C.; LAMAS, F.M.; PEDROSA, M.B.; RIBEIRO, F.L. Comparação de métodos para avaliar a adaptabilidade e estabilidade produtiva em algodoeiro.
Pesquisa Agropecuária Brasileira, v.43, p.349-355, 2008.
SILVA, W.C.J. e; DUARTE, J.B. Métodos estatísticos para estudo de adaptabilidade e estabilidade fenotípica em soja. Pesquisa Agropecuária Brasileira, v.41, p.23-30, 2006.
VERARDI, C.K.; RESENDE, M.D.V. de; COSTA, R.B. da; GONÇALVES, P. de S. Adaptabilidade e estabilidade da produção de borracha e seleção em progênies de seringueira. Pesquisa Agropecuária Brasileira, v.44, p.1277-1282, 2009.
WRICKE, G. Zur Berechning der Okovalenz bei Sommerweizen und Hafer. Zeitschrift fur Pflanzenzuchtung, v.52, p.127-138, 1965. ZOBEL, R.W.; WRIGHT, M.J.; GAUCH, H.G. Statistical analysis of a yield trial. Agronomy Journal, v.80, p.388-393, 1988.