Maurício Antônio de Oliveira Coelho(1), Gisele Abigail Montan Torres(2),
Paulo Roberto Cecon(3) and Flávio Martins Santana(2)
(1)Empresa de Pesquisa Agropecuária de Minas Gerais, Campo Experimental de Sertãozinho, Rodovia Patos/Presidente Olegário, Km 18,
Caixa Postal 135, CEP 38700‑000 Patos de Minas, MG, Brazil. E‑mail: [email protected] (2)Embrapa Trigo, Rodovia BR‑285, Km 294,
Caixa Postal 3081, CEP 99050‑970 Passo Fundo, RS, Brazil. E‑mail: [email protected], [email protected] (3)Universidade
Federal de Viçosa, Avenida Peter Henry Rolfs, s/no, Centro, CEP 36570‑000 Viçosa, MG, Brazil. E‑mail: [email protected]
Abstract – The objective of this work was to assess the effect of sowing date on the intensity of wheat blast disease, as well as the yield losses caused by this disease in different wheat (Triticum aestivum) genotypes. The experiments were conducted in 2013 at the Sertãozinho experimental station of Empresa de Pesquisa Agropecuária de Minas Gerais (Epamig), in the municipality of Patos de Minas, in the state of Minas Gerais, Brazil. Fourteen wheat genotypes and two sowing dates were evaluated. The experimental design was a randomized complete block with three replicates. The evaluated variables were: incidence, severity, thousand grain weight (TGW), grain yield, and yield losses. A disease index (DI) was calculated, based both on the incidence and the severity of the disease, to measure blast intensity in wheat. The sowing date significantly affected DI, TGW, and grain yield. Significant linear correlations were observed between DI and yield losses (0.89), between losses and TGW (-0.85), and between losses and grain yield (-0.93). For wheat blast, DIs greater than or equal to 0.5 indicate potential yield losses equal to or greater than 70%. The EP063030 line and the MGS Brilhante and BRS 264 cultivars are the most tolerant to blast, when exposed to high disease pressure.
Index terms: Magnaporthe oryzae, Pyricularia oryzae, Triticum aestivum,disease index, severity, tolerance.
Época de semeadura reduz a incidência da brusone do trigo
Resumo – O objetivo deste trabalho foi avaliar o efeito da época de semeadura sobre a intensidade da brusone, bem como as perdas na produtividade causada por essa doença em genótipos de trigo (Triticum aestivum). Os experimentos foram conduzidos, em 2013, na Fazenda Experimental de Sertãozinho da Empresa de Pesquisa Agropecuária de Minas Gerais (Epamig), em Patos de Minas, MG. Catorze genótipos de trigo e duas datas de semeadura foram avaliados. Utilizou-se o delineamento experimental de blocos ao acaso com três repetições. As variáveis avaliadas foram: incidência, severidade, peso de mil grãos (PMG), rendimento de grãos e perdas de produtividade. Calculou-se o índice da doença (ID), com base tanto na incidência quanto na severidade, para medir a intensidade da brusone em trigo. A data de semeadura afetou significativamente ID, PMG e rendimento de grãos. Houve forte correlação linear entre ID e danos (0,89), entre danos e PMG (-0,85) e entre danos e rendimento (-0,93). Para a brusone do trigo, IDs iguais ou maiores que 0,5 indicam potencial de danos de rendimento iguais ou superiores a 70%. A linhagem EP063030 e as cultivares MGS Brilhante e BRS 264 são as mais tolerantes à brusone quando expostas à alta intensidade da doença.
Termos para indexação: Magnaporthe oryzae, Pyricularia oryzae, Triticum aestivum, índice da doença, severidade, tolerância.
Introduction
Magnaporthe oryzae (anamorph Pyricularia oryzae) (Couch & Kohn, 2002) was first described infecting wheat (Triticum aestivum L.) spikes in the state of Paraná, Brazil, in 1985 (Igarashi et al., 1986). The symptoms of blast disease or “brusone”, caused by this pathogen, are lesions of different sizes and
When grains are produced, those located above the
infection point are deformed with low specific weights,
and the losses in yield caused by wheat blast depend on the time of infection and on the affected plant organ (Goulart et al., 2007).
Infected seeds do not show disease symptoms and, therefore, provide the initial inoculum to new areas in which wheat is cultivated (Toledo & Escobar, 2002). Airborne conidia are one of the most important means of dissemination (Urashima et al., 2007). After spore attachment to the plant surface, the spore germinates, the germ tube differentiates into an appressorium, and the appressorium is used to penetrate host tissues. The production of macroscopic lesions occurs within a 4–5 days after penetration (Ribot et al., 2008).
The best strategy to manage wheat blast disease is to combine cultivar resistance with appropriate agronomic practices (Urashima et al., 2004). The use of genetic resistance to control plant diseases is well known as the most sustainable approach; however, few wheat cultivars are resistant to the blast fungus. In experiments with 72 isolates of P. oryzae and 20 wheat varieties, BR-18 Terena was the only one that showed broad-spectrum resistance (Urashima et al., 2004). Furthermore, under controlled conditions, spikes from different wheat genotypes showed variable reaction to blast (Arruda et al., 2005; Prestes et al., 2007). It should also be noted that, for the wheat producing regions in which blast frequently occurs, most of the cultivars currently recommended are susceptible to the
pathogen under field conditions.
Among the fungicides recommended for wheat,
products for the efficient control of wheat blast are
not available, and, based on the results of studies conducted in 1990 and 1991, at most, 39% of the disease is controlled by fungicides (Goulart & Paiva, 1993). Moreover, Urashima & Kato (1994) found that sprayed applications of fungicides provided good protection in the vegetative stage but not at heading.
Therefore, wheat blast is currently difficult to control.
The incidence and intensity of the disease are
strongly influenced by environmental factors,
particularly temperature and humidity (Cardoso et al., 2008). In tropical regions, such as the municipality of Patos de Minas, in the state of Minas Gerais, Brazil, blast was extremely aggressive for wheat sown on dates from February to March in recent years. This period is the beginning of that recommended for the
sowing of wheat, which extends from February 1st
to 28th for rainfed wheat and from April 11th to May
31st for irrigated wheat (Sislegis, 2013). The potential
for yield losses caused by blast disease is generally lower for wheat sown in May than for wheat sown earlier. However, regardless of the sowing date, the susceptibility of different wheat genotypes is variable
under field conditions. Goulart et al. (2007) assessed
yield losses caused by blast in 20 cultivars and lines of wheat in two different locations and found that the losses were genotype- and site-dependent.
Historically, the major producer of wheat in Brazil is the southern region. However, this production has not
been sufficient to meet the entire domestic consumption
requirement. In recent decades, the tropical regions of the country have shown great potential for wheat cultivation, with productivity exceeding 7,000 kg per hectare (Fronza et al., 2007). However, in the past few
years, specifically in these regions, wheat blast has caused significant losses, and, as a result, research has
increased to identify genotypes that are resistant to the pathogen or that are tolerant to the disease.
The objective of this work was to assess the effect of sowing date on the intensity of wheat blast disease, as well as the yield losses caused by this disease in different wheat (Triticum aestivum) genotypes.
Materials and Methods
Two experiments were conducted at the Sertãozinho experimental station of Empresa de Pesquisa Agropecuária de Minas Gerais (Epamig) in the municipality of Patos de Minas, in the state of Minas Gerais, Brazil. Experiment one was sown on March 4th,
and the other experiment was sown on May 17th, 2013,
hereinafter, season 1 and season 2, respectively. The wheat genotypes evaluated were ten lines introduced from the International Maize and Wheat Improvement Center (CIMMYT): EP062043, EP063030, EP063044, EP063053, EP063065, EP063134, EP064021, EP064026, EP066055, and EP066066; and four cultivars: BRS 264, CD 108, MGS1 Aliança, and MGS Brilhante. The 5.0-m2 experimental plots consisted
of five rows that were 5.0 m long and spaced 20 cm
apart. The useful area per plot was 2.4 m2 and included
applied on April 8th and June 20th, at 35 and 34 days
after sowing, in seasons 1 and 2, respectively. The wheat was irrigated every 7 days at a 10-mm depth. The experiments were harvested from the 7th to the
17th of June, in season 1, and from the 5th to the 15th of
September, in season 2.
Both experiments were sown in a randomized complete block design, with three replicates and 14 treatments (genotypes). The evaluated variables were: incidence, severity, thousand grain weight (TGW), grain yield, and yield losses. For each genotype, 100 spikes were randomly collected from the useful area per plot. Blast disease incidence was obtained by counting the number of bleached spikes among the 100 spikes collected, whereas severity was estimated by visual inspection of the collected spikes to determine the percentage discolored with blast disease. Based on these data, a disease index (DI) was calculated with the formula: [(percentage of blast incidence/100) × (percentage of blast severity/100)], as proposed for Fusarium head blight (FHB), another important disease of wheat spikes (Zhang et al., 2008). Yield losses were estimated by the difference between the productivity of season 2, with low blast incidence, and the productivity of season 1, with high blast incidence, for each wheat genotype.
Statistical analyses were performed using the SAEG software (Universidade Federal de Viçosa, Viçosa, MG, Brazil). The variables DI, TGW, and grain yield were subjected to analysis of variance, and data on yield losses were subjected to analysis considering only season 1. Because of its importance to the study,
the significance of the interaction terms was examined.
The means for yield of each genotype were compared
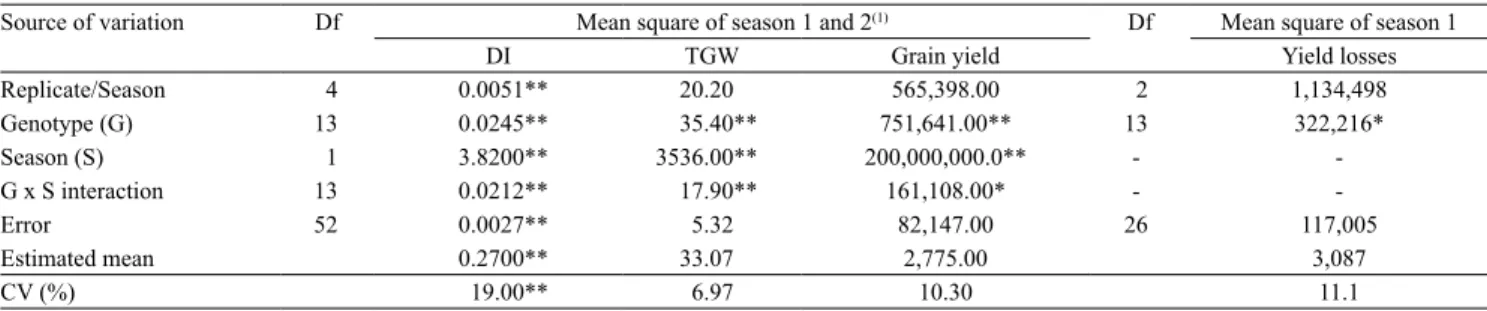
Table 1. Joint analysis of variance of main effects and interactions for disease index (DI), thousand grain weight (TGW) and grain yield, as well as analysis of variance of potential yield losses caused by head blast for different wheat (Triticum aestivum) genotypes.
Source of variation Df Mean square of season 1 and 2(1) Df Mean square of season 1
DI TGW Grain yield Yield losses Replicate/Season 4 0.0051** 20.20 565,398.00 2 1,134,498 Genotype (G) 13 0.0245** 35.40** 751,641.00** 13 322,216* Season (S) 1 3.8200** 3536.00** 200,000,000.0** - -G x S interaction 13 0.0212** 17.90** 161,108.00* - -Error 52 0.0027** 5.32 82,147.00 26 117,005 Estimated mean 0.2700** 33.07 2,775.00 3,087
CV (%) 19.00** 6.97 10.30 11.1
(1)Season 1, sowing date on March 4th, 2013; and season 2, sowing date on May 17th, 2013. * and **Significant by the F test, at 5 and 1% probability, res
-pectively.
with Tukey’s test, at 5% probability, and the means for genotype yields within a season were compared with the Scott-Knott test, also at 5% probability.
Results and Discussion
The interaction between genotype and season was
significant for most parameters, i.e., DI, TGW, and
grain yield, in both seasons, and the differences were
significant among treatments (genotypes) for yield
losses only in season 1 (Table 1).
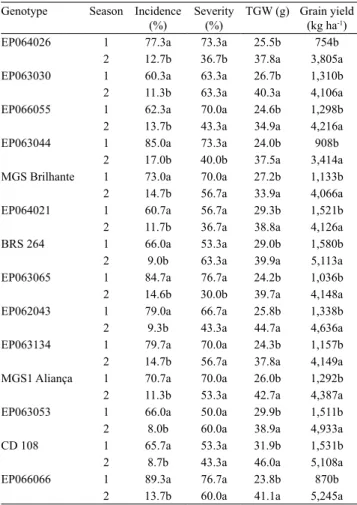
In season 2, the incidence of blast was much lower than in season 1 (Table 2). The severity of the disease
was significantly different between seasons 1 and 2
only for the EP064026, EP063044, and EP063065 lines. Because the incidence levels were lower in season 2 than in season 1, TGW and grain yield
increased significantly. However, for severity, a similar
tendency was not observed. Therefore, depending on
the wheat genotype, a significant correlation between
disease parameters (incidence and severity) was not apparent. To account for the variation between these disease parameters, a DI was proposed, which is also used by other groups investigating diseases of wheat (Zhang et al., 2008).
According to Cruz et al. (2009), the following conditions are favorable for the development of the disease: high precipitation, temperatures between 24 and 28°C, cloudy days, and high relative humidity. These authors found that the incidence of the disease advanced during two seasons with spray irrigation. In the present study, in season 1, sown in March, heading began on April 16th and harvest was done on
of highest susceptibility of the wheat spikes to fungal infection occurred from April 16th to June 8th. During
this period, the monthly mean minimum temperatures were above 14°C, the monthly maximums above 27°C, and the monthly mean relative humidity above 68%. In season 2, heading began after July 7th and the crop
was harvested on September 15th. For season 2, the
period of greatest susceptibility of the wheat spikes to fungal infection occurred from July 7th to August
29th, when the monthly mean minimum temperatures
were below 14°C, the monthly maximums above 27°C, and the monthly mean relative humidity below 60% . According to these data, the mean maximum temperatures did not affect the incidence of blast disease. However, mean minimum temperatures below 14°C and relative humidity less than 60% did
Table 2. Average blast incidence, blast severity, thousand grain weight (TGW), and grain yield for different wheat (Triticum aestivum) genotypes sown on March 4th (season 1)
and on May 17th, 2013 (season 2)(1).
Genotype Season Incidence (%)
Severity (%)
TGW (g) Grain yield (kg ha-1)
EP064026 1 77.3a 73.3a 25.5b 754b 2 12.7b 36.7b 37.8a 3,805a EP063030 1 60.3a 63.3a 26.7b 1,310b 2 11.3b 63.3a 40.3a 4,106a EP066055 1 62.3a 70.0a 24.6b 1,298b 2 13.7b 43.3a 34.9a 4,216a EP063044 1 85.0a 73.3a 24.0b 908b
2 17.0b 40.0b 37.5a 3,414a MGS Brilhante 1 73.0a 70.0a 27.2b 1,133b 2 14.7b 56.7a 33.9a 4,066a EP064021 1 60.7a 56.7a 29.3b 1,521b 2 11.7b 36.7a 38.8a 4,126a BRS 264 1 66.0a 53.3a 29.0b 1,580b 2 9.0b 63.3a 39.9a 5,113a EP063065 1 84.7a 76.7a 24.2b 1,036b 2 14.6b 30.0b 39.7a 4,148a EP062043 1 79.0a 66.7a 25.8b 1,338b 2 9.3b 43.3a 44.7a 4,636a EP063134 1 79.7a 70.0a 24.3b 1,157b 2 14.7b 56.7a 37.8a 4,149a MGS1 Aliança 1 70.7a 70.0a 26.0b 1,292b 2 11.3b 53.3a 42.7a 4,387a EP063053 1 66.0a 50.0a 29.9b 1,511b 2 8.0b 60.0a 38.9a 4,933a CD 108 1 65.7a 53.3a 31.9b 1,531b 2 8.7b 43.3a 46.0a 5,108a EP066066 1 89.3a 76.7a 23.8b 870b
2 13.7b 60.0a 41.1a 5,245a
(1)Means followed by equal letters, for each cultivar, do not differ by
Tukey’s test, at 5% probability.
contribute to a reduction in the incidence of the disease in wheat. Alves & Fernandes (2006) highlighted that the production of conidia of P. oryzae is favored when the relative humidity is high (>90%) and the temperature is approximately 28°C.
In season 1, two distinct groups of wheat genotypes,
based on TGW and grain yield, were identified (Table
3). Using the DI, the 14 evaluated genotypes were separated into three groups. The genotypes with high TGWs (EP064026, EP063030, EP066055, and EP063044) were included in the group of genotypes with high yields and low DIs, being considered the most tolerant to blast. This variability in the reaction to blast disease among wheat cultivars and lines has also been reported in other studies (Goulart et al., 2007; Prestes et al., 2007). Under controlled conditions, no cultivar was resistant to all tested isolates of P. oryzae, but cultivars did have different degrees of resistance to pathogen inoculation (Urashima et al., 2004; Prestes et al., 2007). In the present study, the highest DIs in season 1 – 0.625, 0.651, and 0.685, respectively (Table 3) – were observed for the CD 108 cultivar and the EP063053 and EP066066 lines. These genotypes were the most susceptible to the pathogen at the time of greatest incidence of the disease and, therefore, had lower TGWs and grain yields.
Table 3. Average disease index (DI), thousand grain weight (TGW), grain yield, and potential yield losses for different wheat (Triticum aestivum) genotypes sown on March 4th,
2013 (season 1)(1).
Genotype DI TWG (g) Grain yield (kg ha-1)
Yield losses(2)
(kg ha-1) (%)
EP064026 0.330c 29.9a 1,511a 3,422a 69.4 EP063030 0.345c 29.3a 1,521a 2,605b 62.8 EP066055 0.349c 31.9a 1,531a 3,577a 69.9 EP063044 0.351c 29.0a 1,580a 3,533a 69.1 MGS Brilhante 0.422c 26.7b 1,310a 2,796b 68.1 EP064021 0.493b 26.0b 1,292a 3,095b 70.0 BRS 264 0.395c 24.6b 1,298a 2,918b 69.3 EP063065 0.524b 25.8b 1,338a 3,298a 71.1 EP062043 0.511b 27.2b 1,133b 2,933b 72.0 EP063134 0.557b 24.3b 1,557b 2,992b 72.2 MGS1 Aliança 0.569b 25.5b 754b 3,052b 80.1 EP063053 0.651a 24.2b 1,036b 3,112b 74.6 CD 108 0.625a 24.0b 908b 2,506b 73.3 EP066066 0.685a 23.8b 870b 3,375a 79.4
(1)Means followed by equal letters, in the columns, belong to the same group
by the Scott-Knott test, at 5% probability. (2)Yield losses = ((season 2 grain
Based on the yield losses caused by blast disease, the genotypes were grouped into two distinct groups (Table 3). The losses of wheat genotypes were independent of TGW, grain yield, and DI. High losses (group A), were observed for the genotypes with a low DI (EP066055, EP063044, and EP064026 lines) but also for the EP066066 and EP063065 lines, which showed the highest and an intermediate DI of 0.685 and of 0.524, respectively. Plants that are disease tolerant produce good yields even when infected by pathogens (Barrett et al., 2009; Newton et al., 2010); therefore, it was inferred that the EP066055, EP063044, and EP064026 lines had little tolerance to blast disease. The group of genotypes with the lowest DI (group c), had yield losses less than 70%. Among the 14 evaluated genotypes, the EP063030 line stands out, since it was grouped among the genotypes with the highest TGWs and grain yields, and had low DI (0.345) and yield losses (2,605 kg ha-1, 62.8%).
Generally, in the literature, a reduction in grain yield is caused by an increase in disease intensity (Trindade et al., 2006; Goulart et al., 2007). In the present study, the different DIs and agronomic parameters under
high blast disease pressure reflected in variability
in the resistance and tolerance of the evaluated wheat genotypes. Besides the EP063030 line, the MGS Brilhante and BRS 264 cultivars also had low DIs and, therefore, greater resistance to the pathogen, being among the most tolerant due to reduced yield losses under high blast disease pressure (Table 3).
In the evaluation of data from the 14 genotypes and the two sowing seasons, all parameters (TGW,
grain yield, DI, and yield losses) showed significant
linear correlations (r>0.85; Table 4). TGW and grain
yield had a high positive correlation coefficient (0.91), which was explained by the influence of the diseased grains on the final weights from the plots.
The DI was negatively correlated with both TGW and grain yield (-0.89 and -0.92, respectively). In the present study, this index was proposed to assess the intensity of the disease, in which blast incidence was multiplied by blast severity for each genotype. For panicle rice blast, disease incidence is directly correlated with the severity of the disease and with yield losses (Agrios, 1988). In a previous study, a highly
significant correlation occurred between the incidence
and the severity of wheat blast on spikes (Arruda et al., 2005). Goulart et al. (2007) found a reduction in yield
losses caused by the disease, depending on the location of the point of necrosis caused by P. oryzae along the rachis. These authors also observed compensation for the reduction in weight of infected grains with the better development of grains below the necrosis point on the wheat rachis.
The incidence of a disease is more quickly and easily measured than the severity, and the determination of incidence is also generally more accurate, precise, and reproducible than that of severity (Madden et al., 2007; Copes & Stevenson, 2008). By contrast, severity is more important and useful as a measure of the intensity of a disease in assays of plant performance and yield losses to determine the effectiveness of management strategies (Madden et al., 2007). For other pathosystems, the relation between incidence and severity varies according to the genotype (Dillard & Seem, 1990; De Wolf et al., 2003; Saude et al., 2014). In addition, the estimation of mean severity from incidence is more precise at low levels of severity (Obanor et al., 2005; Paul et al., 2005). Although there is no consensus on how to quantify blast in wheat, based on this information, an index of blast disease (DI) was calculated in the present study, considering both the incidence and the severity of the disease, in which
a high DI reflected in reductions in TGW and grain
yield. Strong correlations were found between losses caused by the disease and TGW and grain yield, and between losses and the DI (Table 4). The correlation was negative between losses and TGW (-0.85) and grain yield (-0.93), and was positive between yield losses and the DI (0.89). For a DI greater than or equal to 0.5, the expected yield losses caused by wheat blast are equal to or greater than 70%. Based on these
thresholds, TGW and grain yield were significantly
reduced in response to blast.
Table 4. Coefficients of Pearson’s correlation between
thousand grain weight (TGW), grain yield, disease index, and potential yield losses caused by blast disease in different wheat (Triticum aestivum) genotypes sown on March 4th,
2013 (season 1).
TGW Grain yield
Disease index
Yield losses TGW - 0.91** -0.89** -0.85** Grain yield - -0.92** 0.93** Disease index - 0.89**
Yield losses
Among the lines and cultivars evaluated, different levels of tolerance to the pathogen were observed. However, none of the genotypes were resistant to the disease, which indicated that further studies are required to identify resistant genotypes.
Conclusions
1. The interaction between wheat (Triticum
aestivum) genotypes and sowing dates is significant for thousand grain weight, yield, and the wheat blast disease index.
2. There is a positive correlation between yield losses and the wheat blast disease index.
3. The reaction among the wheat genotypes is variable to blast disease.
4. The EP063030 line and the MGS Brilhante and BRS 264 cultivars are the most tolerant to Pyricularia oryzae under high blast disease pressure.
Acknowledgements
To Fundação de Amparo à Pesquisa de Minas Gerais (Fapemig) and to Embrapa (WheatBGIn2 project:
02.11.08.004.00.00), for financial support.
References
AGRIOS, G.N. Plant pathology. 3rd ed. Academic Press: San
Diego, 1988. 803p.
ALVES, K.J.P.; FERNANDES, J.M.C. Influência da temperatura e
da umidade relativa do ar na esporulação de Magnaporthe grisea
em trigo. Fitopatologia Brasileira, v.31, p.579-584, 2006. DOI: 10.1590/S0100-41582006000600007.
ARRUDA, M.A.; BUENO, C.R.N.C.; ZAMPROGNO, K.C.; LAVORENTI, N.A.; URASHIMA, A.S. Reação do trigo à
Magnaporthe grisea nos diferentes estádios de desenvolvimento.
Fitopatologia Brasileira, v.30, p.121-126, 2005. DOI: 10.1590/
S0100-41582005000200003.
BARRETT, L.G.; KNISKERN, J.M.; BODENHAUSEN,
N.; ZHANG, W.; BERGELSON, J. Continua of specificity
and virulence in plant host-pathogen interactions: causes and consequences. New Phytologist, v.183, p.513-529, 2009. DOI: 10.1111/j.1469-8137.2009.02927.x.
CARDOSO, C.A. de A.; REIS, E.M.; MOREIRA, E.N. Development of a warning system for wheat blast caused by
Pyricularia grisea. Summa Phytopathologica, v.34, p.216-221,
2008. DOI: 10.1590/S0100-54052008000300002.
COPES, W.E.; STEVENSON, K.L. A pictorial disease severity key and the relationship between severity and incidence for black root
rot of pansy caused by Thielaviopsis basicola. Plant Disease, v.92, p.1394-1399, 2008. DOI: 10.1094/PDIS-92-10-1394.
COUCH, B.C.; KOHN, L.M. A multilocus gene genealogy concordant with host preference indicates segregation of a new species, Magnaporthe oryzae, from M. grisea. Mycologia, v.94, p.683-693, 2002. DOI: 10.2307/3761719.
CRUZ, M.F.A.; MACIEL, J.L.N.; PRESTES, A.M.; BOMBONATTO, E.A.S.; PEREIRA, J.F.; CONSOLI, L. Caracterização genética e fenotípica de isolados de Pyricularia grisea do trigo. Tropical Plant Pathology, v.34, p.393-401, 2009. DOI: 10.1590/S1982-56762009000600005.
DE WOLF, E.D.; MADDEN, L.V.; LIPPS, P.E. Risk assessment models for wheat Fusarium head blight epidemics based on within-season weather data. Phytopathology, v.93, p.428-435, 2003. DOI: 10.1094/PHYTO.2003.93.4.428.
DILLARD, H.R.; SEEM, R.C. Incidence-severity relationships for common maize rust on sweet corn. Phytopathology, v.80, p.842-846, 1990. DOI: 10.1094/Phyto-80-842.
FRONZA, V.; SOUZA, M.A. de; MOLINA, R.M. da S.; YAMANAKA, C.H. Trigo (Triricum aestivum L.). In: PAULA JÚNIOR, T.J. de; VENZON, M. (Coord.). 101 culturas: manual de tecnologias agrícolas. Belo Horizonte: EPAMIG, 2007. p.751-762.
GOULART, A.C.P.; PAIVA, F. de A. Avaliação de fungicidas no controle da brusone (Pyricularia oryzae) do trigo (Triticum aestivum). Fitopatologia Brasileira, v.18, p.167-173, 1993.
GOULART, A.C.P.; SOUZA, P.G.; URASHIMA, A.S. Danos em trigo causados pela infecção de Pyricularia grisea. Summa
Phytopathologica, v.33, p.358-363, 2007. DOI: 10.1590/
S0100-54052007000400007.
IGARASHI, S.; UTIAMADA, C.M.; IGARASHI, L.C.; KAZUMA, A.H.; LOPES, R.S. Pyricularia em trigo. 1. Ocorrência de Pyricularia sp. no estado do Paraná. Fitopatologia Brasileira, v.11, p.351-352, 1986.
LAU, D.; SANTANA, F.M.; MACIEL, J.L.N.; FERNANDES, J.M.C.; COSTAMILAN, L.M.; CHAVES, M.S.; LIMA, M.I.P.M. Doenças de trigo no Brasil. In: PIRES, J.L.F.; VARGAS, L.; CUNHA, G.R. da (Ed.). Trigo no Brasil: bases para produção competitiva e sustentável. Passo Fundo: Embrapa Trigo, 2011. cap. 12, p.283-324.
MADDEN, L.V.; HUGHES, G.; BOSCH, F. van den. The study of
plant disease epidemics. St. Paul: APS Press, 2007. 432p.
NEWTON, A.C.; GRAVOUIL, C.; FOUNTAINE, J.M. Managing the ecology of foliar pathogens: ecological tolerance in crops.
Annals of Applied Biology, v.157, p.343-359, 2010. DOI:
10.1111/j.1744-7348.2010.00437.x.
OBANOR, F.O.; WALTER, M.; JONES, E.E.; JASPERS, M.V.
Sources of variation in a field evaluation of the incidence and
severity of olive leaf spot. New Zealand Plant Protection, v.58, p.273-277, 2005.
PRESTES, A.M.; ARENDT, P.F.; FERNANDES, J.M.C.; SCHEEREN, P.L. Resistance to Magnaporthe grisea among Brazilian wheat genotypes. In: BUCK, H.T.; NISI, J.E.; SALOMÓN, N. (Ed.). Wheat production in stressed environments. Dordrecht: Springer, 2007. p.119-124. (Developments in Plant Breeding, 12). DOI: 10.1007/1-4020-5497-1_16.
RIBOT, C.; HIRSCH, J.; BALZERGUE, S.; THARREAU, D.; NOTTEGHEM, J.-L.; LEBRUN, M.-H.; MOREL, J.-B. Susceptibility of rice to the blast fungus, Magnaporthe grisea.
Journal of Plant Physiology, v.165, p.114-124, 2008. DOI:
10.1016/j.jplph.2007.06.013.
SAUDE, C.; SIMON, P.W.; MCDONALD, M.R. Incidence and severity of cavity spot of carrot as affected by pigmentation, temperature, and rainfall. Plant Disease, v.98, p.929-936, 2014. DOI: 10.1094/PDIS-10-13-1021-RE.
SISLEGIS: sistema de consulta à legislação. 2013. Disponível em: <http://sistemasweb.agricultura.gov.br/sislegis/action/detalhaAto. do?method=abrirArvoreTematicaNew> Acesso em: 17 nov. 2014. TOLEDO, J.; ESCOBAR, R. Piricularia o bruzone del trigo. Santa Cruz: CIAT, 2002. 20p.
TRINDADE, M. da G.; SIQUEIRA, M.M.H.; SILVA, H.L.M. da; PRABHU, A.S. Danos causados por Magnaporthe grisea em
trigo. Passo Fundo: Embrapa Trigo, 2006. 9p. (Embrapa Trigo.
Comunicado técnico online, 202).
URASHIMA, A.S.; KATO, H. Varietal resistance and chemical control of wheat blast fungus. Summa Phytopathologica, v.20, p.107-112, 1994.
URASHIMA, A.S.; LAVORENT, N.A.; GOULART, A.C.P.; MEHTA, Y.R. Resistance spectra of wheat cultivars and virulence diversity of Magnaporthe grisea isolates in Brazil.
Fitopatologia Brasileira, v.29, p.511-518, 2004. DOI: 10.1590/
S0100-41582004000500007.
URASHIMA, A.S.; LEITE, S.F.; GALBIERI, R. Eficiência
da disseminação aérea em Pyricularia grisea. Summa
Phytopathologica, v.33, p.275-279, 2007. DOI: 10.1590/
S0100-54052007000300011.
ZHANG, J.X.; JIN, Y.; RUDD, J.C.; BOCKELMAN, H.E. New
Fusarium head blight resistant spring wheat germplasm identified
in the USDA National Small Grains Collection. Crop Science, v.48, p.223-235, 2008. DOI: 10.2135/cropsci2007.02.0116.