Key locations for soybean genotype assessment in Central Brazil
Roberto Miranda Pacheco(1), João Batista Duarte(1),Plínio Itamar Mello de Souza(2), Sérgio Abud da Silva(2) and José Nunes Junior(3)
(1)Universidade Federal de Goiás, Escola de Agronomia e Engenharia de Alimentos, Setor de Melhoramento de Plantas, Caixa Postal 131,
CEP 74001‑970 Goiânia, GO, Brazil. E‑mail: [email protected], [email protected] (2)Embrapa Cerrados, Caixa Postal 08223,
CEP 73310‑970 Planaltina, DF, Brazil. E‑mail: [email protected], [email protected] (3)Centro Tecnológico para Pesquisas
Agropecuárias, Rodovia BR 153, Km 4, Zona Rural, CEP 74001‑970 Goiânia, GO, Brazil. E‑mail: [email protected]
Abstract – The objective of this work was to identify key locations for the establishment of soybean (Glycine max) genetic breeding programs, in the Central Region of Brazil. Grain yield data of three maturity groups of soybean genotypes, from regional trials conducted over three years, at 18 locations in Brazilian Cerrado were used. A key location for the early phases of the breeding program was defined as the site that best classifies the winning genotypes in the region. Key locations for the final phases were defined as those sites that best represent each environmental stratum, in relation to the adaptability of the respective winning genotype. This adaptability was estimated by additive main effects and multiplicative interaction (AMMI) model analysis, using the distance between the score of each location in a stratum and the score of the winning genotype, which characterizes such stratum in an AMMI biplot. The locations that best classified the winning genotypes over space and time were Mineiros, Placas and Rio Verde. For the final phases of genotype selection, with data from the three maturity group, the recommended locations were: Buritis, Chapadão do Céu, Iraí, Pamplona, Placas, Planaltina, Rio Verde, Sacramento, Senador Canedo, Uberaba, and Uberlândia.
Index terms: Glycine max, adaptability, AMMI analysis, environmental stratification, G×E interaction.
Locais‑chave para avaliação de genótipos de soja na Região Central do Brasil
Resumo – O objetivo deste trabalho foi identificar locais‑chave para o estabelecimento de programas de melhoramento genético de soja (Glycine max), na Região Central do Brasil. Foram utilizados dados de produtividade de grãos de genótipos de soja, de três ciclos de maturação, obtidos de ensaios regionais conduzidos por três anos em 18 localidades da região. O local-chave para a condução das fases preliminares do programa foi definido como a localidade que melhor classifica os genótipos vencedores na região. Os locais‑chave para as fases finais foram definidos como os que melhor representam cada estrato ambiental identificado, em termos da adaptabilidade do respectivo genótipo vencedor. Essa adaptabilidade foi estimada por meio do modelo de efeitos principais aditivos e interação multiplicativa (AMMI), tendo-se utilizado a distância entre os pontos (escores) correspondentes a cada local em um estrato e o escore do genótipo vencedor que caracteriza aquele estrato, em um “biplot” AMMI. Os locais que melhor classificaram os genótipos vencedores ao longo do espaço e do tempo foram: Mineiros, Placas e Rio Verde. Para as fases finais de seleção de genótipos, com os dados dos três ciclos de maturação, os locais recomendados foram: Buritis, Chapadão do Céu, Iraí, Pamplona, Placas, Planaltina, Rio Verde, Sacramento, Senador Canedo, Uberaba e Uberlândia.Termos para indexação: Glycine max, adaptabilidade, análise AMMI, estratificação ambiental, interação G×E.
Introduction
Intensive management techniques for soybean (Glycine max L.) crop, allied to genetic breeding, have resulted in expressive increases in grain productivity. With the genetic breeding progress, research activities have become more expensive, requiring greater care
and technical refinement. It is, therefore, important to critically assess genotypes as for the environments targeted by the research. Thus, in the process of developing genetic materials adapted to a region, an aspect that has drawn the attention of researchers is the
genotype x environment (GE) interaction. The presence
the phenotypic variance of a set of genotypes submitted to different environmental conditions, or by the lack of correlation among genotype responses in the series of environments. The occurrence of this phenomenon can lead to overestimations of the heritability value,
because the GE interaction inflates the genotypic
variance estimates with constant overvalue of the predicted gain with selection. It can also result in productivity reduction of a region for which a general recommendation of a given cultivar is made.
Germplasm evaluations for advancement in crop breeding programs, such as advanced soybean line experiments, are commonly carried out in several
locations, under heterogeneous environmental
conditions and with a large number of genotypes. Some evaluations have shown that the subdivision of
production areas into megaenvironments is not justified,
as reported in studies with peanuts by Casanoves et al. (2005) and Putto et al. (2008), respectively for Argentina and Thailand. Studies like those conducted by Dehghani et al. (2006) and Roozeboom et al. (2008),
however, confirmed the effectiveness of the proposed subdivision for reducing GE interaction.
The production optimization in a region, where
significant GE interaction has been identified, is
related to the possibility that this region can be divided into relatively homogeneous zones, and that the best performing genotypes in each one can be designated to them. These homogeneous zones or subregions, also called as agroecological zones, are equivalent to a regionalization that has been more widely called megaenvironment (International Maize and Wheat Improvement Center, 1989). According to this concept, a megaenvironment consists of large areas, not necessarily continuous, usually international and
frequently transcontinental, defined by being similar
in terms of biotic and abiotic stress, crop system, consumer preferences etc.
Without subdivision into zones, only a cultivar of wide adaptation can be recommended, but with the
environmental stratification, the specific adaptations
of genotypes can also be exploited. In this sense, Gauch Junior & Zobel (1997) argued that although
the stratification of a crop region may imply a greater
volume of work for breeders and seed producers, it results in higher heredities and, therefore, faster genetic progress in the target area of the breeding programs. Furthermore, it leads to greater competitive capacity
among the seed producers and higher yields for the farmers.
Another important aspect comes up when
homogeneous locations are identified in a region,
because they can be redundant for the genetic breeding program. Thus, the choice of only one of these locations
for genotype testing will increase the efficiency of
the program. This kind of study characterizes the
definition of key locations, and consists of choosing a
local representative for each homogeneous subregion
identified in the environments under evaluation. Crossa
(1990) and Gauch Junior & Zobel (1997) indicated AMMI analysis as a helpful statistical tool to identify highly productive and widely adapted genotypes, as well as to identify key locations to carry out selection in plant breeding programs. Other statistical analyses, based on singular value decomposition (SVD), have been proposed, such as the genotype main effects and genotype × environment interaction (GGE) model (Yan et al., 2000, 2007; Yan & Tinker, 2005). These
papers describe some advantages of the GGE biplot
model compared to AMMI biplot. Nevertheless, recent review articles reinforce the recommendation to use the AMMI model (Gauch Junior, 2006; Gauch Junior et al., 2008).
Brazil is the second largest world producer of soybean (exceeded only by the United States) with almost
60 million tons of this grain (IBGE, 2009). About 60%
of this production comes from the Cerrado region, where about 12 million ha of soybean are grown, with an average yield of nearly 3 Mg ha-1 (higher than the national average – 2.8 Mg ha-1). Despite this national and international importance, comprehensive studies of
environmental stratification, based on GE interaction in
soybean, have not yet been developed for this region. The objective of this work was to identify key locations to carry out a soybean genetic breeding program for the Central Region of Brazil, with emphasis in the phases of preliminary line assessment
and final cultivar recommendation.
Materials and Methods
a positive aspect for inference purposes of this study, because the soybean germplasm cropped in the target region was better represented. The complete data used were presented by Pacheco (2004). The experiments were carried out in 18 locations in the Central Region of Brazil, also called Cerrado region, in the states of Goiás, Mato Grosso, Bahia, and Minas Gerais and in the Federal District (Table 1). A randomized complete block design was used in each trial, with four replicates. The treatments consisted of test lines and cultivars of soybean, whose number ranged from 23 to 28, depending on the growing year and maturity group. The plots consisted of four 5 m rows spaced at 0.5 m, and the two central rows were considered as the useful plot area, discarding 0.5 m from each end.
To define the key locations in the trial network,
the most representative ones of each stratum were sought based on the environmental clustering obtained
by Pacheco (2004). The stratification performed by
Pacheco (2004) was done according to the AMMI
analysis of GE interaction (Zobel et al., 1988; Duarte
& Vencovsky, 1999), associated to the winning genotype approach proposed by Gauch Junior (1992) and Gauch Junior & Zobel (1997). In this approach, a winning genotype was the one that attains the highest
yield in a given environment. These genotypes have,
therefore, the best specific adaptation to the stratum
that they determine, as well as agronomic stability for the locations that make up this stratum.
The key locations for the final phases of the breeding program were defined as those that should be primarily
chosen in each stratum for the genotypic assessment and selection steps, whose main purpose is to provide cultivars for the region represented by such locations. The coordinates (scores) of environments and genotypes were displayed in a graphic representation called biplot (Gabriel, 1971, 1978). These scores were
estimated by AMMI analysis, specifically from setting
the AMMI1 model, that is, with only one interaction
axis, named IPCA1. Then, for each identified stratum, the Euclidean average distances between the graphic
points related to the stratum locations and its winning genotype were obtained. The location with the lowest average distance to the winning genotype over the years was chosen preliminary as the key location for that stratum.
The indication of a key location to carry out the initial phases of the selective process (eg. generation advance) was established by ranking winning genotypes in all locations of the trial network. Thus, a key location for
these phases was defined as the one that best classified
the winning genotypes, over the years, i.e., the location that minimizes the probability of discarding winning
genotypes in the target region. For the identification of
the key location, the mean of the yield ranks of these genotypes in each location, weighted by the numbers of their wins, taking account all the locations, was used.
In order to prevent the definition of a key location only
for the initial phases of the selection process, this site
was chosen among those previously defined as key locations to carry out the final selection phases.
Results and Discussion
Location for genotype tests in the final selection phases
The environmental stratification into homogeneous groups leads to the need for identification of key
locations within these groups, where the genotype tests should be prioritized in the selection phases of the plant breeding programs.
The strata and the distances (d2vj) between each location (j) and the winning genotype (v) within each stratum and growing year are shown in Tables 2, 3, and 4
Table 1. Brazilian locations and their geographic coordinates, where the variety trials of soybean test lines and cultivars were carried out in this study(1).
(1)Latitude and longitude data were provided by Embrapa Cerrados and refer to the trial location, while altitude data were provided by IBGE (2008)
and refer to the headquarters of the closest municipality.(2)Only for late
maturity group.(3)Not for late maturity group.
Location Latitude
South
Longitude West
Altitude (m)
Anápolis, GO 16º 27 48º 57 1,017
Chapadão do Céu, GO 18º 32 52º 32 800
Cristalina, GO 16º 50 47º 36 930
Luziânia, GO 16º 16 47º 57 930
Mineiros, GO 17º 34 52º 33 980
Rio Verde, GO 17º 41 50º 55 730
Senador Canedo, GO 16º 33 49º 05 801
Correntina, BA 13º 33 44º 38 950
Placas, BA 11º 08 47º 38 780
Pamplona, DF 16º 05 47º 30 1,008
Planaltina, DF 15º 31 47º 36 1,003
Buritis, MG 15º 27 46º 25 900
Capinópolis, MG 18º 41 49º 34 950
Conquista, MG
(2)
19º 52 47º 32 830
Iraí de Minas, MG 18º 57 47º 27 975 Sacramento, MG 19º 51 47º 26 1,038 Uberaba, MG
(3)
19º 42 47º 55 781
Uberlândia, MG 19º 05 48º 16 1,012 Lucas do Rio Verde, MT 13º 09 55º 54 350
'.
'.
'.
'.
'.
'.
'.
'.
'.
'.
'.
'.
'.
'.
'.
'.
'.
'.
'.
'.
'.
'.
'.
'.
'.
'.
'.
'.
'.
'.
'.
'.
'.
'.
'.
'.
'.
(early, medium and late maturity groups, respectively). These tables also show the means of these distances in the three growing years (
_
d2vj ), for each test location. Examination of these results allows the identification of the key location, for the final phases of the genotypic
assessment related to the target populations of the genotypes and environments.
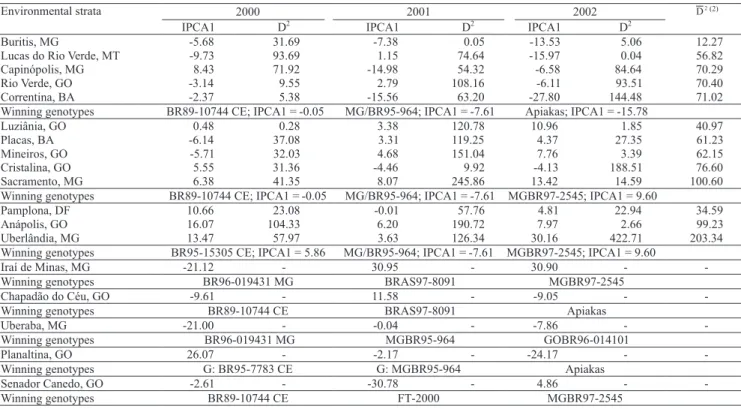
The results for the early maturity group (Table 2) show
that in the first three environmental clusters obtained,
Buritis, Luziânia, and Pamplona were the locations that most geometrically approached the winning genotype that characterized their respective strata. It was further observed that in growing year 2000, Buritis was the
third location closest to the winning genotype in the first
cluster, and showed a small distance to this genotype in 2001, as well as the second shortest distance in 2002. In the second cluster, Luziânia was the closest location to the respective winning genotype, in 2000 and 2002, and was ranked as third (very close to the second) in 2001. In the other cluster, Pamplona was geometrically
the nearest from the winning genotypes in 2000 and 2001, and was ranked as the second closest location in 2002. Based on these results, eight key locations
were chosen for the final stages of early maturity
group genotype assessment: Buritis, Luziânia, and Pamplona, reported previously, and Iraí, Chapadão do Céu, Uberaba, Planaltina, and Senador Canedo, that should also be indicated because they did not group with other locations.
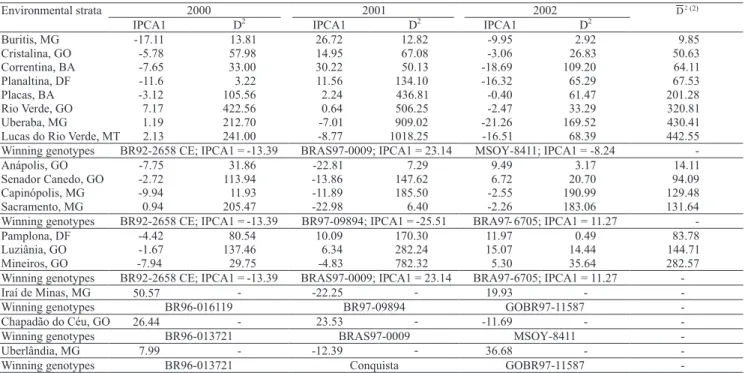
For the medium maturity group genotypes (Table 3),
also in the first three environmental clusters obtained,
it was observed that the locations Buritis, Anápolis,
and Pamplona showed the smallest mean Euclidean
distances, in relation to the winning genotypes that characterized each of these clusters. It was further
verified that, in the growing year 2000, these locations
were ranked at second place regarding their distances to the respective winner genotype, and were basically the closest in the other years, except for Anápolis, in 2001, that was also in second place, but very close to
Table 2. Environmental strata and winning genotypes with their GE interaction scores (IPCA1), estimated by AMMI analysis,
and the quadratic distances (D2) between each location and the winning genotype of the respective stratum, for the early
maturity group of soybean genotypes, in three assessment years(1).
(1)Environment stratification was performed by Pacheco (2004), according to AMMI analysis of GE interaction (Zobel et al., 1988; Duarte & Vencovsky,
1999), associated to the winning genotype approach proposed by Gauch Junior (1992) and Gauch Junior & Zobel (1997). (2)D
_
2
is the mean quadratic distance through the years.
2000 2001 2002
2 D (2) Environmental strata
IPCA1 D
2
IPCA1 D
2
IPCA1 D
2
Buritis, MG -5.68 31.69 -7.38 0.05 -13.53 5.06 12.27
Lucas do Rio Verde, MT -9.73 93.69 1.15 74.64 -15.97 0.04 56.82
Capinópolis, MG 8.43 71.92 -14.98 54.32 -6.58 84.64 70.29
Rio Verde, GO -3.14 9.55 2.79 108.16 -6.11 93.51 70.40
Correntina, BA -2.37 5.38 -15.56 63.20 -27.80 144.48 71.02
Winning genotypes BR89-10744 CE; IPCA1 = -0.05 MG/BR95-964; IPCA1 = -7.61 Apiakas; IPCA1 = -15.78
Luziânia, GO 0.48 0.28 3.38 120.78 10.96 1.85 40.97
Placas, BA -6.14 37.08 3.31 119.25 4.37 27.35 61.23
Mineiros, GO -5.71 32.03 4.68 151.04 7.76 3.39 62.15
Cristalina, GO 5.55 31.36 -4.46 9.92 -4.13 188.51 76.60
Sacramento, MG 6.38 41.35 8.07 245.86 13.42 14.59 100.60
Winning genotypes BR89-10744 CE; IPCA1 = -0.05 MG/BR95-964; IPCA1 = -7.61 MGBR97-2545; IPCA1 = 9.60
Pamplona, DF 10.66 23.08 -0.01 57.76 4.81 22.94 34.59
Anápolis, GO 16.07 104.33 6.20 190.72 7.97 2.66 99.23
Uberlândia, MG 13.47 57.97 3.63 126.34 30.16 422.71 203.34
Winning genotypes BR95-15305 CE; IPCA1 = 5.86 MG/BR95-964; IPCA1 = -7.61 MGBR97-2545; IPCA1 = 9.60
Iraí de Minas, MG -21.12 - 30.95 - 30.90 -
-Winning genotypes BR96-019431 MG BRAS97-8091 MGBR97-2545
Chapadão do Céu, GO -9.61 - 11.58 - -9.05 -
-Winning genotypes BR89-10744 CE BRAS97-8091 Apiakas
Uberaba, MG -21.00 - -0.04 - -7.86 -
-Winning genotypes BR96-019431 MG MGBR95-964 GOBR96-014101
Planaltina, GO 26.07 - -2.17 - -24.17 -
-Winning genotypes G: BR95-7783 CE G: MGBR95-964 Apiakas
Senador Canedo, GO -2.61 - -30.78 - 4.86 -
Sacramento, that showed the smallest mean distance to the respective winning genotype. In addition, it was
verified that the locations closer to the winning genotype
in 2000, Planaltina, Capinópolis, and Mineiros, in these three clusters, were fairly apart from this genotype kind in the following years, so they should not be indicated. The same fact occurred with Sacramento location, in the years in which it was not the geometrically closest location to the winning genotype (2000 and 2002).
Thus, for the final assessment phases of the medium
maturity group genotypes, six locations were chosen: Buritis, Anápolis, and Pamplona, reported previously, and Iraí, Chapadão do Céu, and Uberlândia, which did not group to other locations and showed to be environments with peculiar characteristics in the target region.
For the late maturity group (Table 4), in the first four environmental clusters identified, the IPCA1 scores of
the locations Rio Verde, Buritis, Placas, and Pamplona showed the smallest mean distances in relation to the respective winning genotypes. Although Rio Verde was not the location geometrically closest to the winning
genotype in any of the years, this site maintained a small distance in relation to the winners in the three years considered, and was , therefore, chosen. The locations that were the closest to the winning genotype in this cluster, in each year (Senador Canedo in 2000, and Mineiros in 2001 and 2002), showed great distancing at least in one year, increasing the mean distances related to the winning genotype. In the second cluster, with only two locations, Buritis was the closest one to the winners in two years (2000 and 2002); and in the third cluster, Placas was also the closest location to the respective winning genotype in two years (2000 and 2001). In the last cluster, also composed by only two locations, Pamplona was practically tied with Planaltina, in 2000, and geometrically much closer to the winner in
2001. Thus, for the final assessment phases of the late
maturity group genotypes, seven key locations were chosen: Rio Verde, Buritis, Placas, and Pamplona, plus the locations Sacramento, Iraí, and Uberaba, because they did not group to other locations.
Finally, attempts were made to identify, among the key locations chosen for each maturity group, those
Table 3. Environmental strata and winning genotypes with their GE interaction scores (IPCA1), estimated by AMMI analysis,
and the quadratic distances (D2) between each location and the winning genotype of the respective stratum, for the medium
maturity group of soybean genotypes, in three assessment years(1).
(1)Environment stratification was performed by Pacheco (2004), according to AMMI analysis of GE interaction (Zobel et al., 1988; Duarte & Vencovsky,
1999), associated to the winning genotype approach proposed by Gauch Junior (1992) and Gauch Junior & Zobel (1997). (2)D
_
2
is the mean quadratic distance through the years.
2000 2001 2002
Environmental strata
IPCA1 D
2
IPCA1 D
2
IPCA1 D
2
Buritis, MG -17.11 13.81 26.72 12.82 -9.95 2.92 9.85
Cristalina, GO -5.78 57.98 14.95 67.08 -3.06 26.83 50.63
Correntina, BA -7.65 33.00 30.22 50.13 -18.69 109.20 64.11
Planaltina, DF -11.6 3.22 11.56 134.10 -16.32 65.29 67.53
Placas, BA -3.12 105.56 2.24 436.81 -0.40 61.47 201.28
Rio Verde, GO 7.17 422.56 0.64 506.25 -2.47 33.29 320.81
Uberaba, MG 1.19 212.70 -7.01 909.02 -21.26 169.52 430.41
Lucas do Rio Verde, MT 241.00 -8.77 1018.25 -16.51 68.39 442.55
Winning genotypes BR92-2658 CE; IPCA1 = -13.39 BRAS97-0009; IPCA1 = 23.14 MSOY-8411; IPCA1 = -8.24
-Anápolis, GO -7.75 31.86 -22.81 7.29 9.49 3.17 14.11
Senador Canedo, GO -2.72 113.94 -13.86 147.62 6.72 20.70 94.09
Capinópolis, MG -9.94 11.93 -11.89 185.50 -2.55 190.99 129.48
Sacramento, MG 0.94 205.47 -22.98 6.40 -2.26 183.06 131.64
Winning genotypes BR92-2658 CE; IPCA1 = -13.39 BR97-09894; IPCA1 = -25.51 BRA97- 6705; IPCA1 = 11.27
-Pamplona, DF -4.42 80.54 10.09 170.30 11.97 0.49 83.78
Luziânia, GO -1.67 137.46 6.34 282.24 15.07 14.44 144.71
Mineiros, GO -7.94 29.75 -4.83 782.32 5.30 35.64 282.57
Winning genotypes BR92-2658 CE; IPCA1 = -13.39 BRAS97-0009; IPCA1 = 23.14 BRA97-6705; IPCA1 = 11.27
-Iraí de Minas, MG - -22.25 - 19.93 -
-Winning genotypes BR96-016119 BR97-09894 GOBR97-11587
-Chapadão do Céu, GO - 23.53 - -11.69 -
-Winning genotypes BR96-013721 BRAS97-0009 MSOY-8411
-Uberlândia, MG 7.99 - -12.39 - 36.68 -
-Winning genotypes BR96-013721 Conquista GOBR97-11587
-2.13
50.57
26.44
2
that might represent the three cycles simultaneously. It was further possible to remove two sites of the 13 key locations initially chosen throughout the region, Anápolis (medium maturity cycle) and Luziânia (early maturity cycle), that could be represented, respectively, by Senador Canedo (second smallest mean distance in its stratum, in the medium maturity group) and Placas (second smallest mean distance in its stratum, in the early maturity group). As these two locations were already part of the previous list of key locations, the total number of test points chosen as priority for the
final selection phases in the breeding program could
be reduced from 18 to 11 locations: Buritis, Pamplona, Placas, Rio Verde, Senador Canedo, Chapadão do Céu, Iraí, Uberlândia, Uberaba, Planaltina, and Sacramento.
The results obtained in this study suggest that future soybean genotype trials could be cost-effectively conducted in a few representative sites selected from
within each of the identified site groups. Recently, other
papers have shown similar opportunity to different crops in different parts of the world, like Dehghani
et al. (2009) with corn in Iran, Sanii et al. (2009) with rice in Africa, and Miranda et al. (2009) with popcorn in Brazil.
Locations for genotype tests in the initial phases of selection
The results shown in Tables 5, 6, 7, and 8 provide information related to the choosing of a key location for initial phases of the breeding program under study.
The winning genotypes with early maturity cycle
were best classified in Rio Verde, Placas, and Cristalina
(Table 5), which made these locations as putative key locations for the initial phases of selection. For the medium maturity winning genotypes, the outstanding locations were Mineiros, Placas, and Rio Verde (Table 6), which were also candidate key locations for initial phases. For the late maturity group (Table 7), the locations Chapadão do Céu, Mineiros, and Anápolis
were identified as the ones that best classified the
winning genotypes.
It was further observed that the genotypes with greater numbers of victories in the set of assessed
Table 4. Environmental strata and winning genotypes with their GE interaction scores (IPCA1), estimated by AMMI analysis,
and the quadratic distances (D2) between each location and the winning genotype of the respective stratum, for the late
maturity group of soybean genotypes, in three assessment years(1).
(1)Environment stratification was performed by Pacheco (2004), according to AMMI analysis of GE interaction (Zobel et al., 1988; Duarte & Vencovsky,
1999), associated to the winning genotype approach proposed by Gauch Junior (1992) and Gauch Junior & Zobel (1997). (2)D_ 2 is the mean quadratic distance
through the years.
2000 2001 2002
Environmental
strata IPCA1 D
2
IPCA1 D
2
IPCA1 D
2
Rio Verde, GO -5.22 24.50 1.68 7.73 0.69 5.34 12.52
Capinópolis, MG -3.10 49.98 1.31 9.92 -3.47 3.42 21.11
Anápolis, GO -5.04 26.32 8.41 15.60 7.25 31.70 24.54
Mineiros, GO 0.68 117.72 4.67 0.04 -1.70 0.01 39.26
Senador Canedo, GO -8.09 4.33 13.10 74.65 -9.92 68.89 49.29
Lucas do Rio Verde, MT 231.34 1.54 8.53 -4.51 8.35 82.74
Chapadão do Céu, GO 194.04 12.33 61.94 -11.04 88.74 114.91
Conquista, MG -3.05 50.69 16.43 143.28 12.30 193.77 129.25
Winning genotypes BR96-11552 CE; IPCA1 = -10.17 GOBR95-12203; IPCA1 = 4.46 BR97-11548; IPCA1 = -1.62
-Buritis, MG 11.96 76.75 -26.32 256.00 0.37 3.96 45.31
Luziânia, GO 5.87 220.55 -5.48 23.43 9.73 128.82 92.42
Winning genotypes MSOY-8800 (T); IPCA1 = 20.72 Uirapuru; IPCA1 = -10.32 BR97-11548; IPCA1 = -1.62
-Placas, BA -9.03 1.30 -3.03 53.14 5.75 54.32 36.25
Cristalina, GO -6.44 13.91 -23.35 169.78 -2.87 1.56 61.75
Correntina, BA -27.55 302.06 -20.29 99.40 2.62 17.98 139.81
Winning genotypes BR96-11552 CE; IPCA1 = -10.17 Uirapuru; IPCA1 = -10.32 BR97-11548; IPCA1 = -1.62
-Pamplona, DF -3.58 43.43 -4.11 38.56 -21.05 53.93 45.31
Planaltina, GO -3.71 41.73 -25.18 220.82 -24.56 17.70 92.42
Winning genotypes BR96-11552 CE; IPCA1 = -10.17 Uirapuru; IPCA1 = -10.32 BR95-28822; IPCA1 = -28.39
-Iraí de Minas, MG 40.88 - 17.06 - 18.69 -
-Winning genotypes MGBR95-20937 MGBR97-2762 GOBR97-08728
-Sacramento, MG 10.13 - 19.59 - -0.08 -
-Winning genotypes MSOY-8800 (T) GOBR97-061004 BR97-11548
-Uberaba, MG -3.45 - 11.65 - 36.29 -
-Winning genotypes BR96-11553 CE GOBR95-12203 GOBR97-08728
-5.04
3.76
2 D
locations were, frequently, identified as promising genotypes in the locations defined here as putative
key locations. For the early maturity group, among the genotypes with greater numbers of victories in each year, only MGBR97-2545 genotype, in 2002, was not
a winner in one of the candidate locations (Rio Verde), where, however, it was placed second (Table 5). For the medium maturity group, only 'MSOY-8411', also in 2002, was not the winner in one of the candidate locations (Mineiros), but was placed third (Table 6).
Table 5. Ranks of the grain yield means for the soybean winning genotypes of the early maturity group, in each location(1).
(¹)The locations are identified as: Rio Verde (Rver), Placas (Plac), Cristalina (Cris), Pamplona (Pamp), Lucas do Rio Verde (Lrve), Buritis (Buri), Uberaba
(Ubba), Luziânia (Luzi), Mineiros (Mine), Capinópolis (MG), Senador Canedo (Scan), Chapadão do Céu (Cceu), Anápolis (Anap), Sacramento (Sacr), Uberlândia (Ubrl), Correntina (Corr), Planaltina (Plan), and Iraí de Minas (Iraí).
Table 6. Ranks of the grain yield means for the soybean winning genotypes of the medium maturity group, in each location(1).
(1)Locations are identified as: Mineiros (Mine), Placas (Plac), Rio Verde (Rver), Pamplona (Pamp), Uberaba (Ubba), Capinópolis (Capi), Senador Canedo
(Scan), Lucas Do Rio Verde (Lrve), Cristalina (Cris), Luziânia (Luzi), Buritis (Buri), Planaltina (Plan), Correntina (Corr), Sacramento (Sacr), Anápolis (Anap), Uberlândia (Ubrl), Chapadão do Céu (Cceu), and Iraí de Minas (Iraí).
Winning
genotypes
Number
of wins
Rver Plac Cris PampLrve Buri Ubba Luzi Mine Capi Scan Cceu Anap Sacr Ubrl Corr Iraí
2000
BR95-15305 CE 4
BR95-7783 CE 2
BR89-10744 CE 10
BR96-019431 CE 2
Year average
Rank in the year
2001
MG/BR95-964 10
BR97-09853 2
BRAS 97-8091 3
FT-2000 3
Year average
Rank in the year
2002
MGBR97-2545 10
GOBR96-014101 3
APIAKAS 5
Year average
Rank in the year
General average Final rank 2 20 1 7 4.00 9 1 2 5 10 3.28 1 2 1 3 2.11 5 3.13 1 2 23 1 4 4.00 8 1 2 5 11 3.44 4 1 2 4 2.00 2 3.15 2 2 7 1 15 3.44 1 1 5 18 3 4.61 10 1 2 3 1.72 1 3.26 3 1 5 3 22 4.89 13 1 3 12 6 3.89 6 1 2 4 2.00 3 3.59 4 2 26 1 3 4.22 12 1 2 9 6 3.28 2 5 2 1 3.39 10 3.63 5 2 22 1 4 3.89 5 1 6 22 2 5.22 12 3 2 1 2.28 7 3.80 6 6 26 2 1 5.44 16 1 3 12 6 3.89 7 3 1 2 2.39 9 3.91 7 2 14 1 10 3.67 2 1 2 5 11 3.44 3 1 2 14 4.78 13 3.96 8 2 22 1 4 3.89 6 2 1 5 14 4.39 9 1 2 10 3.67 11 3.98 9 1 6 2 20 4.22 10 2 10 23 1 6.22 15 2 1 3 2.11 6 4.19 10 2 18 1 7 3.78 4 2 14 25 1 7.00 17 1 2 4 2.00 4 4.26 11 2 26 1 3 4.22 11 6 2 1 18 6.72 16 3 2 1 2.28 8 4.41 12 3 1 4 23 5.56 17 3 1 2 17 4.94 11 1 2 10 3.67 12 4.72 13 1 7 2 16 3.89 7 4 2 1 17 5.44 13 1 2 15 5.06 14 4.80 14 1 3 4 23 5.33 14 1 2 5 11 3.44 5 1 5 17 6.11 15 4.96 15 2 18 1 7 3.78 3 2 10 23 1 6.22 14 9 6 1 6.28 18 5.43 16 Plan 4 1 7 24 7.56 18 1 3 15 5 4.22 8 9 5 1 6.11 16 5.96 17 6 26 2 1 5.44 15 14 7 1 23 12.56 18 1 5 17 6.11 17 8.04 18 Winning genotypes Number of wins
Mine Plac Rver Pamp Ubba Capi Scan Lrve Cris Luzi Buri Plan Corr Sacr Anap Ubrl Cceu Iraí
2000 BR96-013721 MG
BRAS95-30005 CE BR96-016119 MG BR92-2658 CE
Year average 5.00 3.61 5.00 5.00 4.39 5.00 3.50 5.67 4.50 3.39 5.78 5.33 5.00 4.22 5.00 6.11 13.72 15.11
Rank in the year 7 3 8 11 5 9 2 14 6 1 15 13 12 4 10 16 17 18
2001 CONQUISTA
BR97-09894 BRAS97-0009
Year average 3.61 6.11 5.56 3.61 3.44 6.72 8.39 5.00 9.22 7.39 9.39 8.50 9.39 14.61 14.61 7.83 9.39 14.61
Rank in the year 2 6 5 3 1 7 10 4 12 8 13 11 14 16 17 15 18
2002 GOBR97-15587 BRA97-6705 MSOY-8411 2 3 1 12 5 3 10 2 5 11 20 4 26 1 2 15 1 4 1 3 9 3 26 1 8 20 1 7 2 1 20 4 26 1 6 20 1 14 2 1 20 4 26 1 2 15 1 2 1 8 7 1 26 3 1 9 3 22 12 1 20 4 26 1 1 2 11 14 2 1 8 3 26 1 1 2 14 3 1 5 17 26 15 27 14 3 1 1 2 1 7 3 26 1 12 21 1 2 1 10 24 6 26 1 15 28 1 18 6 1 23 4 26 1 13 26 1 21 10 1 20 4 26 1 15 28 1 21 10 1 6 1 25 3 2 1 25 14 2 1 20 4 26 1 2 1 25 3 1 6 1 2 6 8 1 2 13 9 1 3 15 1 5 2 19 15 28 1 19 7 1 2 5 1 21 2 1 25 1 2 10
Year average 2.56 1.94 2.72 5.39 6.39 2.72 3.67 5.72 2.72 6.61 4.28 5.72 5.72 2.72 4.28 10.11 4.67 6.78
Rank in the year 2 1 3 11 15 4 7 12 5 16 8 13 14 6 9 18 10 17
General average
3.72 3.89 4.43 4.67 4.74 4.81 5.19 5.46 5.48 5.80 6.48 6.52 6.70 7.19 7.96 8.02 9.26 12.17
Final rank 1 2 3 4 5 6 7
3 1 21 6 1 5 7 21 10 1
For the late maturity group, only BR96-1152 did not win in Chapadão do Céu, in 2000, where it was placed second (Table 7). These results show the capacity of the chosen locations to preserve by selection most of the winning genotypes.
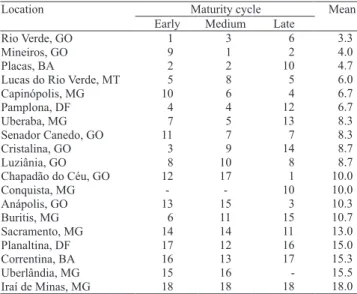
A general classification for the three maturity groups,
covering the three years of the study, is shown in Table 8.
It was verified that the locations Rio Verde, Mineiros,
and Placas were the ones that ranked better (with
lowest classification means) the winning genotype,
taking into account the three cycles. It is interesting to observe that locations which ranked badly the winning genotypes in one cycle did also, generally, the same in the others (Sacramento, Planaltina, Correntina, Uberlândia, and Iraí). This tendency was also shown in those locations that ranked well the winning genotypes, such as Rio Verde, Mineiros and Placas. Among these, Mineiros location would be discarded according to the established criteria, because it was not elected as
a key location for final assessment phases. Thus, the
recommendation for developing the initial phases of the breeding program as headquarters would be Rio Verde or Placas. The option for one or another should consider additional criteria, such as administrative or operational facilities, which are relevant for the
efficacy of breeding programs.
Finally, the method explained here to indicate key locations for the initial phases of selection has
flexibility to indicate the location that best classifies a
greater number of winners, instead of the location that
best classifies the main winning genotype (first place
in each location)
Table 7. Ranks of the grain yield means for the soybean winning genotypes of the late maturity group, in each location(1).
(¹)Locations are identified as: Chapadão do Céu (Cceu), Mineiros (Mine), Anápolis (Anap), Capinópolis (Capi), Lucas Do Rio Verde (Lrve), Rio Verde
(Rver), Senador Canedo (Scan), Luziânia (Luzi), Conquista (Conq), Placas (Plac), Sacramento (Sacr), Pamplona (Pamp), Uberaba (Ubba), Cristalina (Cris), Buritis (Buri), Planaltina (Plan), and Correntina (Corr).
Maturity cycle Mean Location
Early Medium Late
Rio Verde, GO
Mineiros, GO
Placas, BA
Lucas do Rio Verde, MT
Capinópolis, MG
Pamplona, DF
Uberaba, MG
Senador Canedo, GO
Cristalina, GO
Luziânia, GO
Chapadão do Céu, GO
Conquista, MG Anápolis, GO Buritis, MG Sacramento, MG Planaltina, DF Correntina, BA Uberlândia, MG
Iraí de Minas, MG
1 9 2 5 10 4 7 11 3 8 12 -13 6 14 17 16 15 18 3 1 2 8 6 4 5 7 9 10 17 -15 11 14 12 13 16 18 6 2 10 5 4 12 13 7 14 8 1 10 3 15 11 16 17 -18 3.3 4.0 4.7 6.0 6.7 6.7 8.3 8.3 8.7 8.7 10.0 10.0 10.3 10.7 13.0 15.0 15.3 15.5 18.0
Table 8. Rank of the locations assessed, concerning their average capacity for highlight soybean winner genotypes, in the three maturity groups.
Winning genotypes
Number of wins
Cceu Mine Anap Capi Lrve Rver Scan Luzi Conq Plac Sacr Pamp Ubba Cris Buri Plan Corr
2000 BR96-11552 CE
BR95-1985 CE MSOY-8800 (T) MGBR95-20937MG
Year average 2.11 1.78 2.56 2.28 2.17 2.56 3.78 2.72 2.28 3.89 4.22 2.56 2.56 3.22 4.28 2.56 8.50
Rank in the year 2 1 6 4 3 9 13 11 5 14 15 7 10 12 16 8 17
2001 GOBR95-12203
MGBR97-2762 GOBR97-061004 UIRAPURU
Year average 4.17 4.17 3.89 4.28 4.28 4.28 4.17 5.06 5.50 4.89 6.33 5.06 3.94 10.17 10.17 10.17 9.72
Rank in the year 4 3 1 6 7 8 5 10 12 9 13 11 2 15 16 17 14
2002 GOBR97-08728 BR97-11548 BR95-28822 11 1 5 1 8 2 1 7 3 13 2
Year average 3.06 3.56 3.33 3.33 3.56 3.67 3.39 3.67 4.17 3.56 3.83 7.50 9.94 3.56 3.61 7.50 3.50
Rank in the year 1 8 3 2 6 11 4 12 14 7 13 15 17 9 10 16 5
General average
3.11 3.17 3.26 3.30 3.33 3.50 3.78 3.81 3.98 4.11 4.80 5.04 5.48 5.65 6.02 6.74 7.24
Conclusions
1. It is possible to reduce the trial network assessed in this study from 18 to 11 key locations: Buritis, Chapadão do Céu, Iraí, Pamplona, Placas, Planaltina, Rio Verde, Sacramento, Senador Canedo, Uberaba, and Uberlândia.
2. Rio Verde or Placas should be indicated as location for developing the initial phases of the line selection process, in the present breeding program.
Acknowledgements
To Embrapa Cerrados and “Convênio Cerrados”
for providing data; to professors José Branco de
Miranda Filho, Heyder Diniz Silva, Edward Madureira
Brasil and Lázaro José Chaves, for their help in the interpretation of the results.
References
CASANOVES, F.; BALDESSARI, J.; BALZARINI, M. Evaluation
of multienvironment trials of peanut cultivars. Crop Science,v.45, p.18-26, 2005.
CROSSA, J. Statistical analyses of multilocation trials. Advances in Agronomy, v.44, p.55-85, 1990.
DEHGHANI, H.; EBADI, A.; YOUSEFI, A. Biplot analysis
of genotype by environment interaction for barley yield in Iran.
Agronomy Journal, v.98, p.388-393, 2006.
DEHGHANI, H.; SABAGHNIA, N.; MOGHADDAM, M.
Interpretation of genotype-by-environment interaction for late maize hybrids’ grain yield using a biplot method. Turkish Journal of Agriculture and Forestry,v.33, p.139-148, 2009.
GABRIEL, K.R. Least squares approximation of matrices
by additive and multiplicative models. Journal of the Royal Statistical Society Series B ‑ Methodological, v.40, p.186-196, 1978.
GABRIEL, K.R. The biplot graphic display of matrices with
application to principal component analysis. Biometrika, v.58, p.453-467, 1971.
GAUCH JUNIOR, H.G. Statistical analysis of regional yield trials: AMMI analysis of factorial designs. Amsterdam: Elsevier,
1992. 278p.
GAUCH JUNIOR, H.G. Statistical analysis of yield trials by
AMMI and GGE. Crop Science, v.46, p.1488-1500, 2006.
GAUCH JUNIOR, H.G.; PIEPHO, H.P.; ANNICCHIARICO,
P.Statistical analysis of yield trials by AMMI and GGE: further considerations. Crop Science, v.48, p.866-889, 2008.
GAUCH JUNIOR, H.G.; ZOBEL, R.W. Identifying
mega-environments and targeting genotypes. Crop Science, v.37, p.311-326, 1997.
IBGE. Base estatcart de informações municipais 2007. Rio de
Janeiro: IBGE, 2008. 1 CD‑ROM.
IBGE. Levantamento sistemático da produção agrícola. Rio de
Janeiro: IBGE, 2009. v.21. p.1‑79.
INTERNATIONAL MAIZE AND WHEAT IMPROVEMENT CENTER. CIMMYT toward the 21th century: CIMMYT’s
strategy. El Batan: CIMMYT, 1989.
MIRANDA, G.V.; SOUZA, L.V. de; GUIMARÃES, L.J.M.; NAMORATO, H.; OLIVEIRA, L.R.; SOARES, M.O. Multivariate
analyses of genotype x environment interaction of popcorn.
Pesquisa Agropecuária Brasileira, v.44, p.45-50, 2009.
PACHECO, R.M. Estratificação de ambientes em cerrados do Brasil Central para fins de seleção e recomendação de cultivares de soja. 2004. 170p. Tese (Doutorado) Universidade Federal de Goiás, Goiânia.
PUTTO, W.; PATANOTHAI, A.; JOGLOY, S.; HOOGENBOOM,
G. Determination of mega-environments for peanut breeding using the CSM-CROPGRO-peanut model. Crop Science, v.48, p.973-982, 2008.
ROOZEBOOM, K.L.; SCHAPAUGH, W.T.; TUINSTRA, M.R.; VANDERLIP, R.L.; MILLIKEN, G.A. Testing wheat in variable
environments: genotype, environment, interaction effects, and grouping test locations. Crop Science, v.48, p.317-330, 2008.
SANNI, K.A.; ARIYO, O.J.; OJO, D.K.; GREGORIO, G.; SOMADO, E.A.; SANCHEZ, I.; SIE, M.; FUTAKUCHI, K.; OGUNBAYO, S.A.; GUEI, R.G.; WOPEREIS, M.C.S. Additive
main effects and multiplicative interactions analysis of grain yield performances in rice genotypes across environments. Asian Journal of Plant Sciences,v.8, p.48-53, 2009.
YAN, W.K.; HUNT, L.A.; SHENG, Q.L.; SZLAVNICS, Z. Cultivar evaluation and mega‑environment investigation based on the GGE
biplot. Crop Science, v.40, p.597-605, 2000.
YAN, W.K.; KANG, M.S.; MA, B.L.; WOODS, S.; CORNELIUS,
P.L.GGE biplot vs. AMMI analysis of genotype‑by‑environment data. Crop Science, v.47, p.643-655, 2007.
YAN, W.K.; TINKER, N.A.An integrated biplot analysis system for displaying, interpreting, and exploring genotype x environment interaction. Crop Science, v.45, p.1004-1016, 2005.
ZOBEL, R.W.; WRIGHT, M.J.; GAUCH, H.G. Statistical analysis
of a yield trial. Agronomy Journal, v.80, p.388-393, 1988.