Pesq. agropec. bras., Brasília, v.50, n.9, p.814-820, set. 2015 DOI: 10.1590/S0100-204X2015000900010
Breeding objectives for a Nellore cattle rearing system
Caio Victor Damasceno Carvalho(1) and Thereza Cristina Calmon de Bittencourt(1)
(1)Universidade Federal da Bahia, Departamento de Zootecnia, Avenida Ademar de Barros, no 500, Ondina, CEP 40170‑110 Salvador, BA, Brazil. E‑mail: [email protected], [email protected]
Abstract – The objective of this work was to define the traits that should be included as breeding objectives for Nellore cattle, according to simulations with a bio‑economic model for rearing systems. The economic values (EVs) of the traits were calculated as the differences between the profits due to an increased performance of 1% in each trait, with the others traits remaining constant. To determine the impact of each selection on the revenue system, two scenarios were simulated based on the traits being selected. In the first scenario, the adopted selection criteria were: weaning weight (WW), weaning rate (WR), yearling weight (YW), and mature cow weight (MCW). In the second scenario, the cumulative productivity (CP) of dams was used as an indirect evaluation of the performance of calves, with all the other traits included, except WW. In the first scenario, an EV of R$ 1.44 kg‑1 was obtained for WW. In the second scenario, an EV of R$ 2.91 kg‑1 was obtained for CP.
The trait with the highest EV in both scenarios was WR, which enhanced the profits by R$ 3.21 for each 1% increased performance. The meat price paid to the producer is the factor with the greatest impact on the EVs of all examined traits.
Index terms: beef cattle, bio‑economic model, economic value, market fluctuation, selection criteria.
Objetivos do melhoramento para um sistema de cria de bovinos Nelore
Resumo – O objetivo deste trabalho foi definir as características a serem incluídas como objetivos de melhoramento para a raça Nelore, de acordo com simulações com um modelo bioeconômico para sistemas de cria. Os valores econômicos (VEs) das características foram calculados como as diferenças entre os lucros decorrentes do aumento em 1% no desempenho de cada característica, com as demais mantidas constantes. Para determinar o impacto de cada seleção sobre a receita do sistema, foram simulados dois cenários, baseados nas características em seleção. No primeiro cenário, os critérios de seleção adotados foram: peso ao desmame (PD), taxa de desmama (TD), peso ao sobreano (PS) e peso adulto da vaca (PAV). No segundo cenário, utilizou‑se a produtividade acumulada das vacas matrizes (PAC) para avaliação indireta do desempenho dos bezerros, com todas as demais características incluídas, exceto o PD. No primeiro cenário, um VE de R$ 1,44 kg‑1 foi obtido
para PD. No segundo cenário, obteve‑se VE de R$ 2,91 kg‑1 para PAC. A característica com maior VE, nos dois
cenários, foi a TD, a qual aumentou os lucros em R$ 3,21, para cada 1% de melhora no desempenho. O preço pago ao produtor pela carne é o fator com maior impacto sobre os VEs de todas as características avaliadas. Termos para indexação: gado de corte, modelo bioeconômico, valor econômico, flutuação de mercado, critérios de seleção.
Introduction
The basic premise of any industry is the generation of efficient, productive results that lead to maximized economic returns. Increased efficiency in raising beef cattle in Brazil is likely to be achieved by improving the genetic quality of livestock through selection (Brumatti et al., 2011).
For Bourdon & Golden (2000), the selection of the best animals must be linked both to genetic and economic factors. The definition of selection objectives for a combination of economically important traits should be the first step in implementing a breeding
program (Bittencourt et al., 2006; Laske et al., 2012; Pravia et al., 2014). After defining these objectives, the traits that will constitute the selection criteria must be chosen and subjected to genetic evaluations (Áby et al., 2012; Pravia et al., 2014). The selection criteria are the basis for formulating the profit equation, from which the economic values are derived (Jorge Júnior et al., 2007).
for defining breeding objectives in domestic livestock production.
Despite the increasing concerns on the economic efficiency of production systems, few studies have been conducted to evaluate the importance of breeding objectives for different breeding programs of Nellore herds in Brazil, similar to those developed by Bittencourt et al. (2006) and Jorge Júnior et al. (2007), which could assist in improving the financial performance of various farms. Moreover, new traits are constantly being sought for inclusion in breeding programs, and multifactorial traits such as the cumulative productivity of dams, proposed by Schwengber et al. (2001), have not yet been assessed as to their economic values for breeding systems.
The objective of this work was to define the traits that should be included as breeding objectives for Nellore cattle, according to simulations with a bio‑economic model for rearing systems.
Materials and Methods
In order to identify the breeding objectives for the present study, the four steps suggested by Ponzoni & Newman (1989) were followed: specification of the rearing, production, and marketing systems; identification of the sources of income and expenses; determination of biological traits that impact income and expenses; and calculation of the economic values (EVs) of each trait.
In order to specify the rearing production and marketing system, a deterministic model for herd simulations was used, which described an extensive rearing system typical of the central region of Brazil, i.e., Nellore cattle and their crosses, maintained in grass pastures of Urochloa brizantha (Estatísticas, 2012).
The adopted stocking rates were 2.0 animal units per
hectare (AU ha‑1) in summer (rainy season), and 1.0 AU ha‑1 in winter (dry season). It was assumed that
the animals consumed 2.5% of their body weight in dry forage material (Nutrient…, 2000), and received a mean daily mineral supplementation of 50 g per animal after 30 days of age and a mean of 70 g per animal a day after weaning.
As to the specifications of the reproductive system, the simulated commercial herd was considered to have a fixed number of 1,000 dams in reproduction age (until the sixth parturition), including 24‑month‑old heifers
(Figure 1). The age distribution and the specification of the number of members in the herd, as well as of the number of animals needed for replacement and of the number of animals available for sale, were all used for EV calculations.
For simulation purposes, all male calves under one year of age were sold after weaning, and the females remained on the property until they reached an average age of 550 days. Surplus heifers were then marketed, considering the same carcass yield applied to cows. The biological parameters used for the herd simulation are shown in Table 1.
To identify the sources of revenue and expenses, in addition to the biological traits that affect them, economic data – such as sales figures for animals and costs for grazing, mineral supplements, and medications – were obtained by averaging the values recorded in the Brazilian annual reports on livestock, from 2008 to 2012 (Estatísticas, 2008, 2009, 2010, 2011, 2012). Therefore, the economic data covered 5 years, which correspond to a period of change in the Brazilian and global economic environments, including changes in the values of the components involved in the production costs and in the prices passed on to the producer (Hall et al., 2013).
The total costs of ownership consisted of sanitary control (medications and vaccines), mineral supplementation, training, and pasture maintenance. Revenues were derived from the sales of calves after weaning, of surplus heifers after the breeding season, and of cows removed from the production system.
The identification of the sources of revenue and expenses is necessary to subsequently assemble the profit equations of the proposed model. Information
Figure 1. Composition of the herd used for the specifications
Pesq. agropec. bras., Brasília, v.50, n.9, p.814‑820, set. 2015 DOI: 10.1590/S0100‑204X2015000900010
on the cost and revenue components used for the simulation, as well as the compilation of the total costs by animal category in the herd, is shown in Table 2.
The primary objective of the rearing system is to produce and sell weaned calves, intended for fattening and meat production. Therefore, their weaning weight is very important economically. Besides that, the estimation of the EV of a multifunctional trait, in this case of the cumulative productivity of dams (CP) (Schwengber et al., 2001), which is actually an index composed of traits associated with cow fertility and maternal ability to wean heavier calves, was also carried out in the present study.
The CP was proposed by Schwengber et al. (2001) as a selection criterion for Nellore dams, which indicates the productivity of the dam, expressed in kilograms of calf weaned per year, and also evaluates the precocity and reproductive periodicity of these same dams, including their maternal abilities to wean heavier calves, as shown in the following equation (Grossi et al., 2008): CP = Ww x np x 365/ACBn, in which
Ww is the average weight of calves at weaning; np is
the total number of calves produced; and ACBn is the
age of cow at the last birth. Therefore, CP constitutes a complete and suitable selection criterion for use in herd breeding, since it includes both productive and reproductive traits.
The weaning rate is another trait directly linked to the production of calves that was evaluated.
Since a fixed replacement rate of 20% per year was used for dams, the system generated a surplus of heifers, which, along with the discarded dams, is also a source of revenue for the system. Therefore, the EVs were assessed for the breeding weight at a designated age of heifers, standardized to 550 days of age, and for the adult weight of cows.
The total profit of the system (Ptotal) was calculated
by applying a bio‑economic model, consisting of the following equations: Ptotal = Pcalf + Pheifer + Pcow ‑ fixed
costs; Pcalf1 = N × 0.5 × WR × [(WW × 3.72) ‑ (2 × 0.025
× WW × 0.0066 × 180) ‑ (2 × 13.98)]; Pcalf2 = [(CP × N ×
3.72) ‑ (0.025 × CP × N × 0.0066 × 180) ‑ 13.98]; Pheifer
= N × 0.5 × WR × [(YW × 0.55 × 5.49) ‑ (0.025 × YW × 0.0066 × 365) ‑ (28.94) ‑ (230/375) × (YM × 0.55 × 5.49)]; and Pcow = N × [ND ×(MCW × 0.55 × 5.09) ‑
(0.025 × MCW × 0.0066 × 365) ‑ (28.94)], in which N indicates the number of dams in reproduction; WR is the weaning rate (%); WW is the weaning weight (kg); CP is the cumulative production of dams (kg of calf weaned per cow per year); YW is the yearling weight (kg); ND is the number of discarded cows; and MCW is the mature cow weight (kg).
In the equations Pcalf1 and Pcalf2, the cost per category
was generated by averaging the costs of male and female calves (R$ 13.98). This was done because, although the female calves are not sold at weaning, the production costs for this category should still be computed, as they represent a portion of the cost of the system up to that age.
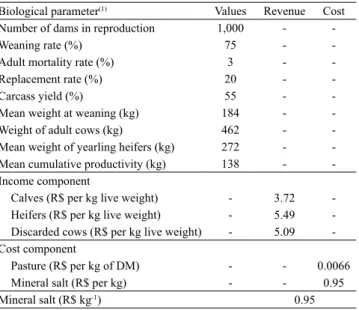
Table 1. Income and cost components, as well as biological
parameters, considered in the evaluated rearing system of Nellore cattle.
Biological parameter(1) Values Revenue Cost
Number of dams in reproduction 1,000 ‑ ‑
Weaning rate (%) 75 ‑ ‑
Adult mortality rate (%) 3 ‑ ‑
Replacement rate (%) 20 ‑ ‑
Carcass yield (%) 55 ‑ ‑
Mean weight at weaning (kg) 184 ‑ ‑
Weight of adult cows (kg) 462 ‑ ‑
Mean weight of yearling heifers (kg) 272 ‑ ‑ Mean cumulative productivity (kg) 138 ‑ ‑ Income component
Calves (R$ per kg live weight) ‑ 3.72 ‑ Heifers (R$ per kg live weight) ‑ 5.49 ‑ Discarded cows (R$ per kg live weight) ‑ 5.09 ‑ Cost component
Pasture (R$ per kg of DM) ‑ ‑ 0.0066
Mineral salt (R$ per kg) ‑ ‑ 0.95
Mineral salt (R$ kg‑1) 0.95
(1)Weaning rate, adult mortality rate, and carcass yield according to Oliveira
et al. (2006); replacement rate according to Bittencourt et al. (2006); and mean weight at weaning, weight of adult cows, mean weight of yearling heifers, and mean cumulative productivity according to Associação Na‑ cional de Criadores e Pesquisadores (2014) and to Anualpec (Estatísticas, 2008, 2009, 2010, 2011, 2012).
Table 2. Total costs (R$) by animal categories.
Treatment Male calves Female calves Heifers Cows
Medication 0.85 0.85 0.85 0.85
Vaccines 3.72 5.37(1) 3.72 3.72
Mineral salts 8.59 8.59 24.37 24.37
Annual total 13.15 14.80 28.94 28.94
Two scenarios were evaluated in the simulated rearing system, considering that the breeding objectives were to increase the fertility of the herd and to increase the selling weight of the animals. In the first scenario, the selection criteria included WW, YW, MCW, and WR, which were represented in the total profit equation
(Ptotal) by including the fraction of profit attributed to
Pcalf1, explained by an increase in the criterion when
selecting for WW. In the second scenario, the CP was used as an estimate of the production (kg) of calves in relation to the production of dams, but YW, mature cow weight (MCW), and WR were also assessed. The influences of these criteria on the total profit equation
(Ptotal) were estimated with the fraction of profit
attributed to Pcalf2, which represents this contribution
to the system’s profits associated with improvements achieved from selecting for CP.
Fixed costs were not considered in the EV calculations because the improvements in the performance associated with them prevent a reduction in herd size; therefore, fixed remain constant (Jorge Júnior et al., 2007; Laske et al., 2012).
The bio‑economic model used Microsoft Excel spreadsheets for calculating the productive performance, costs, and revenues of the traits included in the selection criteria.
The EVs were calculated as the differences between the profits after selection and the profits before selection, resulted from an increase of 1% in the genetic merit of each trait, maintaining other traits constant and a fixed number of animals (Jorge Júnior et al., 2006; Áby et al., 2012), based on the following equation: EV = MP/DGn,
in which MP indicates the marginal profit, calculated as the difference between the profits after selection and the profits before selection; and ΔGn is the marginal difference in the performance of the n trait, i.e., the genetic gain for that trait.
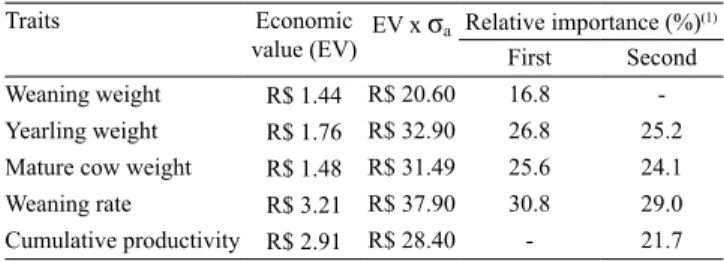
Because the traits are expressed in different units, Hietala et al. (2014) suggested that the product of the additive genetic standard deviation, multiplied by the EV, provides an index of the genetic‑economic variation, which is, therefore, a good indicator of the relative importance of the variable being considered. The relative importance, or marginal EV, was standardized by multiplying the EV by the additive genetic standard deviation obtained in the literature for Nellore cattle in Brazil: 14.27 kg for WW; 18.68 for YW; 21.28 for MCW; 9.75 for CP; and 11.80 for WR
(Boligon et al., 2008; Mercadante et al., 2004; Laske et al., 2012; Azevêdo et al., 2005). The relative EVs were expressed as the percentage (%) of the absolute total sum of the standardized EV.
Alternative production scenarios were considered in the sensitivity analysis, and the effects of variations in the cost and revenue component prices on the EVs were evaluated as in Bittencourt et al. (2006): sale price of beef, 20% increase or decrease; price per kilogram of dry matter forage, 20, 30, and 50% increase or decrease; and dry matter consumption, 20% increase or decrease.
Results and Discussion
The traits with the highest EV were obtained for WR and YW, in the simulation for the first scenario, and for WR and CP for the second scenario (Table 3). In studies conducted in Brazil with the same breed, Jorge Júnior et al. (2007) reported an EV of R$ 3.36 per 1% for WR, which was also the trait with greatest economic importance in that study. The positive impact of WR on the economic returns of production systems has also been pointed out by Laske et al. (2012), who found an EV of R$ 73.21 per 1% for the trait, and by Urioste et al. (1998), who obtained an EV of US$ 39.5 per 1% in extensive systems with Bos taurus in Uruguay.
The EV reported by Laske et al. (2012) had a relative importance of 89.5%. Although the estimates of the relative importance of WR were lower for both scenarios (Table 3), they had the largest values found for the considered system, followed by YW, also in both scenarios. The higher value attributed to WR was probably due to the greater number of calves produced with its increased performance, i.e., the increased number of production units increased the profits of the system as a whole.
The EV of WW, as well as its relative importance, was the lowest among the assessed selection criteria, in the first scenario. Bittencourt et al. (2006) obtained an EV of US$ 0.29 for the same trait, whereas Jorge Júnior et al. (2007), Brumatti et al. (2011), and Laske et al. (2012) found EVs of R$ 1.31 kg‑1, R$ 0.576 kg‑1,
and R$ 17.07 kg‑1, respectively. The values obtained in
Pesq. agropec. bras., Brasília, v.50, n.9, p.814‑820, set. 2015 DOI: 10.1590/S0100‑204X2015000900010
The economic weight of CP in the second scenario was the second largest in terms of absolute EV. Consequently, when comparing the two proposed scenarios, the selection gain is enhanced using CP and it also provides higher revenue than the direct selection based on WW. Therefore, as the estimation of CP encompasses other traits, its effectiveness in indirectly selecting for calf weights and for reproductive performance of dams is significant.
Significant economic importance in production systems has been attributed to WR and CP reproductive traits, as observed in the present study. Pravia et al. (2014) found an economic weight of US$ 237.16 for birth rate, for an increase of 1% in this trait.
As for the economic importance of YW and MCW, their EVs had positive contributions to the studied systems, with a relatively similar level of importance in both scenarios. Brumatti et al. (2011) reported an EV of R$ 1.122 kg‑1 for YW, relatively close to that estimated
here. For MCW, Jorge Júnior et al. (2007) found an EV of R$ 0.09 kg‑1 for a herd with 10,500 dams, whereas
Laske et al. (2012) obtained the closest value to the one estimated in the present study, R$ 4.75 kg‑1 for a
herd of only 28 dams. These values, as well as those calculated here, indicate positive contributions to the economic returns of the studied systems.
The difference between the estimated EV of MCW in the present study and those reported in the literature may be attributed to differences in the number of dams in the systems. In the other studies, MCW was found to be a trait of minor importance, which differs from the results obtained here. This difference may be due
to the cow value in the market during the evaluated years, given that the increase in adult weight was of no economic interest because excessively large animals have an increased demand for food, raising production costs. According to Wolfová & Wolf (2013), EVs are specific to production systems and market contexts.
The results for the sensitivity analysis (Table 4) were consistent with those reported by Jorge Júnior et al. (2007) and Laske et al. (2012), who concluded that the price paid to the producer per kg of meat is the factor that has the most impact on beef cattle production systems, regardless of the type of system adopted.
The value of the pastures varied over the years because of the increased costs of forming and maintaining them. This variable, however, did not have a large impact on the production system costs, since the dry matter (DM) production is relatively high, approximately 13.900 kg ha‑1 of U. brizantha
(Dias Filho et al., 2001), resulting in a very low cost per kg of DM; the mean cost in the present study was R$ 0.0066 per kg of DM. This value is consistent with those obtained by Bittencourt et al. (2006) and Laske et al. (2012), with costs of US$ 0.0067 and R$ 0.0206, respectively.
The variation in the costs per kg of DM and in the economic weight of this trait (20, 30, or 50% in DM costs) was not significant for the other studied traits. Bittencourt et al. (2006) reported similar results.
Jorge Júnior et al. (2007) observed a significant variation in EVs of WW, WR, and MCW in simulations considering ±20 and 40% variations in the pasture costs. These conflicting results may be attributed to the costs of forming and maintaining pastures in the different years and regions, as well as to the mean productivity of the forage species evaluated in each study.
A ±20% variation in voluntary DM intake did not significantly impact the EVs of any of the studied traits. These results may also be explained by the low value per kg of pasture, which ultimately does not increase production costs even in situations with significantly increased forage consumption.
Although they did not change the EVs of the traits, variations in the pasture costs are expected to exert some influence on the economic weight in contrasting production situations, such as with prolonged drought, which may affect the productivity and quality of pastures, or with increased input price for forming and maintaining the pastures.
Table 3. Economic values and relative importance of the
traits included in the breeding objectives.
(1)First scenario, weaning weight was the selection objective for calf
production; and second scenario, cumulative productivity was the indirect selection objective for calf production. σa, additive genetic standard
deviation.
Traits Economic
value (EV) EV x σa Relative importance (%)
(1)
First Second
Weaning weight R$ 1.44 R$ 20.60 16.8 ‑
Conclusions
1. The weaning rate has the greatest economic impact on the Nellore cattle rearing production system, followed in relative importance by the yearling weight and the mature cow weight.
2. The cumulative productivity of damns should be considered as a selection criterion for beef cattle breeding programs.
3. The meat price paid to the producer is the factor with the greatest impact on the economic values of all examined traits.
Acknowledgments
To Coordenação de Aperfeiçoamento de Pessoal de Nível Superior, for scholarship awarded.
References
ÁBY, B.A.; AASS, L.; SEHESTED, E.; VANGEN, O. A bio‑economic model for calculating economic values of traits for intensive and extensive beef cattle breeds. Livestock Science,
v.143, p.259‑269, 2012. DOI: 10.1016/j.livsci.2011.10.003. ASSOCIAÇÃO NACIONAL DE CRIADORES E PESQUISADORES. Programa Nelore Brasil. 2014. Disponível
em: <http://www.ancp.org.br/pagina/28/nelore#.U62E9XJdXnE>. Acesso em: 28 mar. 2014.
AZEVÊDO, D.M.M.R.; MARTINS FILHO, R.; LÔBO, R.N.B.; LÔBO, R.B.; MOURA, A. de A.A.N.; PIMENTA FILHO, E.C.; MALHADO, C.H.M. Produtividade acumulada (PAC) das matrizes em rebanhos Nelore do Norte e Nordeste do Brasil.
Revista Brasileira de Zootecnia, v.34, p.54‑59, 2005. DOI:
10.1590/S1516‑35982005000100007.
BITTENCOURT, T.C.C.; LÔBO, R.B.; BEZERRA, L.A.F. Objetivos de seleção para sistemas de produção de gado de corte em pasto: ponderadores econômicos. Arquivo Brasileiro de
Medicina Veterinária e Zootecnia, v.58, p.196‑204, 2006. DOI:
10.1590/S0102‑09352006000200008.
BOLIGON, A.A.; ALBUQUERQUE, L.G. de; RORATO, P.R.N. Associações genéticas entre pesos e características reprodutivas em rebanhos da raça Nelore. Revista Brasileira de Zootecnia, v.37,
p.596‑601, 2008. DOI: 10.1590/S1516‑35982008000400002. BOURDON, R.; GOLDEN, B. EPDs & economics determining the relative importance of traits. Beef Magazine, 1 Feb. 2000.
Available at: <http://beefmagazine.com/mag/beef_epds_ economics_determining>. Accessed on: 18 May 2014.
BRUMATTI, R.C.; FERRAZ, J.B.S.; ELER, J.P.; FORMIGONNI, I.B. Desenvolvimento de índice de seleção em gado de corte sob o enfoque de um modelo bioeconômico. Archivos de Zootecnia,
v.60, p.205‑213, 2011. DOI: 10.4321/S0004‑05922011000200005. DIAS‑FILHO, M.B.; DAVIDSON, E.A.; CARVALHO, C.J.R. de. Linking biogeochemical cycles to cattle pasture management and sustainability in the Amazon Basin. In: MCCLAIN, M.E.; VICTORIA, R.L.; RICHEY, J.E. (Ed.). The biogeochemistry of
the Amazon Basin. New York: Oxford University Press, 2001.
p.84‑105.
ESTATÍSTICAS. In: ANUALPEC 2008: anuário da pecuária brasileira. São Paulo: AgraFNP, 2008.
ESTATÍSTICAS. In: ANUALPEC 2009: anuário da pecuária brasileira. São Paulo: AgraFNP, 2009.
ESTATÍSTICAS. In: ANUALPEC 2010: anuário da pecuária brasileira. São Paulo: AgraFNP, 2010.
ESTATÍSTICAS. In: ANUALPEC 2011: anuário da pecuária brasileira. São Paulo: Informa Economics FNP, 2011. p.376. ESTATÍSTICAS. In: ANUALPEC 2012: anuário da pecuária brasileira. São Paulo: Informa Economics FNP, 2012.
FORMIGONI, I.B.; FERRAZ, J.B.S.; SILVA, J.A.I.I.V.; ELER, J.P.; BRUMATTI, R.C. Valores econômicos para habilidade de permanência e probabilidade de prenhez aos 14 meses em bovinos de corte. Arquivo Brasileiro de Medicina Veterinária e Zootecnia,
v.57, p.220‑226, 2005. DOI: 10.1590/S0102‑09352005000800013. GROSSI, D.A.; FRIZZAS, O.G.; PAZ, C.C.P.; BEZERRA, L.A.F.; LÔBO, R.B.; OLIVEIRA, J.A.; MUNARI, D.P. Genetic
Table 4. Sensitivity analysis used to evaluate the effects of variations in the selling price of the product (kg of calf, heifer,
or cow), in the values of the costs per kg of dry matter (DM) of pasture, and in the voluntary intake of the animals on the economic values of weaning weight (WW), yearling weight (YW), mature cow weight (MCW), weaning rate (WR), and cumulative productivity (CP).
(1)Price per kg of calf (WW, WR, and CP); kg per heifer (YW); and kg per cow (MCW).
Trait Economic
value Price paid by producer
(1) Variation in the cost per kg of DM Effect of consumption
‑ 20% + 20% ‑ 20% ‑ 30% ‑ 50% + 20% + 30% + 50% ‑ 20% + 20%
WW (R$ per kg per calf) 1.44 1.15 1.74 1.45 1.45 1.46 1.44 1.44 1.43 1.45 1.44
YW (R$ per kg per calf) 1.76 1.41 2.11 1.76 1.76 1.76 1.76 1.76 1.76 1.76 1.76
MCW (R$ per kg per cow) 1.48 1.18 1.78 1.48 1.48 1.48 1.48 1.48 1.48 1.48 1.48
WR (R$ per 1% per cow) 3.21 2.57 3.86 3.22 3.22 3.22 3.21 3.21 3.20 3.22 3.21
Pesq. agropec. bras., Brasília, v.50, n.9, p.814‑820, set. 2015 DOI: 10.1590/S0100‑204X2015000900010
associations between accumulated productivity, and reproductive and growth traits in Nelore cattle. Livestock Science, v.117,
p.139‑146, 2008. DOI: 10.1016/j.livsci.2007.12.007.
HALL, R.J.; BECK, F.; TOLEDO FILHO, J.R. de. Análise do impacto da crise subprime nas empresas do agronegócio brasileiro listadas na
BM&FBovespa. Custos e @gronegócio, v.9, p.52‑77, 2013.
HIETALA, P.; WOLFOVÁ, M.; WOLF, J.; KANTANEN, J.; JUGA, J. Economic values of production and functional traits, including residual feed intake, in Finnish milk production. Journal
of Dairy Science, v.97, p.1092‑1106, 2014. DOI: 10.3168/
jds.2013‑7085.
JORGE JÚNIOR, J.; CARDOSO, V.L.; ALBUQUERQUE, L.G. de. Modelo bioeconômico para cálculo de custos e receitas em sistemas de produção de gado de corte visando à obtenção de valores econômicos de características produtivas e reprodutivas.
Revista Brasileira de Zootecnia, v.35, p.2187‑2196, 2006. DOI:
10.1590/S1516‑35982006000700040.
JORGE JÚNIOR, J.; CARDOSO, V.L.; ALBUQUERQUE, L.G. de. Objetivos de seleção e valores econômicos em sistemas de produção de gado de corte no Brasil. Revista Brasileira de Zootecnia, v.36,
p.1549‑1558, 2007. DOI: 10.1590/S1516‑35982007000700013. LASKE, C.H.; TEIXEIRA, B.B.M.; DIONELLO, N.J.L.; CARDOSO, F.F. Breeding objectives and economic values for traits of low input family‑based beef cattle production system in the State of Rio Grande do Sul. Revista Brasileira de Zootecnia,
v.41, p.298‑305, 2012. DOI: 10.1590/S1516‑35982012000200010. MERCADANTE, M.E.Z.; RAZOOK, A.G.; TROVO, J.B. de F.; CYRILLO, J.N. dos S.G.; FIGUEIREDO, L.A. de. Parâmetros genéticos do peso no início da estação de monta, considerado
indicativo do peso adulto de matrizes Nelore. Revista Brasileira
de Zootecnia, v.33, p. 1135‑1144, 2004. DOI: 10.1590/
S1516‑35982004000500005.
NUTRIENT requirements of beef cattle. 7.ed. Washington: National Academy Press, 2000. 244p.
OLIVEIRA, R.L.; BARBOSA, M.A.A.F.; LADEIRA, M.M.; SILVA, M.M.P.; ZIVIANI, A.C.; BAGALDO, A.R. Nutrição e manejo de bovinos de corte na fase de cria. Revista Brasileira de
Saúde e Produção Animal, v.7, p.57‑86, 2006.
PONZONI, R.W.; NEWMAN, S. Developing breeding objectives for Australian beef cattle production. Animal Production, v.49,
p.35‑47, 1989. DOI: 10.1017/S0003356100004232.
PRAVIA, M.I.; RAVAGNOLO, O.; URIOSTE, J.I.; GARRICK, D.J. Identification of breeding objectives using a bioeconomic model for a beef cattle production system in Uruguay. Livestock
Science, v.160, p.21‑28, 2014. DOI: 10.1016/j.livsci.2013.12.006.
SCHWENGBER, E.B.; BEZERRA, L.A.F.; LÔBO, R.B. Produtividade acumulada como critério de seleção em fêmeas da raça Nelore. Ciência Rural, v.31, p.483‑486, 2001. DOI: 10.1590/
S0103‑84782001000300020.
URIOSTE, J.I.; PONZONI, R.W.; AGUIRREZABALA, M.; ROVERE, G.; SAAVEDRA, D. Breeding objectives for pasture‑fed Uruguayan beef cattle. Journal of Animal Breeding and
Genetics, v.115, p.357‑373, 1998. DOI: 10.1111/j.1439‑0388.1998.
tb00357.x.
WOLFOVÁ, M.; WOLF, J. Strategies for defining traits when calculating economic values for livestock breeding: a review. Animal, v.7, p.1401‑1413, 2013. DOI: 10.1017/
S1751731113001018.