ASSESSMENT OF PEDOTRANSFER FUNCTIONS FOR
ESTIMATING SOIL WATER RETENTION CURVES FOR THE
AMAZON REGION
(1)João Carlos Medeiros(2), Miguel Cooper(3), Jaqueline Dalla Rosa(2), Michel Grimaldi(4) &
Yves Coquet(5)
SUMMARY
Knowledge of the soil water retention curve (SWRC) is essential for understanding and modeling hydraulic processes in the soil. However, direct determination of the SWRC is time consuming and costly. In addition, it requires a large number of samples, due to the high spatial and temporal variability of soil hydraulic properties. An alternative is the use of models, called pedotransfer functions (PTFs), which estimate the SWRC from easy-to-measure properties. The aim of this paper was to test the accuracy of 16 point or parametric PTFs reported in the literature on different soils from the south and southeast of the State of Pará, Brazil. The PTFs tested were proposed by Pidgeon (1972), Lal (1979), Aina & Periaswamy (1985), Arruda et al. (1987), Dijkerman (1988), Vereecken et al. (1989), Batjes (1996), van den Berg et al. (1997), Tomasella et al. (2000), Hodnett & Tomasella (2002), Oliveira et al. (2002), and Barros (2010). We used a database that includes soil texture (sand, silt, and clay), bulk density, soil organic carbon, soil pH, cation exchange capacity, and the SWRC. Most of the PTFs tested did not show good performance in estimating the SWRC. The parametric PTFs, however, performed better than the point PTFs in assessing the SWRC in the tested region. Among the parametric PTFs, those proposed by Tomasella et al. (2000) achieved the best accuracy in estimating the empirical parameters of the van Genuchten (1980) model, especially when tested in the top soil layer.
Index terms: parametric PTFs, point PTFs, soil physics, soil water.
(1) Received for publication on February 26, 2013 and approved on March 26, 2014.
(2) Professor of Soil Science, Federal University of Piauí - Campus Professora Cinobelina Elvas. Rod. BR 135, km 1. CEP 64900-000 Bom Jesus (PI), Brazil. E-mail: [email protected], [email protected]
(3) Professor, Soil Science Department, Escola Superior de Agricultura "Luiz de Queiroz", University of São Paulo. Av. Pádua Dias, 11. Postal Box 9. CEP 13418-900 Piracicaba (SP), Brazil. E mail: [email protected]
(4) Researcher, UMR 211 Bioemco, Institut de Recherche pour le Développement (IRD). Bondy, France. E-mail: [email protected]
(5) Researcher, UMR 1091 INRA/AgroParisTech EGC, AgroParisTech, 78850, Thiverval-Grignon, France. E-mail: Yves.Coquet@agroparistech
DIVISÃO 2 - PROCESSOS E PROPRIEDADES
DO SOLO
RESUMO: AVALIAÇÃO DE FUNÇÕES DE PEDOTRANFERÊNCIA PARA ESTIMAR CURVAS DE RETENÇÃO DE ÁGUA DO SOLO NA REGIÃO AMAZÔNICA
O conhecimento da curva de retenção de água (CRA) é essencial para compreender e modelar os processos hidráulicos no solo. No entanto, a determinação direta do CRA consome tempo, e o custo é alto. Além disso, é necessário grande número de amostras, em razão da elevada variabilidade espacial e temporal das propriedades hidráulicas do solo. Uma alternativa é o uso de modelos, que são chamados de funções de pedotransferência (FPT), que estimam a CRA por meio de propriedades do solo de fácil determinação. O objetivo deste estudo foi testar a acurácia de 16 FPT, pontuais ou paramétricas, existentes na literatura, em diferentes solos do sul e sudeste do Estado do Pará, Brasil. As FPT testadas foram propostas por Pidgeon (1972), Lal (1979), Aina & Periaswamy (1985), Arruda et al. (1987), Dijkerman (1988), Vereecken et al. (1989), Batjes (1996), van den Berg et al. (1997), Tomasella et al. (2000), Hodnett & Tomasella (2002), Oliveira et al. (2002) e Barros (2010). Utilizou-se um banco de dados contendo textura (areia, silte e argila), densidade do solo, carbono orgânico, pH do solo, capacidade de troca catiônica e CRA. A maioria das FPT testadas não demonstrou boa acurácia para estimar as CRA. As FPT paramétricas apresentaram melhor desempenho do que as FPT pontuais em estimar a CRA dos solos na região. Entre as FPT paramétricas, as propostas por Tomasella et al. (2000) obtiveram melhor acurácia em estimar os parâmetros empíricos do modelo de van Genuchten (1980), principalmente, quando testadas na primeira camada do solo.
Termos de indexação: FPT paramétricas, FPT pontuais, física do solo, água no solo.
INTRODUCTION
The term pedotransfer function (PTF) was first introduced by Bouma (1989) to describe the statistical relationship between easy-to-measure soil properties, such as particle size distribution, bulk density (Bd), soil organic carbon (SOC), and so on, and difficult-to-measure soil hydraulic properties, such as the SWRC, hydraulic conductivity, etc. According to Vereecken et al. (2010), the PTFs can be classified into two types: parametric PTFs that estimate the empirical parameters of the SWRC (Vereecken et al., 1989; Wösten et al., 1999; Navin et al., 2009; Gould et al., 2012) and point PTFs that are used to estimate soil water content at different matric potentials (Gupta & Larson, 1979; Saxton et al., 1986; Reichert et al., 2009). Papers published in recent years highlight the usefulness of parametric PTFs (Vereecken et al., 2010) because they directly provide the required hydraulic parameters to be used in mathematical models that describe the movement of water and solutes in soil, as well as the soil-plant-atmosphere interactions.
The main techniques used to develop PTFs are described in Pachepsky & Rawls (2004); however, most of the models are based on regression analyses (Tomasella & Hodnett, 1998; Tomasella et al., 2000; Cresswell et al., 2006; Reichert et al., 2009).
In Brazil, Arruda et al. (1987) were pioneers in relating soil particle size distribution to soil water content. Later, Tomasella & Hodnett (1998) produced functions for Amazonian soils to estimate the empirical parameters of the SWRC proposed by Brooks & Corey (1964). Using data from reports of soil surveys of various locations in Brazil, Tomasella et al. (2000)
developed PTFs to estimate the empirical parameters of the van Genuchten SWRC model. In the State of Pernambuco, Brazil, Oliveira et al. (2002) developed PTFs to estimate soil moisture at field capacity (FC) and at the permanent wilting point (PWP). In that same year, Giarola et al. (2002), employing multiple regression analyses, developed PTFs relating soil particle size distribution and content of Fe and Al oxides to the volumetric water content at FC and PWP. The SWRC and the soil resistance to penetration curve were estimated by Silva et al. (2008) using PTFs having soil particle size distribution and soil carbon content as predictive variables. Reichert et al. (2009), using soil texture, SOC, Bd and soil particle density data, developed PTFs to predict soil volumetric moisture at specific matric potentials. Recently, Barros et al. (2013) presented PTFs to estimate the empirical parameters of the van Genuchten model for soils of northeastern Brazil.
MATERIAL AND METHODS
Geographical study area
The study was conducted in the southeast of the State of Pará, Brazil, in three locations, corresponding to the municipalities of Nova Ipixuna, Parauapebas, and Pacajá, with coordinates of 4o 36’ S, 49º 26’ W; 5o 45’ S, 49o 56’ W; 3º 40’ S, and 50o 56’ W, respectively (WGS 84 coordinates). The locations have a tropical rainforest climate (Kottek et al., 2006). Average annual rainfall is 1,700 mm, with a pronounced dry season lasting 4-5 months, from June to October. Average annual relative humidity is 80 % (INMET, 2012). The landscape is composed of undulating to strongly undulating plateaus developed on the crystalline rocks of the Brazilian shield (Paleoproterozoic era). There is great diversity of rock types in the study area, with predominance of magmatic rocks (granites, granodiorites) in the municipalities of Nova Ipixuna and Pacajá, and metamorphic rocks (gneisses, etc) in Parauapebas (Issler & Guimarães, 1974).
The predominant soils are Typic Hapludult, Typic Hapludox, Typic Ferrudalf, Xanthic Hapludox, Inceptisol, and Aqult (Soil Survey Staff, 2010). The natural vegetation of the region includes Dense Submontane Rain Forest, Open and Mixed Broadleaf Forests, Dense Sub-montane Forests, Plateau, and Valley (DEOF, 2011).
Sampling and data analysis
Samples were collected at three depths (0-5; 10-15, and 40-45 cm), with four replicates for depth, in 27 profiles, for a total of 67 layers, evaluating variations of horizons in the profiles (14 layers with incomplete data were discarded). Bulk samples were collected to determine soil texture, soil organic carbon (SOC), soil pH, and cation exchange capacity (CEC). Undisturbed samples were collected to determine bulk density (ρb)
and the SWRC (Table 1).
Soil texture was determined according to the method of Gee & Bauder (1986), with three laboratory replicates per sample. Soil particle sizes were separated according to the U.S. Department of Agriculture classification system: very fine sand
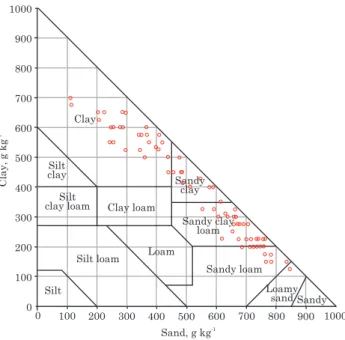
(0.05 - <0.1 mm), fine sand (0.1 - <0.25 mm), medium sand (0.25 - <0.5 mm), coarse sand (0.5 - <1 mm), very coarse sand (1 - <2 mm), total sand (0.05 - <2 mm), silt (0.002 - <0.05 mm) and clay (<0.002 mm). A wide variation of data for soil texture is observed, ranging from very clayey to coarse sandy soils; there are, however, no silt soils (Figure 1).
After homogenization, about 1 g of air-dried soil was ground and sieved through a 0.2 mm mesh. Each sample was then transferred to a small tube, placed in a desiccator to remove possible moisture, and weighed before dry combustion analysis was carried out to determine SOC. Soil pH was determined by potentiometry at a soil:water ratio of 1:2.5.
The CEC was obtained by the sum of exchangeable cations, where Ca2+ and Mg2+ were extracted with
potassium chloride and the contents of K+ and Na+
were extracted with Mehlich-1 solution (H2SO4 + HCl). Calcium and Mg2+ were determined by atomic
absorption spectrometry and K+ and Na+ by flame
photometry. Potential acidity (H+Al) was extracted
Statistic ρρρρρb Clay Silt Sand SOC CEC pH θθθθθs θθθθθr ααααα n
Mg m-3 g kg-1 cmol
c kg
-1 m3 m-3 cm-1
Average 1.36 390 80 530 11 3.6 5.7 0.48 0.10 0.08 1.29
Minimum 0.98 130 34 110 3 1.3 3.9 0.33 0,01 0.01 1.07
Maximum 1.63 700 210 850 23 7.8 8.1 0.63 0.33 0.90 1.62
SD 0.14 170 49 200 5 1.7 1.0 0.07 0.11 0.19 0.16
Number 67 67 67 67 67 27 27 67 67 67 67
Table 1. Descriptive statistics for soils from 67 layers used to test the selected PTFs
ρb: Bulk density; SOC: soil organic carbon; CEC: cation exchange capacit; θS and θr: saturation and residual volumetric water content (adjusted), respectively: α and n: empirical parameters of the van Genuchten (1980) model; SD: standard deviation.
Silt clay
Silt
clay loam Clay loam
Loam Clay
Silt loam
Silt
Sandy loam Sandy
clay
Sandy clay loam
Sandy Loamy
sand 1000
900
800
700
600
500
400
300
200
100
0
0 100 200 300 400 500 600 700 800 900 1000
Sand, g kg-1
Clay, g kg
-1
with calcium acetate at pH 7.0 and determined by titration with 0.05 mol L-1 NaOH.
The ρb was determined using cylinders of 5 × 5 cm
(diameter and height) according to the method described in Blake & Hartge (1986). To determine the SWRC, the samples were subjected to nine matric potentials: 0, -1, -3, -6, -10, -33, -100, -300, and -1500 kPa, according to the method described in Klute (1986). The water content measured at each potential was the mean of four replicates. Each SWRC was then fitted to the van Genuchten (1980) model: θ(ψ) = (θs - θr)
(1 + (α*ψ)n)-m + θ
r), using the RETC program (van
Genuchten et al., 1991) with the parameter m = 1-1/n, as proposed by Mualem (1976).
Description of the PTFs
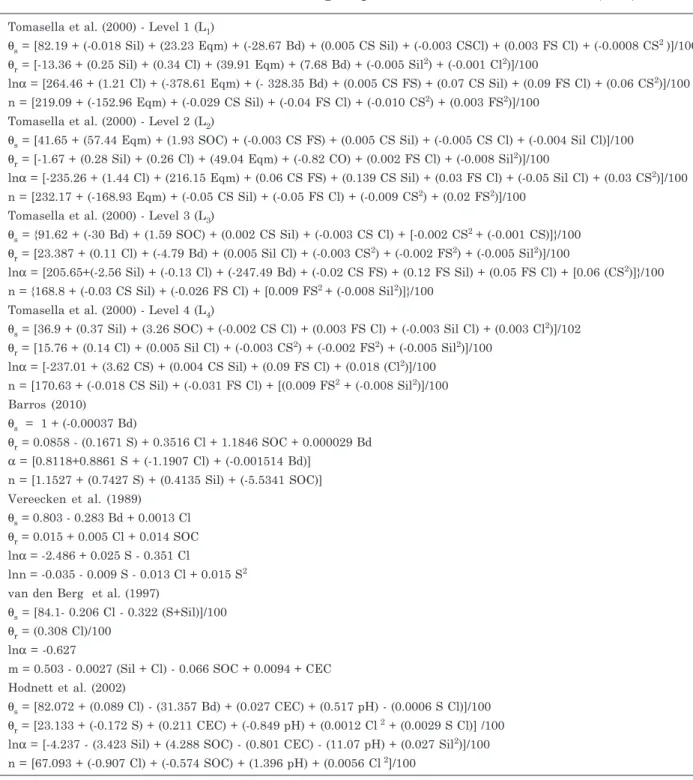
Sixteen PTFs were selected for testing. Eight PTFs are parametric (Table 2) and were proposed by Vereecken et al. (1989), “Vereecken PTFs”; van den Berg (1997), “van den Berg-1 PTFs”; Tomasella et al. (2000) - level 1, 2, 3, and 4, “Tomasella PTFs”; Hodnett & Tomasella (2002), “Hodnett PTFs”; and Barros (2010), “Barros PTFs”. The other nine are point PTFs (Table 3) and were proposed by Lal (1979), “Lal PTFs”; Aina & Periaswamy (1985), “Aina PTFs”; Batjes (1996), “Batjes PTFs”; van den Berg et al. (1997), “van den Berg-2 PTFs”; Pidgeon (1972), “Pidgeon PTFs”; Arruda et al. (1987), “Arruda PTFs”; Dijkerman (1988), “Dijkerman PTFs”; and Oliveira et al. (2002), “Oliveira PTFs”. These point PTFs can predict either volumetric or gravimetric water content (Table 3).
Data for pH and CEC were measured only for the first layer. The PTFs that required pH and CEC as predictors (van den Berg-1 and Hodnett PTFs) were compared to the Tomasella PTFs for the samples representing the first layer (0-5 cm), and these results were discussed separately from those that had been estimated by the other PTFs.
Indicators used to assess the accuracy of the PTFs
The indices used to evaluate the accuracy of the PTFs were the mean error (ME), the root mean square error (RMSE), and the coefficient of determination (R2),
represented by equations 1, 2, and 3 below, respectively. In addition, the confidence index (CI) was calculated according to Camargo & Sentelhas (1987), as described in equations 4-6. CI is the product of the Willmott (w) index, given by equation 5, and the Pearson correlation coefficient (r), given by equation 6.
(
)
å
=-= n
i Oi Ei
n ME 1 1 (1)
(
)
å
=-= n
i Oi Ei
n RMSE 1 2 1 (2)
(
)
(
)
å
= -å
=-= n
i
n i i i O
/
O OE R 1 1 2 2 2 (3)
Cl = r * w (4)
(
)
(
)
21 1 1 2 1 úû ù êë
é - +
-=
å
å
å
= = = n i n i i i n i i O O E E O E W (5)(
)(
)
(
)
(
)
051 1 2 2 1 , n i n i i i n
i i i
O O E E O O E E r úû ù êë
é - +
-=
å
å
å
= = = (6)in which n represents the number of observations, Oi the observed (measured) water content values, Ei the estimated (predicted) water content values, and E and
O the mean values of estimated and measured water content.
The ME represents the systematic error in the regression model. The remaining error is attributed to the variance of the model (Baker, 2008). The closer the ME value is to zero, the better the performance of the PTF. Likewise, PTF performance also increases when the calculated RMSE approaches zero (Pachepsky & Rawls, 2004). The R² indicates how the variance of the estimated variable is explained by the variance of the observed variable. The predictive capacity of the PTFs increases with the increase in R2. The CI values were interpreted as proposed by
Camargo & Sentelhas (1987): CI > 0.85 = optimum PTF accuracy; CI from 0.85 to 0.76 = very good; CI
from 0.75 to 0.66 = good; CI from 0.65 to 0.61 = average; CI from 0.60 to 0.51 = tolerable; CI from 0.50 to 0.41 = bad; and CI 0.40 = very bad.
RESULTS AND DISCUSSION
The soil samples showed high amplitude of soil bulk density (ρb), soil texture (clay and sand content),
and SOC values, as well as a wide range of values for the parameters of the van Genuchten (1980) model. In general, the soil types in the study location are sandy clay and sandy clay loam (Figure 1), which reflects the low residual water content values (θr), i.e.,
low capacity for retaining water at high matric potentials.
Assessment of parametric PTFs for the total data set (all depths)
the best performance, with a CI classified as “good” for eight of the nine selected potentials, were the Tomasella PTFs, levels 1 and 2 (L1 and L2, Figure 2). The performances of these two PTFs were similar. The L1 PTF, which uses Bd, clay, silt, fine and coarse
sand fractions, and so-called “equivalent moisture” (water content measured at -33 kPa) as predictors, had a slightly higher CI than the L2 PTF, whose
predictors are identical to those of the L1 PTF, with
the exception of Bd, which is replaced by SOC. The L3
and L4 PTFs showed unsatisfactory CI performance (Figure 2). Equivalent moisture does not enter as a predictive variable in these two PTFs, which use only texture, Bd, and SOC as predictive variables. Overall, it is observed that the PTFs that use more variables to estimate the SWRC parameters have higher
Tomasella et al. (2000) - Level 1 (L1)
θs = [82.19 + (-0.018 Sil) + (23.23 Eqm) + (-28.67 Bd) + (0.005 CS Sil) + (-0.003 CSCl) + (0.003 FS Cl) + (-0.0008 CS2 )]/100 θr = [-13.36 + (0.25 Sil) + (0.34 Cl) + (39.91 Eqm) + (7.68 Bd) + (-0.005 Sil2) + (-0.001 Cl2)]/100
lnα = [264.46 + (1.21 Cl) + (-378.61 Eqm) + (- 328.35 Bd) + (0.005 CS FS) + (0.07 CS Sil) + (0.09 FS Cl) + (0.06 CS2)]/100 n = [219.09 + (-152.96 Eqm) + (-0.029 CS Sil) + (-0.04 FS Cl) + (-0.010 CS2) + (0.003 FS2)]/100
Tomasella et al. (2000) - Level 2 (L2)
θs = [41.65 + (57.44 Eqm) + (1.93 SOC) + (-0.003 CS FS) + (0.005 CS Sil) + (-0.005 CS Cl) + (-0.004 Sil Cl)]/100 θr = [-1.67 + (0.28 Sil) + (0.26 Cl) + (49.04 Eqm) + (-0.82 CO) + (0.002 FS Cl) + (-0.008 Sil2)]/100
lnα = [-235.26 + (1.44 Cl) + (216.15 Eqm) + (0.06 CS FS) + (0.139 CS Sil) + (0.03 FS Cl) + (-0.05 Sil Cl) + (0.03 CS2)]/100 n = [232.17 + (-168.93 Eqm) + (-0.05 CS Sil) + (-0.05 FS Cl) + (-0.009 CS2) + (0.02 FS2)]/100
Tomasella et al. (2000) - Level 3 (L3)
θs = {91.62 + (-30 Bd) + (1.59 SOC) + (0.002 CS Sil) + (-0.003 CS Cl) + [-0.002 CS2 + (-0.001 CS)]}/100 θr = [23.387 + (0.11 Cl) + (-4.79 Bd) + (0.005 Sil Cl) + (-0.003 CS2) + (-0.002 FS2) + (-0.005 Sil2)]/100
lnα = [205.65+(-2.56 Sil) + (-0.13 Cl) + (-247.49 Bd) + (-0.02 CS FS) + (0.12 FS Sil) + (0.05 FS Cl) + [0.06 (CS2)]}/100 n = {168.8 + (-0.03 CS Sil) + (-0.026 FS Cl) + [0.009 FS2 + (-0.008 Sil2)]}/100
Tomasella et al. (2000) - Level 4 (L4)
θs = [36.9 + (0.37 Sil) + (3.26 SOC) + (-0.002 CS Cl) + (0.003 FS Cl) + (-0.003 Sil Cl) + (0.003 Cl2)]/102 θr = [15.76 + (0.14 Cl) + (0.005 Sil Cl) + (-0.003 CS2) + (-0.002 FS2) + (-0.005 Sil2)]/100
lnα = [-237.01 + (3.62 CS) + (0.004 CS Sil) + (0.09 FS Cl) + (0.018 (Cl2)]/100 n = [170.63 + (-0.018 CS Sil) + (-0.031 FS Cl) + [(0.009 FS2 + (-0.008 Sil2)]/100 Barros (2010)
θs = 1 + (-0.00037 Bd)
θr = 0.0858 - (0.1671 S) + 0.3516 Cl + 1.1846 SOC + 0.000029 Bd α = [0.8118+0.8861 S + (-1.1907 Cl) + (-0.001514 Bd)]
n = [1.1527 + (0.7427 S) + (0.4135 Sil) + (-5.5341 SOC)] Vereecken et al. (1989)
θs = 0.803 - 0.283 Bd + 0.0013 Cl θr = 0.015 + 0.005 Cl + 0.014 SOC lnα = -2.486 + 0.025 S - 0.351 Cl
lnn = -0.035 - 0.009 S - 0.013 Cl + 0.015 S2 van den Berg et al. (1997)
θs = [84.1- 0.206 Cl - 0.322 (S+Sil)]/100 θr = (0.308 Cl)/100
lnα = -0.627
m = 0.503 - 0.0027 (Sil + Cl) - 0.066 SOC + 0.0094 + CEC Hodnett et al. (2002)
θs = [82.072 + (0.089 Cl) - (31.357 Bd) + (0.027 CEC) + (0.517 pH) - (0.0006 S Cl)]/100 θr = [23.133 + (-0.172 S) + (0.211 CEC) + (-0.849 pH) + (0.0012 Cl 2 + (0.0029 S Cl)] /100 lnα = [-4.237 - (3.423 Sil) + (4.288 SOC) - (0.801 CEC) - (11.07 pH) + (0.027 Sil2)]/100 n = [67.093 + (-0.907 Cl) + (-0.574 SOC) + (1.396 pH) + (0.0056 Cl 2]/100
Table 2. Parametric PTFs selected for estimating the parameters of the van Genuchten (1980) function
Eqm: equivalent moisture (m3 m-3); Bd: bulk density (Mg m-3); SOC: soil organic carbon (g kg -1); CS: coarse sand (g kg-1); FS: Fine sand (g kg-1); Cl: clay (g kg-1); S: Sand (g kg-1); Sil: silt (g kg-1); CEC: cation exchange capacity (cmol
efficiency (Table 4). This is confirmed by the performance of the various PTFs proposed by Tomasella et al. (2000), and by comparing the Barros and Vereecken PTFs.
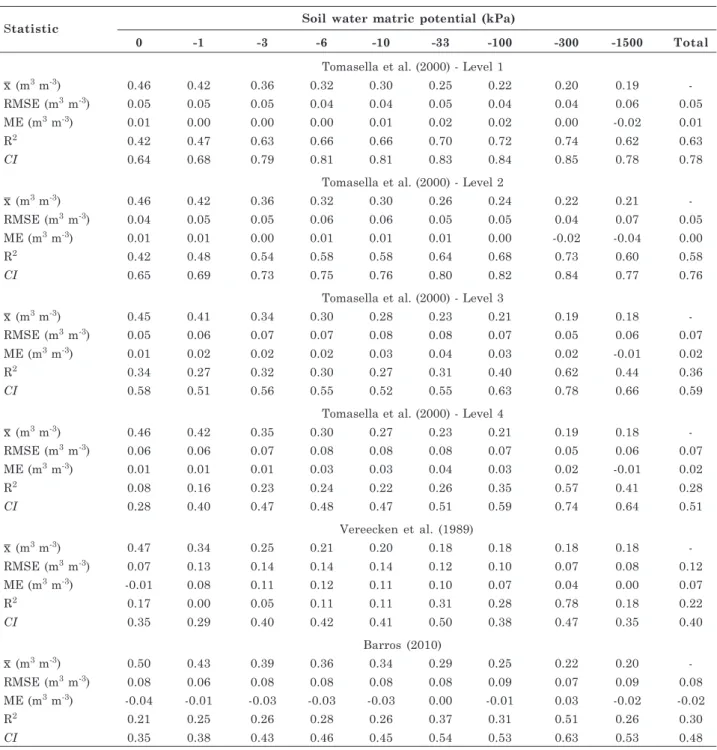
The CI values using the criteria proposed by Camargo & Sentelhas (1997) indicate that the Tomasella PTFs have “very good” performance for the L1 and “good” performance for the L2 (Table 4). However,
for the L3 and L4 levels, performance was rated “poor”. The Barros PTFs were classified as “poor” (CI = 0.48), while Vereecken PTFs had the lowest CI values (0.40) and were classified as “bad” (Table 4). The evaluation of the PTFs for the total data set showed that the Tomasella PTFs had better overall performance than the Barros PTFs and the Vereecken PTFs.
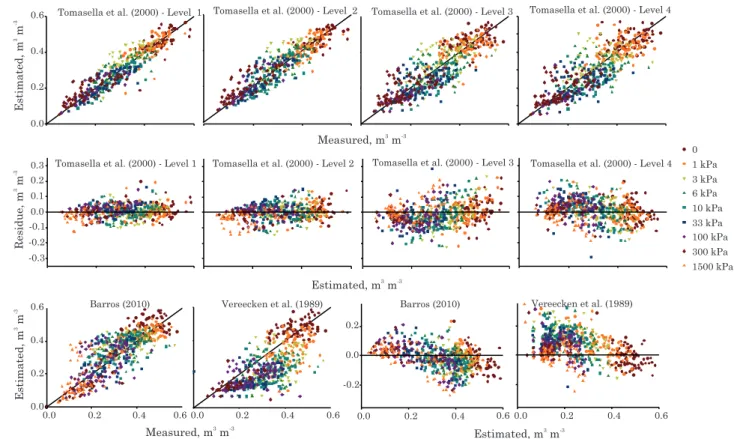
When the estimated data are plotted against the measured data (Figure 3), it is observed that the grouping of the points around the 1:1 line is
increasingly better when moving from the Tomasella PTF L4 to PTF L1, which confirms the better efficiency
of PTF L1. The Vereecken PTFs showed the highest dispersion around the 1:1 line, producing the worst predictive performance among all the parametric PTFs being tested.
The better predictive capacity of levels 1 and 2 of the Tomasella PTFs is probably related to inclusion of the water content value at the -33 kPa matric potential as an independent variable in the model. This result is consistent with the results of Cresswell & Paydar (2000) and Schaap et al. (2001), who showed that PTF performance was greatly improved when including measurement points of the SWRC as predictive variables. However, the determination of this value using undisturbed samples with volumetric rings is costly and time consuming, which limits its use in a practical and generalized way. Another point that justifies the good performance of the Tomasella PTFs is the fact that these PTFs were developed from soils from various regions of Brazil, including several soils from the Amazon region. The good performance presented by the Tomasella PTFs has also been observed in other studies. Medina et al. (2002) tested several PTFs in soils from Cuba and obtained a better performance of the ME and RMSE values, -0.02 and 0.06 (m3 m-3), respectively, for the L
4 PTFs. The poor
performance shown by the Barros PTFs is justified by the fact that these PTFs were designed to predict the empirical parameters of the van Genuchten model for soils of the Brazilian Cerrado (tropical savanna). According to the author, these soils generally have low SOC and clay content in their compositions, but high rb values. For the Vereecken PTFs, a tendency
to underestimate the moisture values is observed, especially in the central potentials of the SWRC. This fact is related to the low capacity of the function in estimating the shape parameters of the SWRC (α and n), responsible for the accuracy of the water content predictions near the inflection point of the SWRC. This unsatisfactory result is probably related to the fact that these PTFs were developed for temperate soils (soils from Belgium). Tomasella et al. (2003) had already demonstrated the low predictive ability of the PTFs developed for temperate soils when used on soils from tropical regions. The authors asserted that the performance of these PTFs is affected mainly by the difference in silt content between soil types from different regions. Botula et al. (2012) also found that temperate PTFs in hydrological models for studies in the humid tropics can substantially reduce the quality of the results.
Assessment of parametric PTFs for the surface layer (0-5 cm)
As pH and CEC measurements were available only for the 0-5 cm topsoil, van den Berg-1 and Hodnett PTFs could be tested for this particular soil layer only. The statistical indicators of the performance of these PTFs are shown in table 5 together with those of the Point PTF for volumetric water content estimation
Lal (1979)
θ10 = 0.102 + 0.003 Cl θ33 = 0.065 + 0.004 Cl θ1500 = 0.006 + 0.003 Cl Aina & Periaswamy (1985) θ33 = 0.6788 - 0.0055 S - 0.0013 Bd θ1500 = 0.00213 + 0.0031 Cl Batjes (1996)
θ10 = (0.5266 Cl + 0.3999 Sil + 3.1752 SOC)/100 θ33 = (0.46 Cl + 0.3045 Sil + 2.0703 SOC)/100 θ1500 = (0.3624 Cl + 0.117 Sil + 1.6054 SOC)/100 van den Berg et al. (1997)
θ33 = 0.1088 + 0.00347 Cl + 0.00211 Sil + 0.01756 SOC θ1500 = 0.00383 + 0.00272 Cl + 0.00212 Sil
Point PTFs for gravimetric water content estimation Pidgeon (1972)
W10 = (100 FC - 2.54)/91 W33 = (100 FC - 3.77)/95
W1500 = -0.0419 + 0.0019 Sil + 0.0039 Cl + 0.009 SOC Arruda et al. (1987)
W33 = [3.07439 + 0.629239 (Sil + Cl) - 0.00343813 (Sil + Cl)2]/100 W1500 = {398.889 (Sil + Cl)/[1308.09 + (Sil + Cl)]}/100 Dijkerman (1988)
W33 = 0.3697 - 0.0035 S W1500 = 0.0074 + 0.0039 Cl Oliveira et al. (2002)
W33 = 0.00333 Sil + 0.00387 Cl
W1500 = 0.00038 S + 0.00153 Sil + 0.00341 Cl - 0.030861 Bd Table 3. Point PTFs selected for estimating water
content at specific matric potentials
Cl: clay (g kg-1); S: Sand (g kg-1); Sil: silt (g kg-1); Bd: bulk density (Mg m-3); CEC: cation exchange capacity (cmol
Tomasella PTFs. It is worth noting that the four Tomasella PTFs (L1 to L4) performed better than the
van den Berg-1 and Hodnett PTFs. Furthermore, among the four Tomasella PTFs, an increase in the PTF level reduced its predictive capacity, as was observed for the total data set. An analysis of the Tomasella PTFs tested for the two data sets (total and surface layer) showed that, in general, the PTFs tested for the surface layer had a better performance (Tables 4 and 5, Figures 2 and 4). The function developed
by Tomasella (L1) had a “very good” CI when tested for
the three depths (Table 4), and an “excellent” CI when tested for the surface layer only (Table 5). This same trend was observed for the other Tomasella PTFs.
The performance indicators for the Hodnett PTFs showed low accuracy. On average, considering matric potentials, the Hodnett PTFs was ranked as having a “average” performance (Table 5). The van den Berg-1 PTFs had ME and RMSE values higher than those observed for the Hodnett PTFs, except for the dry part
Statistic Soil water matric potential (kPa)
0 -1 -3 -6 -10 -33 -100 -300 -1500 Total
Tomasella et al. (2000) - Level 1
x
– (m3 m-3) 0.46 0.42 0.36 0.32 0.30 0.25 0.22 0.20 0.19
-RMSE (m3 m-3) 0.05 0.05 0.05 0.04 0.04 0.05 0.04 0.04 0.06 0.05
ME (m3 m-3) 0.01 0.00 0.00 0.00 0.01 0.02 0.02 0.00 -0.02 0.01
R2 0.42 0.47 0.63 0.66 0.66 0.70 0.72 0.74 0.62 0.63
CI 0.64 0.68 0.79 0.81 0.81 0.83 0.84 0.85 0.78 0.78
Tomasella et al. (2000) - Level 2
x
– (m3 m-3) 0.46 0.42 0.36 0.32 0.30 0.26 0.24 0.22 0.21
-RMSE (m3 m-3) 0.04 0.05 0.05 0.06 0.06 0.05 0.05 0.04 0.07 0.05
ME (m3 m-3) 0.01 0.01 0.00 0.01 0.01 0.01 0.00 -0.02 -0.04 0.00
R2 0.42 0.48 0.54 0.58 0.58 0.64 0.68 0.73 0.60 0.58
CI 0.65 0.69 0.73 0.75 0.76 0.80 0.82 0.84 0.77 0.76
Tomasella et al. (2000) - Level 3
x
– (m3 m-3) 0.45 0.41 0.34 0.30 0.28 0.23 0.21 0.19 0.18
-RMSE (m3 m-3) 0.05 0.06 0.07 0.07 0.08 0.08 0.07 0.05 0.06 0.07
ME (m3 m-3) 0.01 0.02 0.02 0.02 0.03 0.04 0.03 0.02 -0.01 0.02
R2 0.34 0.27 0.32 0.30 0.27 0.31 0.40 0.62 0.44 0.36
CI 0.58 0.51 0.56 0.55 0.52 0.55 0.63 0.78 0.66 0.59
Tomasella et al. (2000) - Level 4
x
– (m3 m-3) 0.46 0.42 0.35 0.30 0.27 0.23 0.21 0.19 0.18
-RMSE (m3 m-3) 0.06 0.06 0.07 0.08 0.08 0.08 0.07 0.05 0.06 0.07
ME (m3 m-3) 0.01 0.01 0.01 0.03 0.03 0.04 0.03 0.02 -0.01 0.02
R2 0.08 0.16 0.23 0.24 0.22 0.26 0.35 0.57 0.41 0.28
CI 0.28 0.40 0.47 0.48 0.47 0.51 0.59 0.74 0.64 0.51
Vereecken et al. (1989)
x
– (m3 m-3) 0.47 0.34 0.25 0.21 0.20 0.18 0.18 0.18 0.18
-RMSE (m3 m-3) 0.07 0.13 0.14 0.14 0.14 0.12 0.10 0.07 0.08 0.12
ME (m3 m-3) -0.01 0.08 0.11 0.12 0.11 0.10 0.07 0.04 0.00 0.07
R2 0.17 0.00 0.05 0.11 0.11 0.31 0.28 0.78 0.18 0.22
CI 0.35 0.29 0.40 0.42 0.41 0.50 0.38 0.47 0.35 0.40
Barros (2010)
x
– (m3 m-3) 0.50 0.43 0.39 0.36 0.34 0.29 0.25 0.22 0.20
-RMSE (m3 m-3) 0.08 0.06 0.08 0.08 0.08 0.08 0.09 0.07 0.09 0.08
ME (m3 m-3) -0.04 -0.01 -0.03 -0.03 -0.03 0.00 -0.01 0.03 -0.02 -0.02
R2 0.21 0.25 0.26 0.28 0.26 0.37 0.31 0.51 0.26 0.30
CI 0.35 0.38 0.43 0.46 0.45 0.54 0.53 0.63 0.53 0.48
Table 4. Statistical indicators for the parametric PTFs tested for the three depths. n = 67
of the SWRC, and significantly below the ideal values for the current study. The CI indicated low predictive ability of the van den Berg-1 PTFs, rated as “bad” (Table 5). The low efficiency of the van den Berg-1 PTFs may be attributed to the fact that it was developed for Oxisols (horizons A, AB, and B). Our
Potential, kPa 0.00
0.02 0.04 0.06 0.08 0.10 0.12 0.14 0.16
Tomasella et al. (2000) L1 Tomasella et al. (2000) L2 Tomasella et al. (2000) L3 Tomasella et al. (2000) L4 Vereecken et al. (1989) Barros (2010)
Critical limit
0.0 0.2 0.4 0.6 0.8 1.0
Lower limit of CI = Good
Upper limit of CI = Bad
0 -1 -10 -100 -1000 0 -1 -10 -100 -1000
RMSE, m
m
3
-3
Con
!
dence index
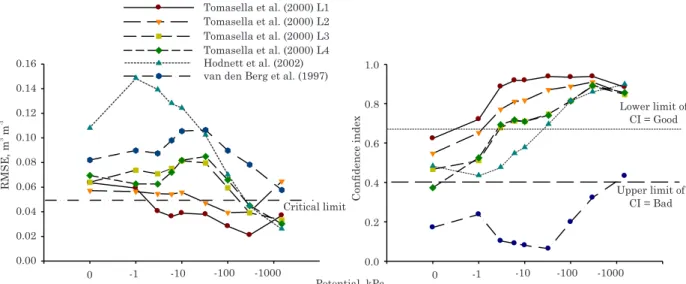
Figure 2. Values of RMSE and confidence index (CI) for the parametric PTFs tested for all soil depths; CI > 0.85 = optimum; CI from 0.85 to 0.76 = very good; CI from 0.75 to 0.66 = good; CI from 0.65 to 0.61 = average; CI from 0.60 to 0.51 = tolerable; CI from 0.50 to 0.41 = bad; CI 0.40 = very bad.
data set has several soil types, providing large variability to the properties used in the model, which reflects the high RMSE values of the van den Berg-1 PTFs. Oliveira et al. (2002) reported that PTFs have greater predictive ability when the soil properties that comprise the database are homogeneous.
-0.3 -0.2 -0.1 0.0 0.1 0.2 0.3
0.0 0.2 0.4 0.6
-0.2 0.0 0.2 0.0
0.2 0.4
0.6 Tomasella et al. (2000) - Level 1 Tomasella et al. (2000) - Level 2 Tomasella et al. (2000) - Level 3 Tomasella et al. (2000) - Level 4
0 1 kPa 3 kPa 6 kPa 10 kPa 33 kPa 100 kPa 300 kPa 1500 kPa Tomasella et al. (2000) - Level 1 Tomasella et al. (2000) - Level 2 Tomasella et al. (2000) - Level 3 Tomasella et al. (2000) - Level 4
Barros (2010) Vereecken et al. (1989) Barros (2010)
0.0 0.2 0.4 0.6
0.0 0.2 0.4 0.6
0.0 0.2 0.4 0.6 0.0 0.2 0.4 0.6
Vereecken et al. (1989)
Estimated, m3 -3
m Measured, m m3 -3
Measured, m m3 -3
Estimated, m3 -3
m
Estimated, m
3
-3
m
Residue, m
3
-3
m
Estimated, m
3
-3
m
The estimated and measured data were plotted on a scatter chart (Figure 5). It is observed that the best fit was obtained for Tomasella PTF L1. The Hodnett PTFs have a tendency to overestimate water content values in the points near saturation, while the van den Berg-1 PTFs underestimate water content in the dry part of the SWRC (Figure 5). Both the van den Berg-1 and Hodnett PTFs are characterized by a dispersion of the regression points (Figure 5), which confirms the previous statements about these PTFs. Moreover, it was found that the Hodnett and van den
Berg-1 PTFs, despite the addition of CEC and pH to the set of predictive variables, did not have good predictive abilities.
Assessment of point PTFs
Performance analysis of the point PTFs tested indicates that most of them have low predictive capacity (Table 6). For estimations of the water content at the -10 kPa potential, all the PTFs tested showed RMSE values above 0.07 m3 m-3 (Table 6), which is
considered high for this kind of study. In addition,
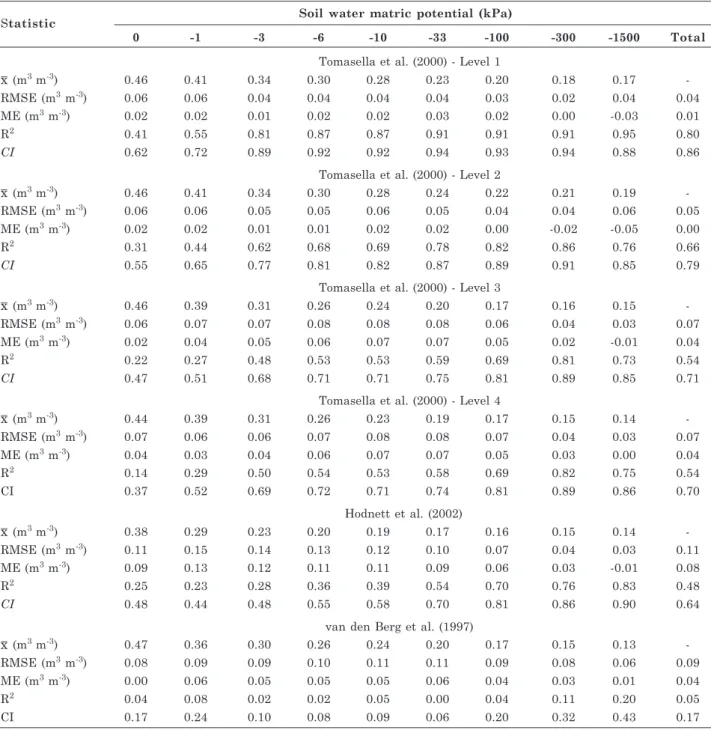
Statistic Soil water matric potential (kPa)
0 -1 -3 -6 -10 -33 -100 -300 -1500 Total
Tomasella et al. (2000) - Level 1
x
– (m3 m-3) 0.46 0.41 0.34 0.30 0.28 0.23 0.20 0.18 0.17
-RMSE (m3 m-3) 0.06 0.06 0.04 0.04 0.04 0.04 0.03 0.02 0.04 0.04
ME (m3 m-3) 0.02 0.02 0.01 0.02 0.02 0.03 0.02 0.00 -0.03 0.01
R2 0.41 0.55 0.81 0.87 0.87 0.91 0.91 0.91 0.95 0.80
CI 0.62 0.72 0.89 0.92 0.92 0.94 0.93 0.94 0.88 0.86
Tomasella et al. (2000) - Level 2
x
– (m3 m-3) 0.46 0.41 0.34 0.30 0.28 0.24 0.22 0.21 0.19
-RMSE (m3 m-3) 0.06 0.06 0.05 0.05 0.06 0.05 0.04 0.04 0.06 0.05
ME (m3 m-3) 0.02 0.02 0.01 0.01 0.02 0.02 0.00 -0.02 -0.05 0.00
R2 0.31 0.44 0.62 0.68 0.69 0.78 0.82 0.86 0.76 0.66
CI 0.55 0.65 0.77 0.81 0.82 0.87 0.89 0.91 0.85 0.79
Tomasella et al. (2000) - Level 3
x
– (m3 m-3) 0.46 0.39 0.31 0.26 0.24 0.20 0.17 0.16 0.15
-RMSE (m3 m-3) 0.06 0.07 0.07 0.08 0.08 0.08 0.06 0.04 0.03 0.07
ME (m3 m-3) 0.02 0.04 0.05 0.06 0.07 0.07 0.05 0.02 -0.01 0.04
R2 0.22 0.27 0.48 0.53 0.53 0.59 0.69 0.81 0.73 0.54
CI 0.47 0.51 0.68 0.71 0.71 0.75 0.81 0.89 0.85 0.71
Tomasella et al. (2000) - Level 4
x
– (m3 m-3) 0.44 0.39 0.31 0.26 0.23 0.19 0.17 0.15 0.14
-RMSE (m3 m-3) 0.07 0.06 0.06 0.07 0.08 0.08 0.07 0.04 0.03 0.07
ME (m3 m-3) 0.04 0.03 0.04 0.06 0.07 0.07 0.05 0.03 0.00 0.04
R2 0.14 0.29 0.50 0.54 0.53 0.58 0.69 0.82 0.75 0.54
CI 0.37 0.52 0.69 0.72 0.71 0.74 0.81 0.89 0.86 0.70
Hodnett et al. (2002)
x
– (m3 m-3) 0.38 0.29 0.23 0.20 0.19 0.17 0.16 0.15 0.14
-RMSE (m3 m-3) 0.11 0.15 0.14 0.13 0.12 0.10 0.07 0.04 0.03 0.11
ME (m3 m-3) 0.09 0.13 0.12 0.11 0.11 0.09 0.06 0.03 -0.01 0.08
R2 0.25 0.23 0.28 0.36 0.39 0.54 0.70 0.76 0.83 0.48
CI 0.48 0.44 0.48 0.55 0.58 0.70 0.81 0.86 0.90 0.64
van den Berg et al. (1997)
x
– (m3 m-3) 0.47 0.36 0.30 0.26 0.24 0.20 0.17 0.15 0.13
-RMSE (m3 m-3) 0.08 0.09 0.09 0.10 0.11 0.11 0.09 0.08 0.06 0.09
ME (m3 m-3) 0.00 0.06 0.05 0.05 0.05 0.06 0.04 0.03 0.01 0.04
R2 0.04 0.08 0.02 0.02 0.05 0.00 0.04 0.11 0.20 0.05
CI 0.17 0.24 0.10 0.08 0.09 0.06 0.20 0.32 0.43 0.17
Table 5. Statistical indicators for the parametric PTFs tested for the topsoil layer (0-5 cm). n = 27
the CI of the PTFs tested ranged from “bad” to “very poor” (Table 6). Among the point PTFs tested that estimate water content at the -10 kPa potential, the van den Berg-2 PTF had the best predictive ability. It had the lowest RMSE and ME values, and the highest R2 and CI (Table 6). However, according to Camargo &
Sentelhas (1997), this PTF was classified as “tolerable”, which confirms its low performance in estimating water content at the -10 kPa potential. The worst performance in estimating water content at the -10 kPa potential was observed for the Pidgeon PTF, which showed the highest RMSE and ME, and a CI rated as “poor”.
0.6
0.4
0.2
0.0
0.0 0.2 0.4 0.6 0.0 0.2 0.4 0.6 0.0 0.2 0.4 0.6 0.0 0.2 0.4 0.6 Tomasella et al. (2000) - Level 1 Tomasella et al. (2000) - Level 2 Tomasella et al. (2000) - Level 3 Tomasella et al. (2000) - Level 4
0.3 0.2 0.1 0.0 0.1 0.2 0.3
0.6
0.4
0.2
0.0
Tomasella et al. (2000) - Level 1
Hodnett (2002) van der Berg (1997) Hodnett (2002) van der Berg (1997)
Tomasella et al. (2000) - Level 2 Tomasella et al. (2000) - Level 3 Tomasella et al. (2000) - Level 4 Measured, m3 -3
m
Estimated, m m3 -3
Estimated, m
m
3
-3
Estimated, m m3 -3
Measured, m3 -3
m
Residue, m
m
3
-3
Estimated, m
m
3
-3
0
1 kPa
3 kPa
6 kPa
10 kPa
33 kPa
100 kPa
300 kPa
1500 kPa
Figure 5. Measured vs estimated volumetric water content, and estimation residue for the parametric PTFs tested in the surface soil layer (0-5 cm) (n = 27).
0 -1 -10 -100 -1000
0.0 0.2 0.4 0.6 0.8 1.0
Potential, kPa 0.00
0.02 0.04 0.06 0.08 0.10 0.12 0.14 0.16
Tomasella et al. (2000) L1 Tomasella et al. (2000) L2 Tomasella et al. (2000) L3 Tomasella et al. (2000) L4 Hodnett et al. (2002) van den Berg et al. (1997)
Critical limit
Lower limit of CI = Good
Upper limit of CI = Bad
0 -1 -10 -100 -1000
RMSE, m
m
3
-3
Con
!
dence index
For the -33 kPa potential, the PTF that had the best performance was the Batjes PTF (Table 6). The worst performance was observed for the Aina PTF, with a CI performance rated as “bad”. A similar behavior was observed for the water content estimations at -1500 kPa. The PTF with the best performance was the Batjes PTF. However, at this potential, the van den Berg and Oliveira PTFs had similar performance results (Table 6). The worst performance was observed for the Arruda PTFs, followed by the Lal, Aina, and Dijkerman PTFs (CI 0.37).
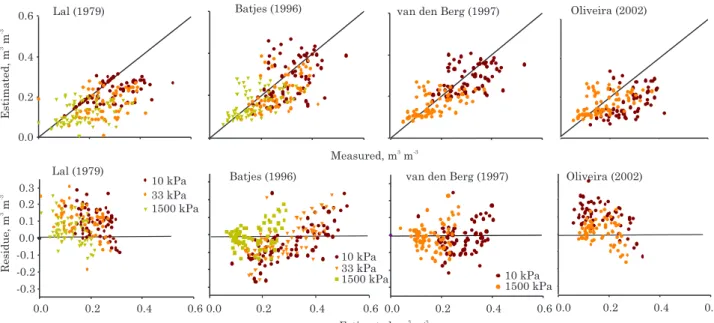
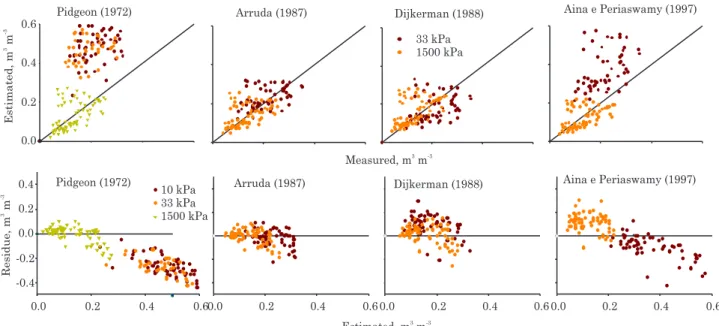
Some PTFs overestimate water content at a given potential and underestimate it at another, as observed for the Oliveira and Aina PTFs (Figures 6 and 7). The Lal PTFs underestimate water content at all
three potentials. The Pidgeon PTF overestimates water content at both potentials (Figure 7).
The PTFs that estimate volumetric water content showed better results than those that estimate gravimetric water content, except for the Lal PTFs. There are many reasons that lead to low efficiency of a PTF. Finke et al. (1996) showed that a major source of inaccuracy of a PTF is the spatial variability of soil properties that are transferred to the PTF. The performance of several point PTFs was evaluated by Tomasella & Hodnett (2004) using a database of tropical soils composed of 771 horizons. The authors found that some PTFs had great difficulty in estimating water content at specific potentials, and they attributed this difficulty to their simplicity, i.e.,
PTF
-10 kPa -33 kPa -1500 kPa
x– RMSE ME R2 IC x– RMSE ME R2 IC x– RMSE ME R2 IC
PTF for volumetric water content (m3 m-3)
Lal (1979) 0.22 0.12 0.09 0.05 0.21 0.16 0.14 0.11 0.15 0.38 0.12 0.09 0.05 0.12 0.34 Batjes (1996) 0.28 0.10 0.04 0.19 0.44 0.23 0.09 0.05 0.25 0.50 0.17 0.07 0.01 0.28 0.52 van den Berg et al. (1997) 0.28 0.08 0.03 0.20 0.44 no no no no no 0.16 0.07 0.01 0.28 0.53 Oliveira et al. (2002) no no no no no 0.18 0.13 0.11 0.26 0.46 0.17 0.07 0.01 0.30 0.53
PTF for gravimetric water content (kg kg-1)
Pidgeon (1972) 0.57 0.37 -0.34 0.25 0.37 0.53 0.39 -0.35 0.27 0.41 0.14 0.08 0.04 0.21 0.42 Aina & Periaswamy (1985) no no no no no 0.39 0.19 -0.16 0.09 0.27 0.12 0.19 0.09 0.17 0.37 Arruda et al. (1987) no no no no no 0.24 0.07 -0.01 0.13 0.35 0.14 0.07 0.08 0.15 0.31 Dijkerman (1988) no no no no no 0.19 0.09 0.05 0.11 0.28 0.16 0.08 0.06 0.21 0.37
Table 6. Statistical indicators for the point PTFs for predicting volumetric or gravimetric water content. n = 67
x–: mean of the estimated values (m3 m-3); RMSE: root mean square error; ME: mean error; R2: coefficient determination; CI: Confidence Index proposed by Camargo & Sentelhas (1987); no: no PTF for that potential.
0.0 0.2 0.4 0.6 0.0 0.2 0.4 0.6
-0.3 -0.2 -0.1 0.0 0.1 0.2
0.3 10 kPa
33 kPa 1500 kPa Lal (1979)
0.0 0.2 0.4 0.6
0.0 0.2 0.4 0.6 10 kPa 33 kPa 1500 kPa
0.0 0.2 0.4 0.6 10 kPa 1500 kPa Batjes (1996) van den Berg (1997)
Lal (1979) Oliveira (2002)
Batjes (1996) van den Berg (1997) Oliveira (2002)
Estimated, m m3 -3
Estimated, m
m
3
-3
Residue, m
m
3
-3
Measured, m3 -3
m
the limited number of predictive variables, which may cause a reduction in the robustness of the PTFs. Another effect to consider is the type of clay found in soils, given that the mineralogy of the clay fraction determines the amount of water a soil can retain. Furthermore, soil mineralogy is one of the factors responsible for the formation of different types of microstructure, which also affects the SWRC (Gaiser et al., 2000).
CONCLUSIONS
1. Parametric PTFs were more efficient than point PTFs in estimating water content at specific potentials (-10, -33, -1500 kPa).
2. Among the PTFs tested, those elaborated with homogeneous sets of soils do not show good efficiency for the set of soils that were tested.
3. All parametric PTFs assessed in this study, except for those proposed by Tomasella et al. (2000), levels 1 and 2, showed limited capacity for predicting the SWRC.
4. The Tomasella PTFs showed higher efficiency when tested in the topsoil layer (0-5 cm) than when tested for the three depths combined (0-5, 10-15, and 40-45 cm).
ACKNOWLEDGMENTS
The authors are grateful to the CNPq and CAPES, Brazil, for scholarships and financial support and the
INRA and AgroParisTech, France, for the internship opportunity. We are also grateful to the editor and reviewers who considerably improved the quality of the manuscript.
LITERATURE CITED
ABBASI, Y.; GHANBARIAN-ALAVIJEH, B.; LIAGHAT, A.M. & SHORAFA, M. Evaluation of pedotransfer functions for estimating soil water retention curve of saline and saline-alkali soils of Iran. Pedosphere, 21:230-237, 2011. AINA, P.O. & PERIASWAMY, S.P. Estimating available water-holding capacity of Western Nigerian soils from soil particle size distribution and bulk density using core and sieved samples. Soil Sci., 140:55-58, 1985.
ARRUDA, F.B.; ZULLO JUNIOR, J. & OLIVEIRA, J.B. Soil parameters for the calculation of available water based soil texture. R. Bras. Ci. Solo, 11:11-15, 1987.
BAKER, L. Development of class pedotransfer functions of soil water retention - A refinement. Geoderma, 144:225-230, 2008.
BARROS, A.H.C. Desenvolvimento de funções de pedotransferência e sua utilização em modelo agro-hidrológico. Piracicaba, Escola Superior de Agricultura “Luiz de Queiroz”, 2010. 149p. (Tese de Doutorado) BARROS, A.H.C.; J.L., Q. & NUNES, A.H. Pedotransfer
functions to estimate water retention parameters of soils in northeastern Brazil. R. Bras. Ci. Solo, 37:379-391, 2013. BATJES, N.H. Development of a world data set of soil water retention properties using pedotransfer rules. Geoderma, 71:31-52, 1996.
0.0 0.2 0.4 0.6
Pidgeon (1972) Arruda (1987) Dijkerman (1988) Aina e Periaswamy (1997)
0.0 0.2 0.4 0.6 0.4
0.2
0.0
-0.2
-0.4
10 kPa 33 kPa 1500 kPa
0.0 0.2 0.4 0.6 0.0 0.2 0.4 0.6
33 kPa 1500 kPa
0.0 0.2 0.4 0.6
Pidgeon (1972) Arruda (1987) Dijkerman (1988) Aina e Periaswamy (1997)
Estimated, m m3 -3
Measured, m3 -3
m
Estimated, m
m
3
-3
Residue, m
m
3
-3
BLAKE, G.R. & HARTGE, K.H. Bulk density. In: KLUTE, A., ed. Methods of soil analysis: Physical and mineralogical methods. 2.ed. Madison, American Society Agronomy, 1986. p.363-375.
BOUMA, J. Using soil survey data for quantitative land evaluation. Adv. Soil Sci., 9:177-213, 1989.
BROOKS, R.H. & COREY, A.T. Hydraulic properties of porous media. Fort Collins, State University, Civil Engineering Department, 1964. 27p.
BOTULA, Y.D.; CORNELIS, W.M.; BAERT, G. & van RANST, E. Evaluation of pedotransfer functions for predicting water retention of soils in Lower Congo (D.R. Congo). Agric. Water Manage., 111:1-10, 2012.
CAMARGO, A.P. & SENTELHAS, P.C. Performance evaluation of different methods for estimating potential evapotranspiration in the state of São Paulo, Brazil. An analytical review of potential evapotranspiration. R. Bras. Agrometeo., 5:89-97, 1997.
CRESSWELL, H.P.; COQUET, Y.; BRUAND, A. & McKENZIE, N.J. The transferability of Australian pedotransfer functions for predicting water retention characteristics of French soils. Soil Use Manage., 22:62-70, 2006. CRESSWELL, H.P. & PAYDAR, Z. Functional evaluation of
methods for predicting the soil water characteristic. J. Hydrol., 227:160-172, 2000.
DEPARTAMENTO ESTADUAL DE ORÇAMENTO E FINANÇAS - DEOF. Estatísticas Paraense: Pacajá. Belém, Instituto de Desenvolvimento Econômico, Social e Ambiental do Pará, 2011. 44p.
DIJKERMAN, J.C. An Ustult-Aquult-Tropept Catena in Sierra Leone, West Africa. II. Land qualities and land. Geoderma, 42:29-49, 1988.
FINKE, P.A.; WÖSTEN, J.H.M.; JONES, J.H.M. & JANSEN, M.J.W. Effects of uncertainty in major input variables on simulated functional soil behaviors. Hydrolog. Proces., 10:661-669, 1996.
GAISER, T.; GRAEF, F. & CORDEIRO, J.C. Water retention characteristics of soils with contrasting clay mineral composition in semi-arid tropical regions. Aust. J. Soil Res., 38:523-536, 2000.
GEE, G.W. & BAUDER, J.W. Particle size analysis. In: KLUTE, A., ed. Methods of soil analysis. 2.ed. Madison, American Society Agronomy, 1986. p.383-411.
GIAROLA, N.F.B.; SILVA, A.P. & IMHOFF, S. Relationships between physical soil properties and characteristics of south Brazilian soil. R. Bras. Ci. Solo, 26:885-893, 2002. GOULD, S.; RAJEEV, P.; KODIKARA, J.; ZHAO, X.L.; BURN,
S. & MARLOW, D. A new method for developing equations applied to the water retention curve. Soil Sci. Soc. Am. J., 76:806-814, 2012.
GUPTA, S.C. & LARSON, W.E. Estimating soil water retention characteristics from particle size distribution, organic matter percent and bulk density. Water Resour. Res., 15:1633-1635, 1979.
HODNETT, M.G. & TOMASELLA, J. Marked differences between van Genuchten soil water-retention parameters for temperate and tropical soils: A new water-retention pedotransfer function developed for tropical soils. Geoderma, 108:155-180, 2002.
INSTITUTO NACIONAL DE METEOROLOGIA - INMET. Available at: <http://www.inmet.gov.br>. Accessed: Oct. 1st, 2012.
ISSLER, R.S. & GUIMARÃES, G. Geologia. In: BRASIL. DNPM. Projeto RADAMBRASIL. Folha SB.22. Araguaia e parte de SC.22 Tocantins. Rio de Janeiro, 1974. KLUTE, A. Water retention: Laboratory methods. In: KLUTE,
A., ed. Methods of soil analysis: Physical and mineralogical methods. 2.ed. Madison, American Society Agronomy, 1986. p.635-660.
KOTTEK, M.; GRIESER, J.; BECK, C.; RUDOLF, B. & RUBEL, F. World Map of the Köppen-Geiger climate classification updated. Meteorol. Zeitschrift, 15:259-263, 2006. LAL, R. Physical properties and moisture retention
characteristics of some Nigerian soils. Geoderma, 21:209-223, 1979.
MEDINA, H.; TARAWALLY, M.; VALLE, A. & RUIZ, M.E. Estimating soil water retention curve in Rhodic Ferralsols from basic soil data. Geoderma, 108:277-285, 2002. MUALEM, Y. A new model for predicting the hydraulic
conductivity of unsaturated porous media. Water Resour. Res., 12:513-522, 1976.
MOEYS, J.; LARSBO, M.; BERGSTROM, L.; BROWN, C.D.; COQUET, Y. & JARVIS, N.J. Functional test of pedotransfer functions to predict water flow and solute transport with the dual-permeability model MACRO. Hydrol. Earth Syst. Sci., 16:2069-2083, 2012.
NAVIN, K.C.T.; ŠIMÙNEK, J. & SCHAAP, M.G. Development of pedotransfer functions for estimation of soil hydraulic parameters using support vector machines. Soil Sci. Soc. Am. J., 73:1443-1452, 2009.
OLIVEIRA, L.B.; RIBEIRO, M.R.; JACOMINE, P.K.T.; RODRIGUES, J.V.V. & MARQUES, F.A. Pedotransfer functions for the prediction of moisture retention and specific potentials in soils of Pernambuco State (Brazil). R. Bras. Ci. Solo, 26:315-323, 2002.
PACHEPSKY, Y.A. & RAWLS, W.J. Development of pedotransfer functions in soil hydrology. Amsterdam, Elsevier, 2004. 498p. (Developments in Soil Science, 30) PIDGEON, J.D. The measurement and prediction of available water capacity of Ferrallitic soils in Uganda. Eur. J. Soil Sci., 23:431-441, 1972.
SCHAAP, M.G.; LEIJ, F.J. & van GENUCHTEN, Th.M. ROSETTA: A computer program for estimating soil hydraulic parameters with hierarchical pedotransfer functions. J. Hydrol., 251:163-176, 2001.
SILVA, A.P.; TORMENA, C.A.; FIDALSKI, J. & IMHOFF, S. Pedotransfer functions for the soil water retention and soil resistance to penetration curves. R. Bras. Ci. Solo, 32:11-19, 2008.
SOIL SURVEY STAFF. Keys to soil taxonomy. 11.ed. Washington, USDA-NRCS, U.S. Government Printing Office, 2010. TOMASELLA, J. & HODNETT, M.G. Estimating soil water
retention characteristics from limited data in Brazilian Amazonia. Soil Sci., 163:190-202, 1998.
TOMASELLA, J. & HODNETT, M.G. Pedotransfer functions for tropical soils. In: PACHEPSKY, Y.A. & RAWLS, W.J., eds. Development of pedotransfer functions in soil hydrology. Amsterdam, 2004. p.415-430.
TOMASELLA, J.; HODNETT, M.G. & ROSSATO, L. Pedotransfer functions for the estimation of soil water retention in Brazilian soils. Soil Sci. Soc. Am. J., 64:327-338, 2000. TOMASELLA, J.; PACHEPSKY, Y.A.; CRESTANA, S. & RAWLS,
W.J. Comparison of two techniques to develop pedotransfer functions for water retention. Soil Sci. Soc. Am. J., 67:1085-1092, 2003.
van den BERG, M.; KLAMT, E.; van REEUWIJK, L.P. & SOMBROEK, W.G. Pedotransfer functions for the estimation of moisture retention characteristics of Ferralsols and related soils. Geoderma, 78:161-180, 1997. van GENUCHTEN, M.Th.; LEIJ, F.J. & YATES, S.R. The RETC code for quantifying the hydraulic functions of unsaturated soils. EPA/600/2-91/065. Washington, U.S Environmental Protection Agency, 1991. 85p. van GENUCHTEN, M.Th. A closed-form equation for
predicting the hydraulic conductivity of unsaturated soils. Soil Sci. Soc. Am. J., 44:892-898, 1980.
VEREECKEN, H.; FEYEN, J. & MAES, J. Estimating the soil moisture retention characteristic from particle size distribution, bulk density and carbon content. Soil Sci., 148:389-403, 1989.
VEREECKEN, H.; WEYNANTS, M.; JAVAUX, M.; PACHEPSKY, Y.; SCHAAP, M.G. & van GENUCHTEN, M.Th. Using pedotransfer functions to estimate the van Genuchten-Mualem soil hydraulic properties: A review. Vadose Zone J., 9:1-26, 2010.