1Institute of Geosciences, Universidade de Brasília – UnB, Brasília (DF), Brazil. E-mails: [email protected]; [email protected] 2Federal Institute for Geosciences and Natural Resources – Hanover, Germany. E-mail: [email protected]
*Corresponding author
Manuscript ID: 30219. Received: 12/30/2014. Approved: 05/12/2015. ABSTRACT: Hydraulic conductivity (K) in unsaturated soil is a key input parameter for modeling subsurface water and solute movements. K-values are also important to better deine the potential of aquifers and to optimize water resources management activities. Since K-values are usually not readily available, diferent techniques are applied to es-timate them. his study aimed to eses-timate unsaturated K-values from porous aquifers found in the Federal District of Brazil. Iniltration tests were conducted in diferent soil types using the open-end-hole approach and the permeability test using shallow boreholes with spe-ciic depths, as reported by Heitfeld in 1979. Soil structure was taken into consideration in such estimations. In order to consider important soil properties such as soil texture and bulk density, K-values were also estimated by means of pedotransfer functions (PTFs). Soil texture was determined in the laboratory and used as input parameter for PTFs. Results from open-end-hole method and permeability test compared to those obtained from pedotransfer functions. K-values from four diferent shallow porous aquifers systems encountered in the Federal District varied from 10-8 ms-1 to 10-6 ms-1. Highest K-values were found in Oxisols while the lowest rates were found in Inceptisols. Decreasing conductivity trend was found with increasing depth due to the increase of loamy soils. Variations in the rate of hydraulic conductivity indica-ted heterogeneity of porous aquifers due to diferences in textural and structural characteristics of the soils.
KEYWORDS: unsaturated hydraulic conductivity; open-end-hole; pedotransfer functions.
RESUMO: A condutividade hidráulica (K) em meios não saturados é um parâmetro essencial para modelar luxos de água e solutos no subsolo. Os valores de K são também importantes para estimar o potencial dos aquíferos e otimizar a gestão de recursos hídricos. Tais valores geralmente não estão disponíveis e diferentes técnicas são aplicadas para obtê-los. O objetivo deste estudo foi estimar valores de K em meios porosos não saturados na região do Distrito Federal (DF). Foram realizados testes de iniltração em diferentes tipos de solo, utilizando o método open-en-d-hole, e ensaios de permeabilidade, em poços rasos com profundidades especíicas, como descritos por Heitfeld (1979). Em tais estimativas a estrutura dos solos foi considerada. Valores de K também foram estima-dos por meio de funções de pedotransferência (PTFs). A textura estima-dos so-los foi determinada em laboratório e usada como parâmetro de entrada para o cálculo das PTFs. Os resultados do método open-end-hole e dos ensaios de permeabilidade foram comparados com aqueles obtidos pelas PTFs. Valores de K de diferentes sistemas aquíferos rasos encontrados no DF variaram de 10-8 ms-1 a 10-6 ms-1. Os Latossolos apresentaram altos valores de K, enquanto que nos Cambissolos foram encontrados baixos valores. Uma tendência decrescente de condutividade foi observada com o aumento da profundidade, devido ao incremento de argila dos solos. As variações dos valores de K indicaram a heterogeneidade dos aquíferos porosos devido, principalmente, a diferença das características estruturais e texturais dos solos.
PALAVRAS-CHAVE: condutividade hidráulica não saturada; open-end-hole; funções de pedotransferência.
Hydraulic characterization from porous
aquifers of the Brazilian Federal District
Caracterização hidráulica dos aquíferos porosos do Distrito Federal
Tatiana Diniz Gonçalves1*, Christoph Lohe2, José Elói Guimarães Campos1
INTRODUCTION
Groundwater demand has grown signiicantly in the Federal District of Brazil in the past decades. According to the 2010 demographic census carried out by IBGE (Brazilian Institute of Geography and Statistics), 2.5 mil-lion inhabitants were living in the central Federal District by the year 2012, far beyond the originally planned 600,000 people for the year 2000. he study developed by Donald Belcher & Associates in 1950, known as “Belcher Report” (CODEPLAN 1995), pointed out that the water resources in this region were environmentally fragile because of the dominance of high plateaus and the presence of important headwaters, small streams and rivers.
Nowadays, the basic services of water and energy supply, and wastewater treatment in the Federal District are insuicient to meet the demand of a growing popu-lation. Water supply in Brasilia (capital of Brazil) and its surrounding satellite cities is mainly dependent on two reservoirs (Santa Maria and Descoberto), some small streams, and groundwater. Major groundwater demand comes from more than 500 urbanizationsbuilt after 1990 (SEDUH 2006). Most of these residential communities are located in high plateaus and thick soils, which play an important role in recharging the aquifers. Urban occupa-tion often seals surface soils, making rainfall iniltraoccupa-tion more restricted. Consequently, there is a decrease in the groundwater and surface water availability. Residential communitiesoften establish their own water supply proj-ects, based solely on their needs.
Such situation has motivated researchers to improve the knowledge of hydraulic conditions of local aquifers, which is necessary in order to better control and man-age the groundwater utilization by local inhabitants or water suppliers. Campos and Freitas-Silva (1998), Souza (2001), Lousada and Campos (2005), Almeida et al.
(2006) and Fiori et al.(2010), among others, classiied aquifers based mainly on unsaturated hydraulic conduc-tivity (K), although the results are still incipient because of limited data concerning the potential and exploitation of the analyzed aquifers.
Estimating K-values from the Federal District shallow aquifers is important, because they are key parameters for the diferentiation of aquifer bodies and their yield. Hydraulic tests such as iniltration tests support the delineation of dif-ferent groundwater systems. hese shallow aquifers play a crucial rolein recharging deeper aquifers, regulating stream lows, and contaminant lows, among other controls. Until now, there is no long-term monitoring system to create a consistent database necessary for the correct management of these aquifers.
K-values from soils and saprolites can be measured by direct ield methods or by indirect methods that estimate iniltration potential through other parameters. Most of the studies developed in the region used direct methods such as the double ring and open-end-hole. Field direct meth-ods are time-consuming and expensive. As an alternative, pedotransfer functions (PTFs) are often used to estimate K-values indirectly, based on soil attributes such as texture, morphological structure, organic matter content and density (Bouma & Van Lanen 1987). hese methods were developed for soils from temperate regions. herefore, adequation for tropical soils, mainly Oxisols (the most extensive soil type from tropics), is necessary.
he K-values showed in this study refer to vertical hydraulic conductivity in a speciic depth. As the soil can be considered homogeneous in each horizon, it can be treated as an isotropic hydrogeologic medium, so that the vertical and horizontal hydraulic conductivity may be seen as the same order of magnitude. he estimated hydraulic conductivities are related to the unsaturated zone of the aquifers, since the in situ iniltration tests were developed up to 200 cm and the soil samples were collected in the shallow horizons.
Speciic PTFs for tropical soils were proposed by Van den Berg et al. (1997), Tomasella et al. (2000, 2003), Hodnett and Tomasella (2002), Oliveira et al. (2002) and Benites
et al. (2007). hey developed PTFs based on multiple lin-ear regression equations and artiicial neural networks to determine the parameters speciied in the Brooks-Corey (1964) and van Genuchten (1980) equations, or to esti-mate parameters related to water retention and hydrau-lic conductivity. his study aims to obtain unsaturated K-values from Federal District’s shallow aquifers in order to contribute to the sustainable management of the water resources of this region.
STUDY AREA
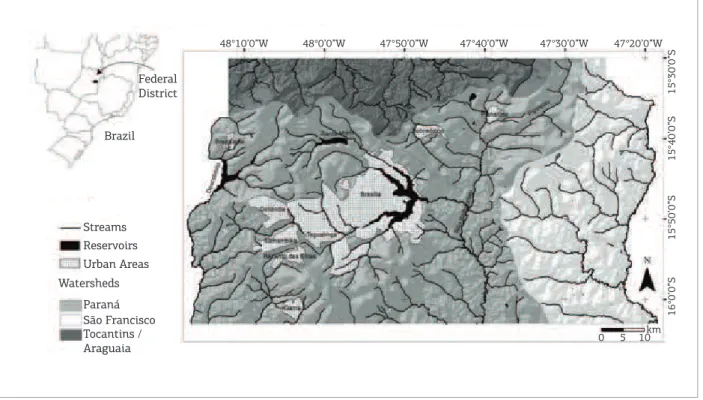
he Federal District of Brazil is located in the Brazilian central plateau and covers an area of 5.789 km². It includes three of the most important Latin American basins (Paraná, São Francisco and Araguaia-Tocantins) (Fig. 1). Streams are composed by small rivers. Aquifer recharge occurs domi-nantly in areas covered by natural vegetation, in thick soils and gentle slopes.
unconsolidated materials with large horizontal and verti-cal extensions, ranging from a few meters to up to 80 m in thickness (average: 15 – 25 m). hey also point out that these systems are isotropic and heterogeneous.
he Brazilian Corporation of Agricultural Research (Embrapa 1978) produced a soil distribution map of the area. Diferent soil types show distinct conditions of inil-tration and recharge because inilof inil-tration is controlled by thickness, textural and morphological structures, con-ductivity, vegetation, humidity, and slope. Textural and morphological structures are the main parameters to determine the dynamic processes in unsaturated zones of this environment.
he most representative soils of the region are Red Oxisols, Red-Yellow Oxisols, and Inceptisols (Embrapa 2006), which cover about 85% of the study area. Alisols, Mollisols, Histosols and Entisols are also found in the study site. Oxisols present the best conditions for inil-tration and recharge, which are frequently associated to savannas and occurring in lat to gentle topography. hey occupy around 55% of the total area, show aver-age thickness of 25 m, and present sandy to clayey tex-ture and a highly stable microstructex-ture. Inceptisols have a smaller iniltration capacity. Inceptisols cover about 30% of the area and occur in hilly topography. hey are typically thin, show sandy to loamy textures and blocky to granular structures. Grasslands are the most common
vegetation cover. Other soil classes occur in small areas and are grouped in:
■ Alisols and Mollisols;
■ Fluvic Entisols;
■ Histosols; and
■ Sandy Entisols.
he irst group shows medium K-values with clayey texture, occurs in gentle reliefs and is strongly structured. he second group is represented by thin soils near streams and in gentle reliefs, and shows often loamy to clayey tex-tures. Histosols have the lowest K-values and are related to wetlands. Sandy Entisols are composed essentially by quartz, derived from the weathering of quartzite.
he mineralogy of the soil layers is mainly controlled by the lithology of parent rocks of the Paranoá, Canastra, Araxá and Bambuí Groups (Campos & Freitas-Silva 1998, Faria 1995). he most important minerals are iron oxides and hydroxides, gibbsite, kaolinite and quartz. he rocks of the Paranoá Group constitute 65% of the Federal District and are widespread in the western and northwestern portions of the territory. he R3 unit (sandy metarrith-mite) and the Q3 unit (medium quartzite) are responsi-ble for keeping the high plateaus, with deep weathered mantles, sandy texture and high permeability. he Clay Metarrithmite unit and the Psamo-Pellitic Carbonate unit also produce Oxisols and Inceptisols, depending
48°10’0”W 48°0’0”W 47°50’0”W 47°40’0”W 47°30’0”W 47°20’0”W
0 5 10km
Streams Brazil
Federal District
Tocantins / Araguaia Watersheds
São Francisco Paraná Urban Areas Reservoirs
15°30’0”S
15°40’0”S
15°50’0”S
16°0’0”S
on the intensity of weathering and parent material. Soils derived from carbonates and pellitic rocks are thick, while quartzites are more resistant to hydrolysis. Similarly, soil texture is controlled by the parent materials: carbonates and pellitic rocks result in clayey texture; quartzites often produce sandy texture.
he Canastra Group occupies about 15% of the area and occurs mainly in valleys of Bartolomeu River. Chlorite phyllites of this Group are commonly covered by a thick weathered soil layer, but it can also occur in hilly regions, associated with thin Inceptisols. he Araxá Group is lim-ited to the southwestern part of the Federal District, mainly along valleys. Main rock types are schist and quartzite lens covered by a thin layer of soil in the majority of the area. he Bambuí Group is distributed throughout in the eastern portion of the Federal District, along the valleys of Preto River as well as in restricted areas in the central and north-ern portions (valleys of Maranhão River). he main rock types are siltstone, shale and arkoses. Outcrops of this Group can be found along streams and roads. he majority of the area is covered by thick Red Oxisols or by Inceptisols, in the case of a hilly relief.
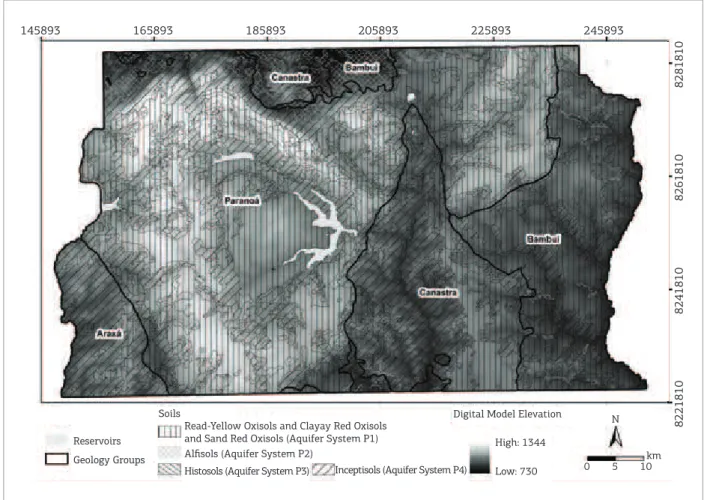
Geomorphology controls local and regional hydrogeo-logic low systems and inluences the recharge and discharge and overall low patterns. Five diferent compartments were recognized by Novaes Pinto (1994): High Plateau (elevation > 1,100 m; drainage density: low; topography: lat to gentle; major soil type: Oxisols); Intermediate Plateau (elevation: 850 – 1,100 m; topography: lat to gentle; major soil type: Oxisols); Incased Valley (topography: lat to gentle; drain-age density: high; major soil type: Inceptisols); Soft Border (transition from High Plateau to Intermediate Plateau); and Strong Border (abrupt transition from High Plateau to Incased Valley) (Fig. 2).
Climate is also important for the Federal District’s water resources availability. Besides the relatively high amount of annual rainfall (approx. 1,500 mm), there is a marked seasonality over the Federal District. he peak of the rainy summer comprises more than 50% of the rain-fall from December to March. Usually there is no rainrain-fall during the peak of the dry season (June to August). he irst rainfall usually occurs in late September. his seasonal pattern is also followed by other parameters such as rela-tive humidity (which can go down to approx. 5% in the
145893
Reservoirs Geology Groups
Read-Yellow Oxisols and Clayay Red Oxisols and Sand Red Oxisols (Aquifer System P1) Soils
Histosols (Aquifer System P3)
Alisols (Aquifer System P2) High: 1344
Low: 730 0 5 10 km N Digital Model Elevation
Inceptisols (Aquifer System P4)
165893 185893 205893 225893 245893
8281810
8261810
8241810
8221810
hottest hours of August) and temperature (approx. 17°C in colder months; > 30°C in hotter months). Because of this seasonal climate variation, shallow aquifers play a key role in keeping streams perennial.
According to Coimbra (1987), the actual evapotrans-piration is around 900 mm per year and 12% of total pre-cipitation iniltrates in the soil, reaching the saturated zone of the aquifers. he presence of diferent classes of savanna vegetation is associated with diferent geomorphological com-partments and includes grasslands, shrublands and forest-lands. Shrublands are commonly developed in thick Oxisols, grasslands are widespread in Inceptisols and forestlands are found mainly along streams. Forestlands are important to facilitate iniltration of rainfall and for aquifer recharge due to bioturbation by roots and protection against soil erosion due to heavy rainfall.
Based on the types of weathering mantles, thickness of saturated soil layer and hydraulic conductivity, Campos and Freitas-Silva (1998) classiied the Federal District’s shallow aquifers into four systems: P1, P2, P3 and P4. Gonçalves
et al. (2007) proposed a diferent approach for mapping these aquifers, which was based on new iniltration data and on curve-number theory (SCS 1954). P1, P2 and P3 systems are characterized by high thickness and high, moderate and low hydraulic conductivities, respectively. he P4 system presents low thickness and low hydraulic conductivity. Shallow wells operated in these aquifers show low average yields (< 800 L.h-1).
heses aquifers feature a local groundwater low regime and the discharge is associated with contact and slope of springs.
hese shallow aquifers are important not only to act as complementary water supply of relatively isolated rural com-munities, but also to keep streams, rivers, springs and lakes perennial during the dry season. he unsaturated zone of these aquifers functions as an important protection factor to avoid anthropogenic contamination. As the saturated zone stays incontact with fractured aquifers, the porous aquifers, mainly the P1 and P2 systems, play an important role in their recharge.
METHODS
As mentioned before, hydraulic conductivity is a key parameter to characterize porous aquifers. Although many authors have studied it (e.g., Campos & Freitas-Silva 1998, Souza 2001, Lousada & Campos 2005, Almeida
et al. 2006, Fiori et al. 2010), none have considered the inluence of soil structure in the porous aquifers. According to Williams et al. (1992) and Danalatos et al.
(1994), soil structure in tropical countries is essential to understanding the high K-values in soil proiles with high clay contents.
To estimate K-values from porous domains of the Federal District’s soils, soil structure was taken into consideration. Iniltration tests were conducted in diferent soil classes using the open-end-hole tests as well as the permeability tests pro-posed by Heitfeld (1979). Soil texture was determined in the laboratoryon soil samples. K-values were also estimated by applying pedotransfer functions available in the Rosetta software package (Schaap et al. 2001).
Open-end-hole method
Determinations of hydraulic conductivity by in situ
soil permeability (iniltration) tests were used to compare ield test data with the results of pedotransfer functions. Shallow boreholes were drilledto conduct unsteady-state permeability tests in unsaturated zones of soils. he eval-uation of permeability tests or iniltration tests is based on Darcy’s equation. Field results were evaluated using equations as proposed by Heitfeld (1979) and Scheytt and Hengelhaupt (2001). Soil samples were taken from each borehole to determine chemical composition and particle size distribution.
Location And Soil Types
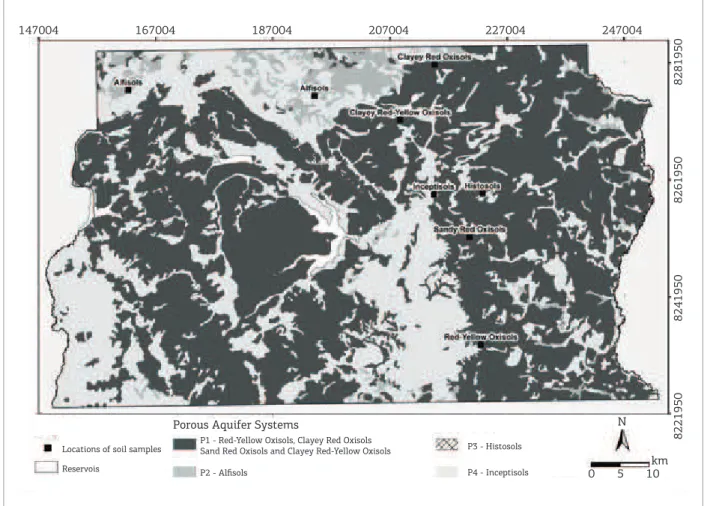
Eight sites located in the surroundings of the urban areas of the Federal District, representing the main soil types found in the study area.Boreholes were drilled to obtain undisturbed, 1-meter depth soil samples (Fig. 3). Additional boreholes near sampling points were drilled in six sites at 30 – 50 cm depth and installed for in situ permeability tests in the unsaturated zone.
Due to the thickness of Inceptisols and related sapro-lithes, which are normally less than 1 m thick, iniltration tests could not be realized. Very high bulk density Alisols are diicult to befound in the Federal District. Field inves-tigations led to the assumption that the permeability of Alisols depends more on structural elements like faults and cracks associated with neotectonic events than on soil porosity. Textural analyses were conducted for three depths of each borehole: 0 – 20 cm; 20 – 50 cm; and 50 – 100 cm. he particle size distribution cannot be used for permeabil-ity estimations with conventional methods because tropical soils have high clay and silt contents. Common methods of permeability estimations of ine sand to gravel textured materials, as described by Beyer (1964), are therefore not applicable. he particle size distribution was used in this study as input parameter for pedotransfer functions.
Permeability tests
point-based, in which accuracy is shown only for small areas surrounding the boreholes. hree types of permeability tests in open boreholes can be conducted:
■ constant low rate test with change in hydraulic head in the borehole;
■ constant head test with stabilized iniltration rate; and
■ variable head test with instant change in the hydraulic test due to quick injection.
he change of hydraulic head time is measured. Stable and variable head tests were chosen as the preferable inil-tration test methods. he water level above the inilinil-tration point corresponds to the ilter screen or to the open end of boreholes and varies over time.
he rate of iniltration through a soil tends to the partially saturated permeability of the soil. he soil does not reach full saturation because of the presence of a small volume of air in the porosity, for instance, associated with injected water. his may reduce the K-values measured in the ield. For soils with low permeability (e.g., loamy and clayey soils), the efect of suction at the wetting front can also afect the test results,
especially in unsaturated zones. herefore, saturation of soils prior to the test itself is recommended (ISO 2012). he test was conducted with a limited saturation phase of 10 – 20 min-utes, which surely did not avoid the efect of suction.
For the evaluation of ield test with variable pressure height, the following equation for the open-end-hole test was used:
K= π∙r2 In h
1
h
2
C∙(τ
1-τ2)
(1)
where r = radius of the borehole; h1, h2= height of water col-umn; and t = time. Factor C depends on the screen length and borehole diameter. he equation for the open end test with nominal screen length (L) = 0 can be calculated by:
C = 5.5∙ r (2)
he iniltration test after Heitfeld (1979) and Earth Manual (1951, after Scheytt and Hengelhaupt, 2001) for unsaturated soils can be evaluated by the following equation:
147004
Locations of soil samples
P2 - Alisols P4 - Inceptisols 0 5 10
km N
P3 - Histosols P1 - Red-Yellow Oxisols, Clayey Red Oxisols
Sand Red Oxisols and Clayey Red-Yellow Oxisols
Porous Aquifer Systems
Reservois
167004 187004 207004 227004 247004
8281950
8261950
8241950
8221950
1.000
1.000 100
Cu
100 h/ra –
– L/h = 10.7
0.4 0.3 0.2 0.1
10 10
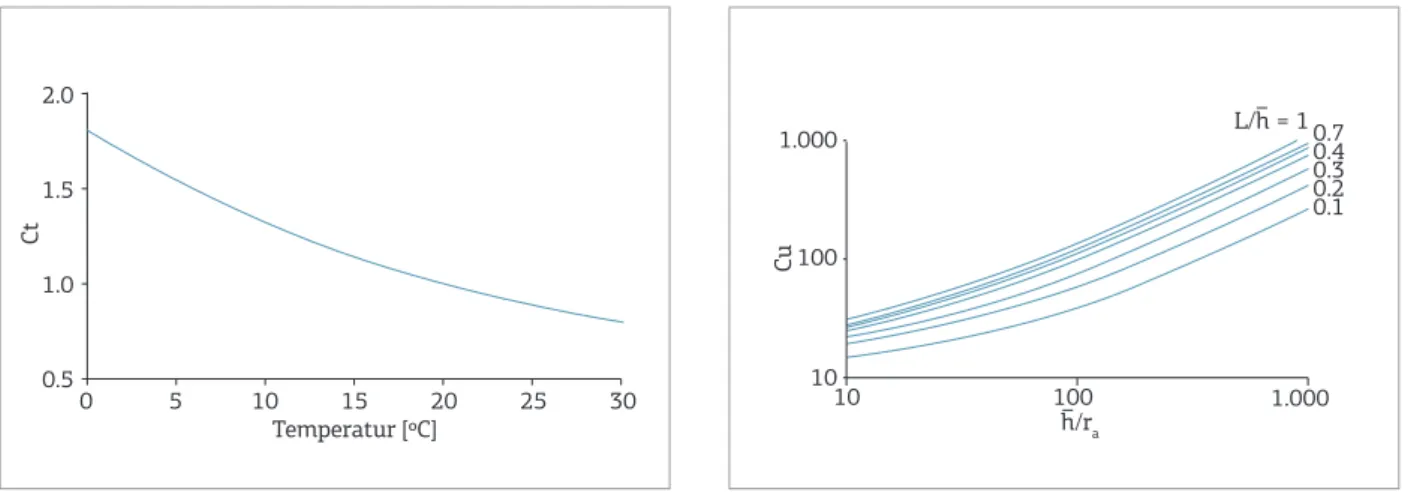
Figure 5. Correction factor for length of ilter material (Cu). Source: Earth Manual (1951 ater Scheytt &
Hengelhaupt 2001).
K=π∙∆h∙Ct∙ra
Cu∙h∙(τ
1-τ2)
(3)
Correction factors for Ct (temperature) and Cu (length of filter material) can be obtained from monograms of Earth Manual (1951 after Scheytt & Hengelhaupt 2001) (Figs. 4 and 5).
Comparing the open-end-hole test with the setup of permeability test after Heitfeld (1979), additional space at the bottom of the cased borehole is used. he space is illed with gravel and works as drainage space instead of an installed borehole with casing and screens.
Pedotransfer
Functions (Rosetta Software)
PTFs are recognized as an eicient method to predict soil hydraulic properties such as water retention and hydraulic conductivity. Reviews regarding the development and the use of PTFs can be found in Rawls et al. (1991), Wösten (1997), Pachepsky and Rawls (1999), and Wösten et al. (2001). here are few references on results of research with PTFs that had used database from tropical countries. Cresswell
et al. (1999) reviewed the application of PTFs to predict hydraulic properties of soils from Australia. Also in Australia, Minasny and McBratney (2002) applied the neural network method to predict the parameters of water retention of the van Genuchten (1980) equation. McKenzie and Jacquier (1997) presented a regression tree that predicts saturated hydraulic conductivity from soil morphology classes, includ-ing texture, structure and porosity. Minasny et al. (1999) predicted the parameters of the van Genuchten equation from basic soil properties and broad classes of soil texture.
In Brazil, estimations of hydraulic conductivity of kaolinitic Yellow Oxisols in the Amazonian region, based
on water retention curves, were obtained by Tomasella and Hoodnett (1997). Tomasella et al. (2000) used soil texture, organic carbon, equivalent humidity and soil density data to establish relations between the van Genuchten equa-tion and water retenequa-tion parameters. Gaiser et al. (2000) studied the inluence of clay minerals in soil water reten-tion from semiarid areas of western Africa and northwest-ern Brazil and showed that PTFs of soils with low activ-ity clay minerals difer from soils with high activactiv-ity clay minerals due to silt and organic carbon content. Hoodnett and Tomasella (2002) developed new PTFs for tropical soils related to water retention parameters used in the van Genuchten equation.
he van Genuchten equation was successfully applied to several diferent soils [e.g. soils reported by Villagra et al.
(1988) and Wösten and van Genuchten (1988)]. Van den Berg et al. (1997) found that this equation describes ade-quately the water retention curves of soils with low activ-ity clay minerals, commonly found in Brazilian soils. he parameters of the van Genuchten equation adapted to Brazilian soils showed high accuracy in the estimation of hydraulic conductivity, as observed by Hoodnett and Tomasella (2002).
Most of these PTFs were compiled by Schaap et al.
(2001) and integrated into the Rosetta software package, which estimates the parameters of water retention and the hydraulic conductivity according to models proposed by van Genuchten (1980) and Mualem (1976). Rosetta ofers ive PTFs that predict hydraulic properties of the soil from limited sets of input data. Hierarchic models use the follow-ing input data: soil textural classes; percentages of sand, silt and clay, density and a point of water retention in 330 cm (33 kPa) and the same parameters and water retention points in 330 and 15,000 cm (33 and 1500 kPa). he irst PTF
2.0
1.5
1.0
0.5
0 5 10 15
Temperatur [ºC]
Ct
20 25 30
Figure 4. Correction factor for temperature (Ct).
Source: Earth Manual (1951 ater Scheytt &
is based on average hydraulic parameters for varying types of soil texture. Other four models are based on analyses of neural network and usually provide more accurate fore-casts, depending on the quality of the input data. Besides the hierarchical approach, the model provides prediction of hydraulic conductivity based on van Genuchten (1980) and Mualem (1976).
In this study, 25 soil proiles from the Brazilian Soil Survey (Soil Map of the Federal District – Embrapa 1978) were used to estimate unsaturated K-values by applying PTFs available in the Rosetta software. Six types of more representative soils found in the study area (Red Oxisols, Red-Yellow Oxisols, Alisols, Inceptisols and Histosols) were described according to the textural and structural variations of each diagnostic horizon. In order to estimate the hydrau-lic conductivity more appropriately and to adapt the PTFs for soils of the Federal District, values of soil density (Dd) and gravimetric water contents (W)were obtained. PTFs developed by Benites et al. (2007), shown in equation (4) and Tomasella et al. (2003), shown in equation (5), are the most approximated equations:
Dd = 1.66141- 0.12455 N - 0.00042 Clay + 0.10622 SB - 0.00059 Fe2O3 - 0.00328 C:N + 0.00011 WDC + 0.00041 Al2O3 - 0.09597 (Ca+Mg) (4)
where N = total nitrogen (%); Clay = percentage; SB= bulk bases (Ca2+ + Mg2+ + K+, mE/100g; Fe
2O3 = mE/100g;
WDC= clay dispersed in water (%); Al2O3 = percentage; and Ca + Mg = mE/100g.
he PTF used to estimate the water retention parame-ters from van Genuchten’s equations in the range between -33 kPa (W33) and -1500 kPa (W1500) is as follow (Tomasella
et al. 2003):
X14 = - 1.05501 + 0.0650857 SI X15 = - 2.07588 + 0.0423954 CL X16 = - 6.03402 + 4.80572 Db X17 = - 2.18409 + 8.84963 Me
Z9 = 0.175202 + 1.18513x17 - 0.0996042 (x17)2 + 0.327915x 16
- 0.0758657(x16)2
Z10 = 0.929344z9 + 0.132519x14 W10kPa= 0.339255 + 0.112526z10
Z11 = 0.191452 + 1.25652x17 - 0.079098(x17)2+ 0.393814x 16
+ 0.152095x17x16
W33kPa = 0.28951 + 0.103815z11
Z13 = 0.235084 + 0.33033x15 - 0.191838(x15)2 +
0.0543679(x15)3 + 0.977685x
17+ 0.304174x15 x17 -
0.218857(x17)2 - 0.164373x 15(x17)
2 + 0.0415057(x 17)
3 +
0.373361x16 + 0.0811861x17 x16 - 0.0768087x15x17x16
W1500kPa = 0.214008 + 0.0862945z13 (5)
where CS = coarse sand (%); FS = ine sand (%); SI = silt (%); CL = clay (%); Db = bulk density (g.cm-3); Me =
mois-ture equivalent (%); W10kPa, W33kPa, W1500kPa gravimetric water content at 10, 33, and 1500 kPa, respectively (g.g-1); X
14-
X17 and Z9- Z11 and Z13, auxiliary variables.
Reference PTFs were chosen according to the follow-ing criteria:
■ involving only textural properties;
■ being developed from a vast amount of samples of Brazilian soils; and
■ having been extensively evaluated in terms of its applicability.
4. RESULTS AND DISCUSSIONS
To reach the objectives of this study, the main classes of soils from the Federal District were characterized in terms
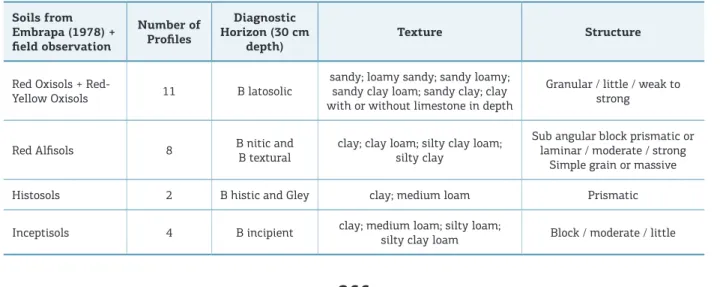
Table 1. Textural and structural characterization of major soil types from Federal District.
Soils from Embrapa (1978) + ield observation
Number of Proiles
Diagnostic Horizon (30 cm
depth) Texture Structure
Red Oxisols +
Red-Yellow Oxisols 11 B latosolic
sandy; loamy sandy; sandy loamy; sandy clay loam; sandy clay; clay with or without limestone in depth
Granular / little / weak to strong
Red Alisols 8 B nitic and
B textural
clay; clay loam; silty clay loam; silty clay
Sub angular block prismatic or laminar / moderate / strong
Simple grain or massive
Histosols 2 B histic and Gley clay; medium loam Prismatic
Inceptisols 4 B incipient clay; medium loam; silty loam;
of textural and structural features observed in ield and described by Embrapa (1978) (Tab. 1, Fig. 6). he diag-nostic horizons (approx. 30 cm depth) were considered as the basis for each proile classiication.
he results demonstrated a signiicant increase of clayey texture at a depth of between 50 and 100 cm in Oxisols. Proiles showed that more than 50% of Oxisols have clayey texture. Such characteristics reveal strong development of iner granular structure in Oxisols, which relects the high macroporosity of these soils. In average, these soils present 30% of sand, 10% of silt and 50% of
clay. Alisols also indicated the increase of clayey texture but in a lesser extent in relation to Oxisols. hese soils present about 30% of sand, silt and clay for all horizons and are also structured in blocks, with strong aggregation. he clayey texture is more apparent in the irst 20 cm of Histosols and Inceptisols. hese soils have slight decrease of clay content between 20 and 50 cm. hese soils did not occur at depths higher than 50 cm. he structures of these soils are prismatic, in blocks and, in some cases, massive.
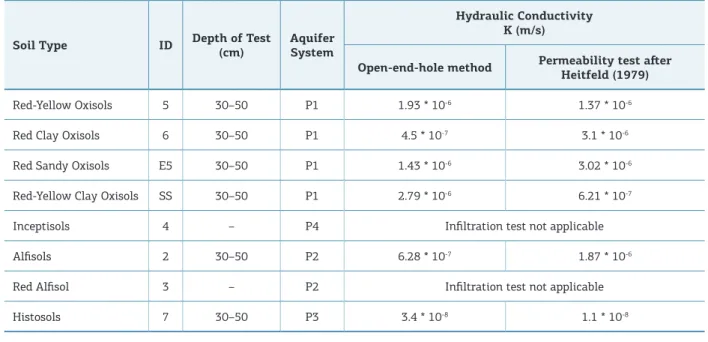
Open-End-Hole and
Permeability Test after Heitfeld (1979)
Results for open-end-hole tests and permeability tests after Heitfeld (1979) showed good correlation. he high-est diference between the two methods was found in the site ID 6 (14%). Results for P1, P2, and P4 hydrogeo-logical systems allowed estimating permeability values for diferent soils types, including Histosols and Alisols. he hydraulic conductivity of these soils ranged from 10-8
to 10-6 m.s-1 (Tab. 2).
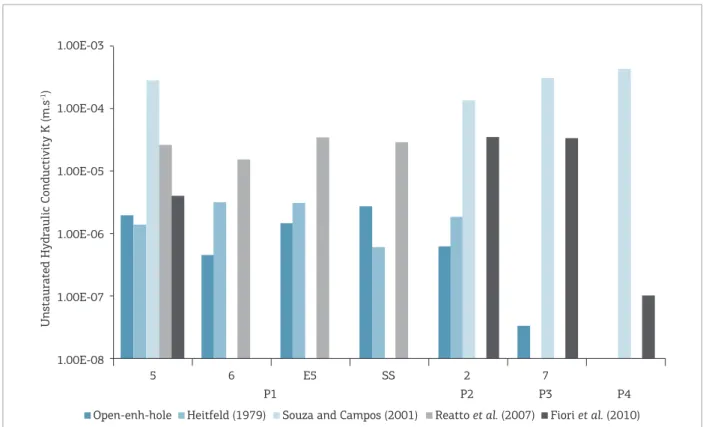
Because of the amount of ield tests, comparison between the results of this study and those obtained by previous inves-tigations in the Federal District and in Goiás State was nec-essary. Souza and Campos (2001), Reatto et al. (2007) and Fiori et al. (2010) reported K-values of soils based on in situ
iniltration tests and laboratory tests. Souza and Campos (2001) directly referred the results to the hydrogeologic units P1 to P4. Mean values of these studies of compara-ble depths and soils were taken to visualize diferences in results obtained by these studies and current study (Fig. 7).
Table 2. Results of hydraulic conductivity (K) values obtained by open-end-hole and permeability tests ater
Heitfeld (1979).
Soil Type ID Depth of Test
(cm)
Aquifer System
Hydraulic Conductivity K (m/s)
Open-end-hole method Permeability test ater Heitfeld (1979)
Red-Yellow Oxisols 5 30–50 P1 1.93 * 10-6 1.37 * 10-6
Red Clay Oxisols 6 30–50 P1 4.5 * 10-7 3.1 * 10-6
Red Sandy Oxisols E5 30–50 P1 1.43 * 10-6 3.02 * 10-6
Red-Yellow Clay Oxisols SS 30–50 P1 2.79 * 10-6 6.21 * 10-7
Inceptisols 4 – P4 Iniltration test not applicable
Alisols 2 30–50 P2 6.28 * 10-7 1.87 * 10-6
Red Alisol 3 – P2 Iniltration test not applicable
Histosols 7 30–50 P3 3.4 * 10-8 1.1 * 10-8
90
90
90
80
80
80 70
70
70 60
60
60
50 50
50 Sand (%)
Clay (%)
Silt (%)
40
40 40
30
30 30
20
20 20
10
10 10
Clay
Sand clay
Silty clay Silty clay loam
Silty loam Silt
SandLoamySand
Medium loam Sandy
loam Sandy clay loam
Clay loam
Figure 6. Triangular textural classiication of the soils applied in the study (data source: Lemos &
1.00E-03
1.00E-04
Fiori et al. (2010) Reatto et al. (2007)
Souza and Campos (2001) Heitfeld (1979)
Open-enh-hole 1.00E-05
Unstaurated Hy
draulic Conductivity K (m.s
-1)
1.00E-06
1.00E-07
1.00E-08
5 6 E5 SS 2 7
P2
P1 P3 P4
Figure 7. Comparison of K-values of soils from the Federal District and Goiás State obtained by diferent authors.
here was a good approximation with the results obtained by Reatto et al. (2007). K-values obtained by Souza and Campos (2001) were around one decimal power higher. K-values from Fiori et al. (2010) matched at good to very good approximation when compared with the soils char-acteristics observed in situ.
K-values Obtained by the Rosetta Method
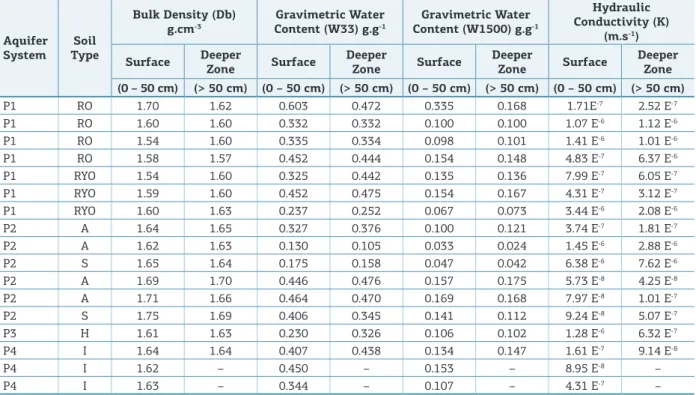
K-values from Embrapa’s data were obtained after adapt-ing PTFs for the Federal District’s soils by usadapt-ing appropri-ated values of soil bulk density (Db) and gravimetric water content in the Rosetta software (Tab. 3). Db of Oxisols ranged from 1.44 to 1.92 g.cm-3. Db from Alisols ranged
from 1.62 to 1.79 g.cm-3. Finally, Db from Inceptisols
and Histosols ranged from 1.60 to 1.65 g.cm-3. here was
an increase of Db values with increasing depth in most of soil proiles which can be explained by the increase of clay content and consequent decrease of total porosity and hydraulic conductivity. Gravimetric water contents at -33 kPa (W33) and -1500 kPa (W1500) from Oxisols ranged from 0.180 to 0.993 g g-1 and 0.048 to 0.834 g.g-1,
respectively. For Alisols, gravimetric water contents ranged from 0.049 to 0.514 g.g-1 and from 0.004 to 0.196 g.g-1
for the W33 and W1500, respectively.
Gravimetric water contents from Inceptisols and Histosols ranged from 0.272 to 0.466 g.g-1 and from 0.079
to 0.161 g.g-1, respectively. In general, these results showed
that the percentage of variance gradually decreased from 73 to 26% in Oxisols, from 75 to 25% in Alisols, and from 75 to 24% in Inceptisols and Histosols. It is related to the decrease in the proportion of porosity that retains water when the water potential decreases. he same evidence was noticed for varying soil types considered by Bruand et al.
(1988), Dexter (2004), and Reatto et al. (2007).
K-values calculated for Oxisols ranged from 3.44 * 10-6 to 1.71 * 10-7 m.s-1 in surface zone and from
2.08 * 10-6 m.s-1 to 2.53 * 10-7 m.s-1 in deeper zones.
For Alfisols, they ranged from 1.45 * 10-6 to 5.73 *
10-8 m.s-1 in surface zone and 2.88 * 10-5 to 4.25 *
10-8 m.s-1 in deep zone. Inceptisols and Histosols ranged
from 1.28 * 10-6 to 8.96 * 10-8 m.s-1 in surface zone and
from 6.33 * 10-7 to 9.15 * 10-8 m.s-1 in deeper zones
Table 3. Bulk density (Db), gravimetric water content (W) and hydraulic conductivity obtained from PTFs developed by Benites et al. (2007) and Tomasella et al. (2003), based on Rosetta sotware, and on Embrapa’s data.
RO: Red Oxisols; RYO: Red Yellow Oxisols; A: Alisols; H: Histosols; I: Inceptisols. Aquifer
System
Soil Type
Bulk Density (Db) g.cm-3
Gravimetric Water Content (W33) g.g-1
Gravimetric Water Content (W1500) g.g-1
Hydraulic Conductivity (K)
(m.s-1)
Surface Deeper
Zone Surface
Deeper
Zone Surface
Deeper
Zone Surface
Deeper Zone (0 – 50 cm) (> 50 cm) (0 – 50 cm) (> 50 cm) (0 – 50 cm) (> 50 cm) (0 – 50 cm) (> 50 cm)
P1 RO 1.70 1.62 0.603 0.472 0.335 0.168 1.71E-7 2.52 E-7
P1 RO 1.60 1.60 0.332 0.332 0.100 0.100 1.07 E-6 1.12 E-6
P1 RO 1.54 1.60 0.335 0.334 0.098 0.101 1.41 E-6 1.01 E-6
P1 RO 1.58 1.57 0.452 0.444 0.154 0.148 4.83 E-7 6.37 E-6
P1 RYO 1.54 1.60 0.325 0.442 0.135 0.136 7.99 E-7 6.05 E-7
P1 RYO 1.59 1.60 0.452 0.475 0.154 0.167 4.31 E-7 3.12 E-7
P1 RYO 1.60 1.63 0.237 0.252 0.067 0.073 3.44 E-6 2.08 E-6
P2 A 1.64 1.65 0.327 0.376 0.100 0.121 3.74 E-7 1.81 E-7
P2 A 1.62 1.63 0.130 0.105 0.033 0.024 1.45 E-6 2.88 E-6
P2 S 1.65 1.64 0.175 0.158 0.047 0.042 6.38 E-6 7.62 E-6
P2 A 1.69 1.70 0.446 0.476 0.157 0.175 5.73 E-8 4.25 E-8
P2 A 1.71 1.66 0.464 0.470 0.169 0.168 7.97 E-8 1.01 E-7
P2 S 1.75 1.69 0.406 0.345 0.141 0.112 9.24 E-8 5.07 E-7
P3 H 1.61 1.63 0.230 0.326 0.106 0.102 1.28 E-6 6.32 E-7
P4 I 1.64 1.64 0.407 0.438 0.134 0.147 1.61 E-7 9.14 E-8
P4 I 1.62 – 0.450 – 0.153 – 8.95 E-8 –
P4 I 1.63 – 0.344 – 0.107 – 4.31 E-7 –
they impose a great control of conditions of infiltration, regardless of the parent material.
High correlations were also observed in aquifers belong-ing to P2 system. Hydraulic conductivity from Alisols showed a similar range of values which was observed in tests after Heitfeld (1979) and by the Rosetta software. he average value estimated by Rosetta was 3.57 * 10-6 m.s-1,
while the value observed on the tests after Heitfeld was 1.87 * 10-6 m.s-1. The behavior of this soil class was
depth-dependent. here were both increase and decrease of hydraulic conductivity in depth, but Alisols showed the same behavior. It followed the expected pattern: clay
content increased with depth and this led to a decrease in hydraulic conductivity.
As noticed by previous studies (Souza & Campos 2001, Cadamuro et al. 2002, Fiori et al. 2010) and also by this study, Inceptisols presented the least favorable-conditions of iniltration and drainage. hese soils are poorly developed, derived from low-degree metasedimen-tary rocks, and occur in hilly regions (intense runof and limited iniltration). Based on iniltration tests and on comparison and addition of data derived by previous stud-ies, Tab. 4 shows K-values for diferent aquifer systems. hese are considered the typical values for the diferent
Table 4. Porous aquifer systems, soil types and K-values of Federal District soils.
Aquifers Systems Soil Type
Hydraulic Conductivity (k) (m.s-1)
Surface (0 – 50 cm)
Deeper Zone (> 50 cm)
P1 Red-Yellow Oxisols 10-5 – 10-6 10-6
P1 Red Clayey Oxisols 10-6 10-7
P1 Red Sandy Oxisols 10-5 – 10-6 10-6
P1 Red-Yellow Clayey Oxisols 10-6 10-6 – 10-7
P4 Inceptisols 10-6 10-7
P2 Red Alisols 10-7 10-7
P2 Alisols 10-7 10-7
shallow aquifers and the best it between the parameters and aquifer types.
5. CONCLUSIONS
Good correlation between observed and estimated data was found when ield permeability tests and PTF methods were used. Values of the P1, P2, P3 and P4 hydrogeological systems var-ied from 10-8 ms-1 to 10-6 ms-1. Highest K-values were found in
Oxisols, while lowest rates were found in Inceptisols. A decreas-ing conductivity trend was noticed as soil depth increased, mainly due to the presence of materials with loamy texture.
Contrary to the previous studies, results obtained from the Rosetta software indicated that porous aquifers of the Federal District are anisotropic, once the K-values chang-ing in space (vertically and also in diferent points for the same soil type), i.e. vertical and horizontal conductivity are commonly diferent. his evidence is related to variations of K-values within a single class of soil. Heterogeneity of porous aquifers is conditioned by the texture, structure and macroporosity of soils. On the other hand, anisotropic
behavior of soil layers can inluence the behavior of porous aquifers signiicantly. Depending on parent material, struc-tural elements (for instance, faults and fractures), and geo-morphological characteristics, diferent vertical water lows during the recharge can induce variable rates of inward low.
he thickness of porous aquifers in the Federal District ranged from few centimeters to 80 m, with predominance (> 60%) of thickness between 15 – 25 m. P1 and P2 sys-tems presented thickness higher than 20 m. he thickness of P3 system was lower than 10 m and, for the P4 system, lower than 1 m. In this system, the lack of saturation zone is common in saprolites, especially when developed on clayey rocks. Inceptisols usually have low K-values because their unsaturated zone lays directly on the rocky substratum.
ACKNOWLEDGMENTS
he authors would like to thank Prof. Edson Eyji Sano for English correction. he authors are also thankful for the funding by CNPq (Fellowships 2009/2010), and the IWAS-Agua/DF Project for their support in the data acquisition.
Almeida L., Resende L., Rodrigues A.P., Campos J.E.G. (eds.) 2006. Hidrogeologia do Estado de Goiás.Superintendência de Geologia e Mineração. Governo do Estado de Goiás. Brazil. 230 p.
Benites V.M., Machado P.L.O.A., Fidalgo E.C.C., Coelho M.R., Madari B.E. 2007. Pedotransfer functions for estimating soil bulk density from existing soil survey reports in Brazil. Geoderma, 139:90-97.
Beyer W. 1964. Zur Bestimmung der Wasserdurchlässigkeit von Kiesen und Sanden aus der Kornverteilungskurve. Wasserwirtsch-Wassertechn, 14:165-168.
Bouma J. & Van Lanen J.A.J. 1987. Transfer functions and threshold values: from soil characteristics to land qualities. In: BEEK, K.J. et al.
(eds.). Quantiied Land Evaluation. Proc. Workshop ISSS and SSSA,
Washington, D.C., April 27-May 2, 1986. Int. Inst. Aerospace Surv. and Earth Sci. Publ. 6, ITC, Enschede, The Netherlands, p. 106-110.
Brooks R.H.& Corey A.T. 1964. Hydraulic Properties of Porous Media. Civil Engineering Dept., Colorado State University, Fort Collins, CO, Hydrological Paper 3, 27 p.
Bruand A., Tessier D., Baize D. 1988. Contribution à l’étude des propriétés de rétention en eau des sols argileux: importance de la prise en compte de l’organisation de la phase argileuse. Comptes Rendus de l’Académie des Sciences, 307:1937–1941.
Cadamurro A.L.M. 2002. Aquíferos Fraturados. Proposta, Avaliação
e Aplicabilidade de Técnicas de Recarga Artiicial para Condomínios
Residenciais do Distrito Federal. Dissertação de Mestrado, Instituto de Geociências, Universidade de Brasília, Brasília, 130 p.
Campos J.E.G.& Freitas-Silva F.H. 1998. Hidrogeologia do Distrito Federal. In: Inventário Hidrogeológico e dos Recursos Hídricos
Supericiais do Distrito Federal. IEMA / SEMATEC / UnB, Brasília,
Brazil, p.1-84.
REFERENCES
Codeplan 1995. O relatório técnico sobre a nova capital da república, 4ª ed. Codeplan, Companhia do Desenvolvimento do Planalto Central. Brasília, Brazil, 316 p.
Coimbra A.R.S.R. 1987. Balanço hídrico preliminar do Distrito Federal. In: Inventário Hidrogeológico do Distrito Federal. GDF/ CAESB, Brasília, Brazil, p.50-78.
Cresswell H.P., Mckenzie N.J., Paydar Z. 1999. A strategy for determination of hydraulic properties of Australian soil using direct measurement and pedotransfer functions. In: Van Genuchten, M.Th., Leij, F.J., Wu, L. (eds). Characterization and Measurement of the Hydraulic Properties of Unsaturated Porous Media. Riverside, CA: University of California, p. 1143-1159.
Danalatos N.G., Kosmas C.S., Driessen P.M., Yassoglou N. 1994. Estimation of the draining soil moisture characteristic from standard data as recorded in routine soil surveys. Geoderma, 64:155-165.
Dexter A.R. 2004. Soil physical quality: Part I. Theory, efects of soil texture, density, and organic matter, and efects on root growth.
Geoderma, 120:201–214.
Embrapa 1978. Levantamento de Reconhecimento dos Solos do Distrito Federal. Boletim Técnico nº53. Rio de Janeiro, Brazil, 455 p.
Embrapa 2006. Sistema Brasileiro de Classiicação de Solos. 2.ed.,Embrapa
- Centro Nacional de Pesquisa de Solos, Rio de Janeiro, Brazil, 412 p.
Faria A. 1995. Estratigraia e sistemas deposicionais do Grupo
Paranoá nas áreas de Cristalina, Distrito Federal e São João D’Aliança - Alto Paraíso de Goiás. Tese de Doutorado, Instituto de Geociências, Universidade de Brasília, Brasília,199 p.
Gaiser T., Graef F., Cordeiro J.C. 2000. Water retention characteristics of soils with contrasting clay mineral composition in semi-arid tropical regions. Australian Journal of Soil Research, 38(3):523-526.
Gonçalves T.D., Roig H. L., Campos J.E.G. 2009. Sistema de
informação geográica como ferramenta de apoio à outorga dos
recursos hídricos subterrâneos no Distrito Federal.RevistaBrasileira de Geociências39(1):169-180.
Heitfeld K.H. 1979. Durhlassigkeitsuntersuchungen mittels. WD-Test.-Mitt. Ing.- u. Hydrogeology, 9:175-218.
Hoodnett M.G. & Tomasella J. 2002. Marked diferences between
van Genuchten soil water-retention parameters for temperate and tropical soils: a new water-retention pedo-transfer function developed for tropical soils. Geoderma, 108:155-180.
IBGE. 2012. Instituto Brasileiro de Geograia e Estatística. Atlas do Censo Demográico 2010 Disponível em: http://www.ibge.gov.br/
home/estatistica/populacao/censo2010.Acesso em: 03/06/2012
ISO. 2012. Geotechnical investigation and testing, Geohydraulic testing, Part 2: Water permeability tests in a borehole using open
systems, Final Drat, ISO/FDIS 22282-2:2012(E).
Lemos R.C.& Santos R.D. 1984. Manual de descrição e coleta de solo no campo. 2. ed. Sociedade Brasileira de Ciência do Solo, EMBRAPA-SNLCS, Campinas, Brazil, 46 p.
Lousada E.O. & Campos J.E.G. 2005. Proposta de modelos hidrogeológicos conceituais aplicados aos aquíferos da região do Distrito Federal. Revista Brasileira de Geociências, 35(3):407-414.
Mckenzie N.J. & Jacquier D.W. 1997. Improving the ield estimation
of saturated hydraulic conductivity in soil survey. Australian Journal of Soil Research, 35:803-825.
Minasny B. & Mcbratney A.B. 2002.The neuro-m method for itting
neural network parametric pedotransfer functions. Soil Science Society of American Journal, 66:352-361.
Minasny B., Mcbratney A.B., Bristow K.L. 1999. Comparison of
diferent approaches to the development of pedotransfer functions
for water-retention curves. Geoderma, 93:225-253.
Mualem Y. 1976. A new model predicting the hydraulic conductivity of unsaturated porous media. Water Resources Research, 12(3):513-522.
Novaes Pinto M. 1994. Caracterização geomorfológica do Distrito Federal. In: Novaes Pinto, M. (org). Cerrado: Caracterização, Ocupação e Perspectivas. Ed. UnB. 2.ed., Brasília,Brazil,p. 285-320.
Oliveira L.B., Ribeiro M.R., Jacomine P.K.T., Rodrigues J.J.V., Marques F.A. 2002. Funções de pedotransferência para predição da umidade
retida a potenciais especíicos em solos do estado de Pernambuco.
Revista Brasileira de Ciências de Solo, 26(2):315-323.
Pachepsky Y. A. & Rawls W.J. 1999. Accuracy and reliability of
pedotransfer functions as afected by grouping soils. Soil Science
Society of American Journal, 63(6):1748-1756.
Rawls W. J., Gish T.J., Brakensiek D.L. 1991. Estimating soil water retention from soil physical properties and characteristics. Advances in Soil Science, 16:213-234.
Reatto A., Bruand A., Silva E.M., Martins E.S., Brossard M. 2007. Hydraulic properties of the diagnostic horizon of Latosols of a regional toposequence across the Brazilian Central Plateau. Geoderma, 139:51-59.
Schaap M.G., Leij F.J., Van Genuchten M.Th. 2001. Rosetta: a computer program for estimating soil hydraulic parameters with hierarchical pedotransfer functions. Journal of Hydrology, 251:163-176.
Scheytt T. & Hengelhaupt F. 2001. Aufüllversuche in der
wassergesättigten und ungesättigten Zone – ein Vergleich unterschiedlicher Verfahren. Grundwasser, 6(2):71-80.
SCS. 1954. Soil Conservation Service. Hydrology Guide for Use in Watershed Planning. NRCS NationalEngineeringHandbook,Section 4. USDA. Washington DC.
SEDUH. 2006. Secretaria de Estado de Desenvolvimento Urbano e Habitação. Diagnóstico Preliminar dos Parcelamentos Urbanos Informais no Distrito Federal. Brasília, Brazil, 66p.
Souza M.T.& Campos J.E.G. 2001. O papel dos regolitos nos processos de recarga de aquíferos do Distrito Federal. Revista Escola de Minas, 54(3):315-323.
Souza M.T. 2001. Fundamentos para Gestão dos Recursos Hídricos Subterrâneos do Distrito Federal. Dissertação de Mestrado, Instituto de Geociências, Universidade de Brasília, Brasília, 94p.
Tomasella J. & Hoodnett M. G. 1997. Estimating unsaturated hydraulic conductivity of Brazilian soils using soil water retention data. Soil Science, 162:703-712.
Tomasella J., Hoodnett M.G., Rossato L. 2000. Pedotransfer functions for the estimation of soil water retention in Brazilian soils. Soil Science Society of American Journal, 64:327-338.
Tomasella J., Pachepsky Y., Crestana S., Rawls W. 2003. Comparison of two techniques to develop pedotransfer functions for water retention. Soil Science Society of American Journal, 67:1085-1092.
Van den Berg M., Klamt E., Van Reeuwijk L.P., Sombroek W.G. 1997. Pedotransfer functions for the estimation of moisture retention characteristics of Ferralsols and related soils. Geoderma, 78:161-180.
Van Genuchten M.Th. 1980. A closed form equation for predicting the hydraulic conductivity of unsaturated soils. Soil Science Society of American Journal, 44:892–989.
Villagra M.M., Matsumoto O.M., Bacchi O.O.S., Moraes S.O., Libardi P.L., Reichardt K. 1988. Tensiometria e varibilidade espacial em Terra Roxa Estruturada. Revista Brasileira de Ciência do Solo, 12:205-210.
Williams J., Ross P.J., Bristow K.L. 1992. Prediction of the Campbell water retention function from texture, structure and organic matter. In: van Genuchten, M.T.H., LEIJ, F.J., Lund, L.J. (eds.) Proceedings of the International Workshop on Indirect Methods for Estimating the Hydraulic Properties of Unsaturated Soils. Riverside, CA: University of California,p. 427-441.
Wösten J.H.M. 1997. Pedotransfer functions to evaluate soil quality. In: Gregorich, E.G., Carter, M.R. (eds.) Soil quality for crop production and ecosystem health. Developments in Soil Science, 25:221-245.
Wösten J.H.M., Pachepsky Y.A., Rawls W.J. 2001. Pedotransfer functions: bridging gap between available basic soil data and missing soil hydraulic characteristics. Journal of Hydrology, 251:123-150.
Wösten J.H.M. & Van Genuchten M.Th. 1988. Using texture and other soil properties to predict the unsaturated soil hydraulic functions. Soil Science Society of American Journal, 52:1762-1770.