FUNDAÇÃO GETÚLIO VARGAS
ESCOLA DE ECONOMIA DE EMPRESAS DE SÃO PAULO
SEBASTIAN HERMANN SCHRAMM
THE IMPACT OF BASEL III ON EUROPEAN BANKS BUSINESS MODELS
SÃO PAULO 2014
FUNDAÇÃO GETÚLIO VARGAS
ESCOLA DE ECONOMIA DE EMPRESAS DE SÃO PAULO
SEBASTIAN HERMANN SCHRAMM
THE IMPACT OF BASEL III ON EUROPEAN BANKS BUSINESS MODELS
SÃO PAULO 2014
Dissertação apresentada à Escola de Economia de Empresas de São Paulo da Fundação Getúlio Vargas, como requisito para obtenção do título de Mestre Profissional em Economia.
Campo do Conhecimento: International Master in Finance
Orientador Prof. Dr. RICARDO RATNER ROCHMAN
Schramm, Sebastian Hermann.
The Impact of Basel III on European Banks Business Models / Sebastian Hermann Schramm. - 2014.
65 f.
Orientadores: Paulo Soares de Pinho, Ricardo Ratner Rochman Dissertação (MPFE) - Escola de Economia de São Paulo.
1. Bancos - Europa. 2. Finanças internacionais. 3. Bancos internacionais - Regulamentação. 4. Basiléia III (2010). 5. Basel Committee on banking Supervision. I. Pinho, Paulo Soares de. II. Rochman, Ricardo Ratner. III. Dissertação (MPFE) - Escola de Economia de São Paulo. IV. Título.
SEBASTIAN HERMANN SCHRAMM
THE IMPACT OF BASEL III ON EUROPEAN BANKS BUSINESS MODELS
Dissertação apresentada à Escola de Economia de Empresas de São Paulo da Fundação Getúlio Vargas, como requisito para obtenção do título de Mestre Profissional em Economia.
Campo do Conhecimento: International Master in Finance
Data de Aprovação: ___/___/____.
Banca Examinadora:
_________________________________
Prof. Dr. RICARDO RATNER
ROCHMAN
_________________________________ Prof. Dr. PAULO JOSÉ JUBILADO SOARES DE PINHO
_________________________________ Prof. Dr. MARTIJN FRANCISCUS BOONS
RESUMO
O acordo Basel III representa, em diversos aspectos, uma verdadeira mudança no paradigma regulatório. Este trabalho examina uma amostra composta por 81 bancos europeus para detectar até que ponto o impacto do Basel III é já perceptível em modelos de negócios alternativos. Descobre-se que os ajustes nos modelos de negócios causados pelo Basel III são mínimos, enquanto que as principais mudanças entre 2010 e 2013 deveram-se a outros factores exógenos, como por exemplo a crise da dívida soberana europeia. Devido à longa observação e aos períodos de transição, as maiores mudanças nos modelos de negócios como consequência do Basel III estarão ainda para acontecer.
ABSTRACT
As Basel III represents a true regulatory paradigm shift in many respects, this paper examines a sample of 81 European banks to detect to what extent the impact of Basel III is already perceptible on alternative business models. It finds out that there have been only minor business model adjustments due to Basel III, while the main changes between 2010 and 2013 have taken place because of other exogenous factors, such as the European Sovereign Debt Crisis. Due to long observation- and transition periods, the major business model changes as response to Basel III are still ahead.
KEY WORDS: BASEL III, BANKS BUSINESS MODELS, STATISTICAL CLUSTERING, EUROPEAN BANKING SECTOR.
Table of Contents
Introduction ... 1
1. Pre- and Post-Crisis Screening of European Banks Business Models ... 3
1.1. Theory of Banks Business Models ... 3
1.2. Pre-Crisis Evolution of European Banks Business Models ... 5
1.3. Post-Crisis Evolution of European Banks Business Models ... 7
2. The Regulatory Environment ... 10
2.1. Regulation in Theory and Practice ... 10
2.2. Regulation under Basel II.5 and Basel III ... 12
3. Heading Towards a New Medium-Term Steady State ... 16
3.1. The Impact of Basel III on Banks Business Portfolio ... 16
3.1.1. The Impact of Basel III on Retail Banking ... 17
3.1.2. The Impact of Basel III on Corporate Banking ... 17
3.1.3. The Impact of Basel III on Investment Banking ... 18
3.2. Business-Model Adjustments as Reaction on Basel III ... 18
3.3. Business Model Refocusing under Basel III ... 20
4. Empirical Review of Business Model Adjustments ... 21
4.1. Data Collection ... 21
4.2. Methodology ... 21
4.3. Identification of Business Models ... 24
4.4. Business Model Transition (2010-2013) ... 28
4.5. Banks Capitalization under the Influence of Basel III ... 31
4.6. Bank’s Activity Portfolio under the Influence of Basel III ... 33
4.7. Sample Banks Risk Profile ... 35
4.8. Liquidity- and Funding Position by Business Model ... 38
4.9. Earnings and Profitability by Business Model ... 41
4.9.1. Earnings by Business Model ... 41
4.9.2. Profitability by Business Model ... 42
5. Conclusion ... 46
Appendix I. Basel III – Definition of Capital and Capital Buffers ... 51
Appendix 2. Basel II.5/Basel III – Trading- and Banking Book ... 53
Appendix 3. Basel III – Leverage Ratio ... 54
Appendix 4. Basel III – Global Liquidity Standard ... 55
Appendix 5. List of Variables and Sample of Banks ... 57
Appendix 6. The Eight Candidate Instruments ... 58
Appendix 7. List of Banks by Business Model ... 59
Appendix 8. Assumptions on the Net Stable Funding Ratio ... 60
Appendix 9. List of Abbreviations ... 61
List of Figures
Figure 1. Comparison of Clusters, Standardized Scores ... 24Figure 2. Dispersion of Return on Equity (All Banks, 2010-2013) ... 43
Figure 3. Transition Periods for Capital Requirements ... 52
List of Tables
Table 1. Regulation Matrix ... 12Table 2. Descriptive Statistics for the Four Clusters ... 25
Table 3. Evolution of the Size by Business Model ... 25
Table 4. Model Transition Matrix, Share of Banks (%) ... 28
Table 5. Nordea Bank Cluster Analysis ... 29
Table 6. Comparison Between New Wholesale Banks and Previously Diversified Retail Banks .... 30
Table 7. Capitalization of Sample Banks by Business Model ... 31
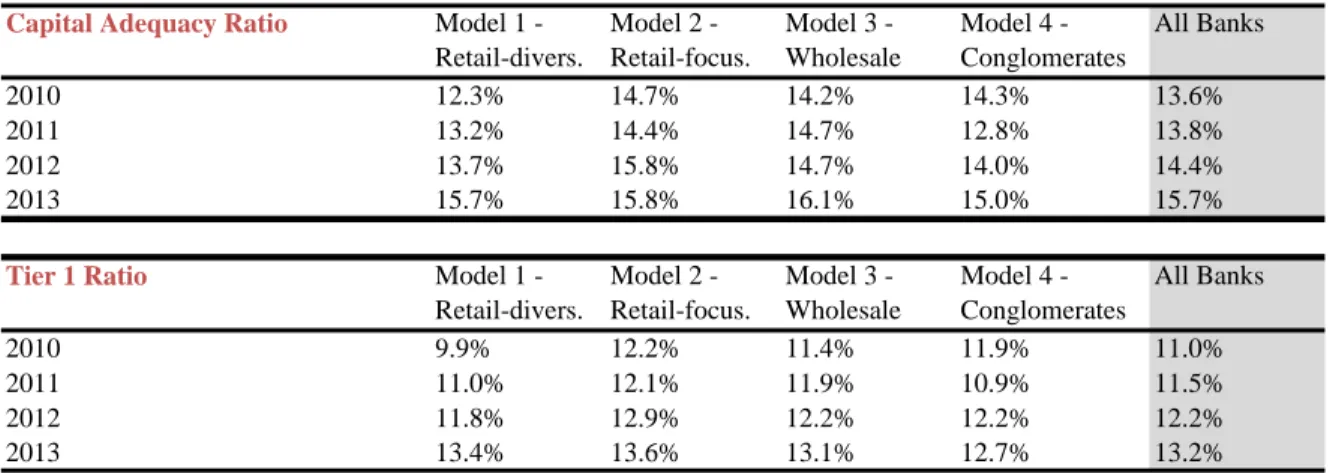
Table 8. Evolution of the Capital Adequacy Ratio and Tier 1 Ratio ... 32
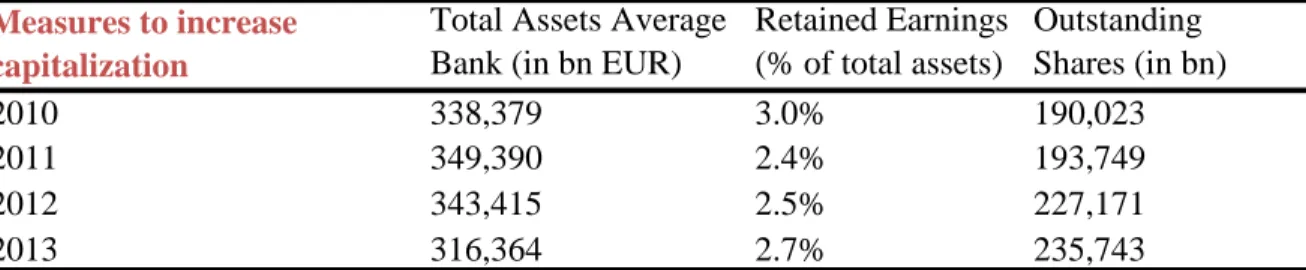
Table 9. Measures to Increase the Capitalization for all Sample Banks ... 33
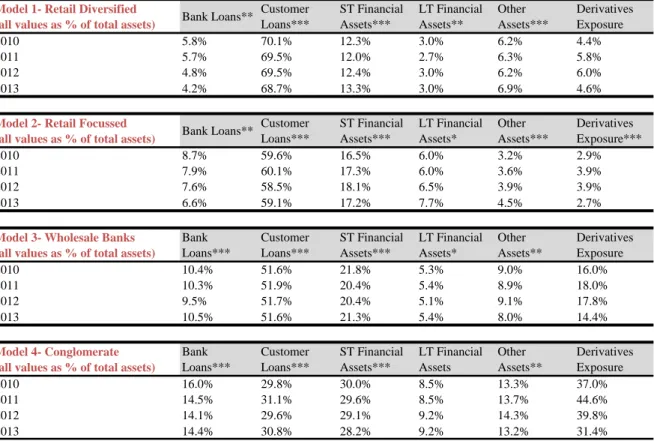
Table 10. Devlopment of Bank Activities by Business Model ... 34
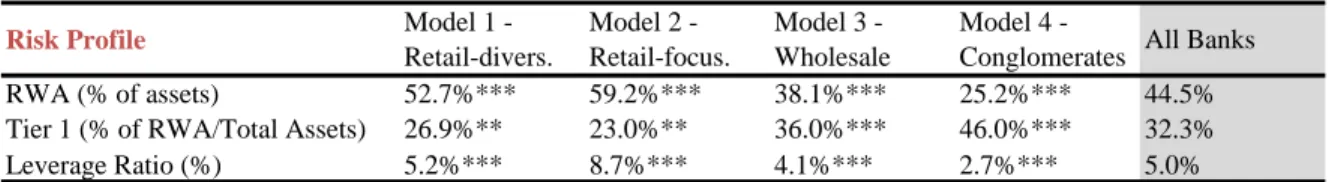
Table 11. Risk Profile by Business Model ... 35
Table 12. Development of RWA and Leverage Ratio by Business Model ... 36
Table 13. Evolution of Cash and Cash Equivalents ... 38
Table 14. Liquidity- and Funding Position by Business Model ... 38
Table 15. Evolution of the Net Stable Funding Ratio (NSFR) by Business Model ... 39
Table 16. Evolution of Funding Sources by Business Model ... 39
Table 17. Distribution of Net Revenue by Business Model ... 41
Table 18. Evolution of Net Interest, Commission and Trading by Business Model ... 42
Table 19. Performance Indicators ... 42
Table 20. Evolution of the RoA and RoE by Business Model ... 44
Introduction
This paper works on two dimensions: at first, it highlights the reciprocity between bank
regulation and European banks business models. Secondly, it analyzes the relationship
between banks pre-crisis and post-crisis business models. The research ambition of this
paper connects both dimensions. It explains how Basel III reacted on pre-crisis business
model developments before examining empirically to what extent European banks have
already adjusted their business models as response to Basel III. This shall emphasize the
reciprocity between regulation and banks business models.
Although the research interest of this paper refers mainly to the post-crisis stage, the
literature review on the pre-crisis developments is fundamental to understand the whole
picture of Basel III and its post-crisis effects on European banks business models. The
paper is structured in five parts and separates regulation and business models into a
pre-crisis and a post-pre-crisis stage.
In response to the pre-crisis financial deregulation in the EU and US, the first chapter
describes how business models diversified their business portfolio towards more trading-,
derivatives- and off-balance sheet exposure, which was eventually one of the main triggers
of the financial crisis.
The pre-crisis business model diversification is the necessary foundation to understand the
extensive capital-, trading book-, leverage-, liquidity- and funding requirements under
The chapters three and four constitute the main research ambition of this paper. The third
chapter moves to the post-crisis screening of banks business models and analyzes banks
main challenges in light of Basel III from a generic- and business-specific perspective. It
differentiates between retail-, corporate- and investment banking and analyzes how banks
might adjust their business portfolio to remain profitable under Basel III. Based upon the
more theoretical foundation in chapter three, empirical research in chapter four reviews to
what extent banks business models have already adjusted to Basel III. It categorizes a
sample of 81 European banks into alternative business models and discusses the impact of
Basel III on them. More generally, it shall be assessed if banks have already achieved a new
steady state in response to Basel III, or if more business model changes and adjustments are
to be expected in the future. Chapter five concludes the main findings of the previous
1. Pre- and Post-Crisis Screening of European Banks Business Models
1.1. Theory of Banks Business Models
While business models have established as a common and widely used expression in
profit-oriented firms, its academic understanding is ambiguous and rather abstract. Business
models can be characterized as holistic concept considering all elements that build the
anatomy of a firm’s core logic for creating and appropriating value (Klang et al., 2010). In bank terms, business models can be constituted as creating value1 from performing four economic core functions as risk managers, liquidity providers, maturity transformers and
financial innovators (Ayadi et al., 2011). In the absence of a detailed definition for the
concept of business models, their categorization/clustering is naturally not clear-cut (Jain,
2013). The reasoning is that business models are not one-dimensional, but vary along
certain key factors: size, business objectives, asset-side activities, capital- and funding
structure, ownership and governance, regulatory management, and geographic scope
(Liikanen, 2012; Llewellyn, 2013). Moreover, business models do also have a marketing
dimension. Some banks communicate business models as part of their branding strategy
that are actually not reflected in their fundamentals, i.e. in their risk profile, asset-side
activities or funding structure. While many European banks classify themselves as
universal banks, diversity remains as not all of them choose to provide the full range of
services (Liikanen, 2012). Banks differ in the scope of their business and to the degree that
they exercise a specific business.
1 From a shareholder perspective, the creation of value is measured by Return on Equity (ROE), although the ratio does not account for leverage.
Before the financial crisis, business models of European banks have not attracted much
attention from a regulatory point of view. The Basel Accords foresaw a “one size fits all” regulatory risk treatment across different business models (Ayadi et al., 2012). Only in
November 2011, the newly-established Financial Stability Board has formally started to
categorize 29 banks as globally systemically important financial institutions (G-SIFIs)
according to their size, complexity, systemic interconnectedness and lack of substitutes that
can readily take over their activities (Liikanen, 2012). While this classification is still quite
superficial, it can be considered as watershed point, does it also matter from a regulatory
perspective in requiring higher capitalization for these banks than for non-systemically
important banks. EU-wide stress tests of 115 from 8,746 European banks (EBA, 2014;
ECB, 2014) in 2011 and 2014 as well as ongoing discussions about ring-fencing specific
business lines2 are other indications that banks business models gain in significance from a regulatory and supervisory perspective in the EU. This underlines that clustering banks
according to their business models is contemporary and necessary. Pioneering work in this
field was achieved by Ayadi et al. (2011, 2012) who clustered 26, respectively 74,
European Banks according to a state-of-the-art statistical model in two papers published by
the Centre of European Policy Studies in Brussels. Yet, despite of the many advantages that
the categorization of business models may bring along, one should not forget that clustering
is a rather inaccurate science (Ayadi et al., 2011; Ayadi et al., 2012). This becomes
especially apparent in view of the fact that business models are not static and evolve over
2
Liikanen (2012) suggested two options to functionally ring-fence banks trading activities from banks other business lines. In more abstract terms, investment banking activities shall be internally separated from retail banking activities, but still be kept under a common holding structure in order to carry forward the universal banking model. In case of financial distress, ring-fencing shall help to safeguard the retail bank under a deposit insurance scheme (most likely up to €100,000) while phasing out investment banking activities.
time and under the influence of a complex mix of exogenous (e.g. European Sovereign
Debt Crisis) and endogenous pressures and in particular the scope and intensity of
regulation and supervision (Llewellyn, 2013).
1.2. Pre-Crisis Evolution of European Banks Business Models
European and U.S. financial markets became increasingly global and deregulated in the
1980s and 1990s3 (Ayadi et al., 2011). The majority of banks reacted by adopting explicit growth-oriented business models indicating that “traditional4” banking had saturated with limited growth opportunities (Llewellyn, 2013). Perceived “modern” banks amplified the
scope and extent of its business in search of scale- and scope economies and strived to take
advantage of diversification benefits from several income sources and the diversification of
risks (Barth et al., 2000). However, a number of empirical studies came up with the mutual
conclusion that the costs from higher exposure to volatility and increased risk-taking may
more than offset the before-mentioned benefits, leaving the true advantages of business
model diversification at doubt (DeYoung and Roland, 2001; Stiroh, 2004 and 2006; Stiroh
and Rumble, 2006). Diversification took place on both, the asset- and liability side of the
balance sheet. One of the core developments affecting asset side activities dealt with new
credit risk-shifting instruments (Llewellyn, 2013). Traditionally, banks acted as market
3 The two most important milestones in deregulation were the repeal of the Glass-Steagall Act in the US in 1999 that allowed the convergence of commercial- and investment banks and the Second Banking Directive (1989/646/EEC) in the EU in 1989 which harmonized the legal and regulatory framework and enhanced bank integration within the EU's internal market (single European passport). Although this paper restricts itself to European banks, US deregulation is important as it caused the subprime crisis which spilled over to the EU. On top, the Glass-Steagall Act is a good example of how regulation can impact business models. It separated business models and regulatory issues for investment- and commercial banks. While ring-fencing goes in the same direction as the Glass-Steagall Act, it is not as far-reaching and consequent in its implementation. 4 Traditionally, European banks predominantly took deposits and made loans to individuals and corporate (commercial banking). Some also underwrote stocks, bonds and provided advisory services (investment banking), and managed assets for individuals and institutions (asset and wealth management services) (Richardson et al., 2010).
makers in credit risk (originate-to-hold) by issuing loans and holding risks on their own
balance sheets. As part of new business models that emerged, banks started to act as
brokers in credit risk (originate-to-distribute) between ultimate borrowers and those who
either purchased asset backed securities (i.e. securitization) or who offered credit default
swaps insurance (Llewellyn, 2013). In other words, banks underwent a strategic shift from
the more traditional relationship model to a more transactional model (Van Ewijk and
Arnold, 2012). Furthermore, financial systems became more market-centric, which implied
a gain in importance of financial markets relative to institutions in the process of financial
intermediation (Ayadi et al., 2011). Banks increasingly diversified into investment, trading
and (OTC-) derivative activities,5 boosting the proportion of traded assets to total assets in many cases. At the same time, holdings of liquid assets declined as easier and greater
access to more integrated European wholesale funding markets became available. An
enhanced reliance on wholesale markets also raised the extent of maturity transformation,
respectively scaled up liquidity risks (Llewellyn, 2013). Overarching all of this was a clear
focus on maximizing return on equity (ROE) in the short-run (Llewellyn, 2007). Since the
ROE disregards underlying risks, banks became extremely profitable because of gearing,
securities trading and enhanced risk-taking (Alessandri and Haldane, 2009; Llewellyn,
2013). All these developments caused a change in nature of bank risks. As part of the
pro-cyclical transactional model described above, credit risk was transformed into liquidity- and
funding risks in case securitizing banks could neither sell assets at other than fire-sale
prices nor roll-over maturing debt in the wholesale markets (Ayadi et al., 2011). The
5 In comparison to the “traditional” business model other activities became increasingly important, such as dealer and market making activities, broker activities for professional investors and hedge funds, and proprietary trading (Richardson et al., 2010).
liquidity- and funding risks turned into a solvency risk because of gearing that led to an
undercapitalization – i.e. a lower resilience and reduced ability to absorb shocks and losses
– of many banks. The solvency risk for individual financial institutions finally ended up in a systemic risk, since business models of financial institutions – especially the large ones –
have converged, performing related asset-side activities, applying similar risk management
systems and being reliant on the same funding sources. While the European banking sector
has consolidated, aggregated bank assets rose to a peak of 350% of the EU’s GDP in 2007 (i.e. excess financialication of economies). When the crisis hit the EU in that year, the
banking sector was much larger, more complex, more interconnected and more integrated
(especially in the wholesale markets) across borders compared with the past (Liikanen,
2012). This all increased the risk of contagion effects. The enhanced interconnectedness
emerged through multiple channels including increased exposures in the inter-bank
markets, credit risk-shifting instruments, (OTC-) derivatives arranged among banks, many
banks trading the same securities and the decreased systemic diversity due to similar
business models of banks (Ayadi et al., 2011). To complete the picture, the
originate-to-distribute model has brought forth mostly unregulated shadow banks like Special
Investment Vehicles that came up as new players in the process of financial intermediation
(Tett, 2008).
1.3. Post-Crisis Evolution of European Banks Business Models
The paradigm shift in banks business models in the run-up of the financial crisis – enabled
actual crisis. On-going business model adjustments that are taking place as a reaction to the
financial crisis can broadly be separated into two time periods (Llewellyn, 2013):
In a first time period, business models have begun to adjust as an immediate response to the
financial crisis in order to strengthen bank’s resilience. Both, state-backed and privately-held European banks have started to deleverage, respectively de-risk their business to
achieve higher capital ratios. This can either be realized by increasing equity capital and/or
by the disposition of assets, respectively the downsizing of regulatory capital intensive
activities, especially those that are non-core (Liikanen, 2012). In May 2014, Wright (2014)
estimated that the total value of assets held in so-called “non-core units” set up in all
European banks (including Swiss banks) since 2008 has reached $2.5 trillion. However,
bank deleveraging is no panacea and may also have a negative economic impact. On the
one hand, deleveraging may squeeze the prices of security instruments and lead to
additional aggregated losses in the banking sector. These losses may give rise to increased
leverage which causes even more pressure to sell securities in order to compensate for this
effect – a vicious cycle (Liikanen, 2012). On the other hand, deleveraging reduces lending
to the real economy which in turn contributes to the European Sovereign Debt Crisis.
In a second time period, there will be a medium-term post crisis change towards a new
steady state in banks business models (Llewellyn, 2013). The vast amount of state support
to banks6 as well as the considerable liquidity support provided by central banks7 have in
6
More than €1.6 trillion of state aid was used to support the EU banking sector during 2008 and 2010 which represented 13.1% of the EU’s GDP in 2010 (Liikanen, 2012).
7 Amongst other monetary measures, around €1 trillion of three year Long-Term Refinancing Operations were granted by the ECB to provide banks with liquidity at a fixed-rate-full-allotment tender in order to substitute for drying up wholesale markets.
many cases averted – or at least delayed – the reorganization/restructuring of the European
banking sector to restrict financial instability and other adverse negative economic
consequences (Liikanen, 2012). Yet, the return to “normal” market conditions –
respectively the move towards a new steady state in bank’s business models – will require a phasing out of existent support schemes and state exit, as well as a restructuring of the
supported banks business models to ensure their long-term sustainability and in order to
ban market distortions (Liikanen, 2012). In so far, wider business model restructuring can
be expected to continue and may even accelerate towards a new steady state in the medium-
term. Besides state aid restructuring obligations, the core reasons for the on-going business
model restructurings will be enhanced regulatory and supervisory reformations. Even more
importantly, investors and capital markets seem to have become more sensitive to bank
risks after the crisis. They expect banks to comply with new regulation as quickly as
possible despite of regulatory transition periods. As a result, banks have to consider a
substantial time dimension in the post crisis adjustment of their business models.
As the dates for locating both time periods are necessarily uncertain, chapter 4 addresses
empirically to what extent banks may have achieved a new and more sustainable steady
state in their business models already. Chapter 3 gives a more in-depth definition of what a
new steady state in business models means. In so far, a new steady state is synonymous for
2. The Regulatory Environment
2.1. Regulation in Theory and Practice
Financial deregulation in the EU and US induced the diversification of banks business
models which was eventually one of the main causes that led to the financial crisis. In light
of the severity of the financial crisis, pre-crisis regulation and supervision seemed to be
inadequate (Liikanen, 2012). However, is there a commonly accepted “adequate” level of
regulation and supervision? Ongoing discussions between regulators, academics and
bankers argue around this question without finding consensus, being at doubt if there is a
truly “adequate” level of regulation, at all. This paper does not want to give a qualitative
judgment on the adequacy of regulation and accepts the regulatory environment as given.
However, deregulation does not mean “no regulation”. Despite of deregulation in the EU and US in the 1980s and 1990s, the Basel Committee on Banking Supervision (BCBS) was
founded in 1988 to introduce regulatory minimum standards for banks and create a
harmonized International8 level playing field, whereas a vast regulatory diversity remained on national level.9 Basel I (1988) related bank’s capitalization with their risk as measured by risk weighted assets (RWA).10 Basel II, which was published and implemented in 2004 and 2007 respectively, extended the regulatory framework for two pillars and established a
three pillar structure consisting of minimum capital requirements (pillar 1), reinforcement
8 According to J.P. Morgan, more than 100 nations have adopted Basel III in national law.
9 Many European countries were lagging to introduce new Basel regulations on national level, not really generating a harmonized level playing field. National regulators had several discretions and options in the implementation. Basel III is largely implemented as binding EU-regulation that is not dependent on national implementation processes creating a true harmonized level playing field in Europe for the first time.
10 Cooke Ratio: Banks had to hold more than 8% of its RWA in Basel I. Although the calculation of RWA changed in Basel II, the minimum capital ratio remained at 8%.
of supervision (pillar 2) and market disclosure requirements (pillar 3).11 The decisive changes in pillar 1 of Basel II were bank’s admission to use internal models to measure
credit-, market- and operational risks.
Many banks business models tried to circumvent Basel’s regulatory minimum requirements by taking risky assets off the balance sheet and transfer them to Special Investment
Vehicles, while keeping assets with low risk weights on their balance sheets. This
generated low capital requirements, increased gearing, and eventually resulted in a high
ROE. Basel III addresses some of these “regulatory arbitrage” opportunities which
underlines that business models and regulation are reciprocal. This reciprocity is reflected
by a fundamental regulatory endogeneity problem (Ayadi et al., 2012; Llewellyn, 2013).
While regulatory strategy conventionally assumes that the issues to be addressed, e.g.
increased gearing as described above, are exogenous to the regulatory process, problems
may be at least partly endogenous to regulation, i.e. caused by the very regulation itself
(Ayadi et al., 2012). Banks try to circumvent regulation by changing their business models
and by financial innovations. In turn, this calls for even more regulation and is described as
Kane’s Regulatory Dialect (Kane, 1987). The endogeneity problem can also be interpreted in light of the history of the Basel Accords. Basel was already revised twice (Basel I
Basel III) implying that the Basel Accords may head towards the “perfect” regulatory model (Basel N) by correcting for previous errors (Ayadi et al., 2012). Again, the
controversial question arises if there is a “perfect” regulatory model, at all?
11
Overall, one can differentiate incremental and strategic regulation. While the Basel Accords
are solely incremental, strategic regulation tries to figure out a trade-off between the two
elementary objectives of any regulatory process: 1) lowering the probability of bank
failures and 2) minimizing the cost of failure (Llewellyn, 2013). The more the cost of
failure can be diminished, the less intense bank regulation has to be (see table 1).
Table 1. Regulation Matrix
The infrastructure of the EU towards a European Banking Union seems to move more and
more towards strategic regulation: while the Basel Accords support objective 1, the recently
agreed on European Recovery and Resolution Directive supports objective 2.
2.2. Regulation under Basel II.5 and Basel III
As pre-crisis regulation and supervision seemed to be inadequate (Liikanen, 2012), the
BCBS faced the difficult challenge to determine a degree of regulation that is “more adequate12” as a response to the financial crisis. On the one hand, tighter and incremental regulation should address the regulatory shortcomings in business models to strengthen
bank’s resilience (micro-prudential regulation) and prevent negative network externalities due to an increased interconnectedness (macro-prudential regulation). On the other hand,
incremental regulation should allow banks sufficient freedom to carry out their four
economic core functions which are integral to the real economy.
12 The distinction between an “adequate” and a “more adequate” degree of regulation is crucial. As discussed above, there is no straight-forward definition of a truly “adequate” degree of regulation.
Low High Low High Cost of Failure Probability of Failure
The determination of a “more adequate” level of regulation was exacerbated by difficult exogenous- and endogenous factors. At first, banks experienced vast losses during the
financial crisis and started to deleverage/de-risk their business models as an immediate
response to the crisis. Secondly, banks curbed lending to the real economy as a response to
the European Sovereign Debt Crisis. At last, Europe is stuck in a historical period of low
interest rates which reduces bank’s interest margin. Accounting for these correlated and self-reinforcing factors, the BCBS’s regulatory reaction can be divided into two time
periods: an immediate (Basel II.5) and a medium-term regulatory response (Basel III).
Basel II.5 – as immediate regulatory response – deals only with the most obvious
regulatory shortcomings in the forefront of the financial crisis, which was bank’s strategic
shift towards a more transactional business model and the increasing significance of bank’s trading book. Basel II.5 is the regulatory response to enhanced market risks (especially of
credit-related products) in bank’s trading book, (re-) securitizations and off-balance sheet
exposure.13 Basel II.5 has been put under the EU Capital Requirement Directives (CRD) II & III which had to be transposed into national law by 2011 and 2012, respectively, with
several options and discretions at national level.
While Basel II.5 has been an intermediate step, Basel III can be interpreted as true
paradigm shift in many respects that should shift banks towards a new steady state in the
medium-term. Most importantly, its EU equivalent, namely CRD IV, is formulated largely
as an EU-regulation for the first time,14 which means it is a directly applicable act and does
13 For more information on Basel II.5 see Appendix 2.
14 The banking crisis in Cyprus in 2012 enabled Basel III to be implemented as regulation rather than EU-directive that leaves several discretions and options in the national implementation process.
not require national implementation. In so far, Basel III is called a “single rule book” which generates a true European level playing field and represents the first step towards an
intended European Banking Union. Basel III was introduced through several consultative
papers and amendments in 2009 and 2010. In September 2010 the BCBS endorsed the
ultimate annex which concludes the Basel III framework. CRD IV finally came into force
in 2013. This is also the reason why the empirical part in chapter 4 analyzes the time frame
between 2010 and 2013 to assess the impact of Basel III on business models.
The four most important regulatory cornerstones of Basel III are as follows15:
1) The BCBS introduces new definitions to raise the quantity and quality of capital in
order to increase banks loss-absorbency ability. Further, it addresses the
pro-cyclicality of banks business models by a countercyclical buffer (see Appendix 1).
2) Basel III builds upon Basel II.5 and further tightens trading- and banking book
regulation to better address counterparty credit risks, centralize the clearing of
OTC-transactions and limit the interconnectedness of financial institutions. Further, it
shall limit regulatory arbitrage opportunities by shifting assets from the banking to
the trading book (see Appendix 2).
3) Basel III foresees a leverage ratio to address banks increased leverage to achieve
high ROE ratios. The leverage ratio as a volume-based capital framework shall act
as a “backstop” and complement to the risk-based capital framework. Further, it shall limit regulatory arbitrage possibilities on grounds of RWA (see Appendix 3).
15 This paper focuses mainly on the innovations of Basel III in pillar 1 (quantitative minimum requirements) and only touches on regulatory changes in pillars 2 and 3 where necessary for the understanding of this paper.
4) Basel III introduces a new global liquidity standard and reacts on the increased
liquidity risks of banks due to their dependency on wholesale funding and declining
liquid assets. The liquidity standard shall also ensure a more balanced maturity
transformation (see Appendix 4).
All regulatory alterations and innovations have transition periods up to 2018 in order not to
exacerbate banks in a difficult market environment. Consequently, banks business models
are supposed to reach a new steady state only in the medium-term. However, it is important
to mention once more that capital markets have become more risk-averse and will urge
banks to comply with intended regulation rather sooner than later. Banks will compete on a
time dimension.
As already described above, business models slowly gain in significance in Basel III, which
opposes the previous “one size fits all” regulation. Regulators currently negotiate about an additional capital surcharge between 1% and 2.5% of RWA of first-class CET1 capital (see
Appendix 1) for G-SIFIs depending on bank’s complexity, interconnectedness, size, cross
jurisdictional activity and readily available substitutes. Further, it is still under negotiation
if the scope of the leverage ratio will be dependent on banks business models, respectively
if the leverage ratio is only applicable to a few banks (similar to the G-SIFI classification)
3. Heading Towards a New Medium-Term Steady State
3.1. The Impact of Basel III on Banks Business Portfolio
The European regulatory landscape is undergoing a consecutive change. On the one hand,
regulation agreed on under Basel III has long observation- and transition periods enabling
the modification of relevant details. On the other hand, incremental regulatory reforms are
still in progress (e.g. the fundamental review of the trading book16). However, while uncertainty about the future regulatory landscape persists, two important conclusions can be
drawn: at first, modified or incremental regulation is unlikely to mitigate the requirements
on European banks. Secondly, European banks have to react and adjust their business
models to the regulations under its current shape and under time pressure of supervisors and
financial markets. While banks comprehensive future reaction on new regulation is
undeterminable at present, this chapter focuses on business model impacts and reactions
that appear realistic from a present-day perspective.
The impact of Basel III on bank’s business models can be divided into two types: a generic and a specific impact (Härle et al., 2010). The former affects all banks and business models
equally, such as the new capital and leverage ratios affect all businesses pro rata. The
generic impact is the more severe, the more marginally profitable is a business. However,
the whole business portfolio suffers except the increased regulatory costs can be passed on
to customers. On the other hand, the business-specific impact of Basel III includes inter alia
new risk weights, liquidity- and long-term funding ratios that were imposed specifically to
address risks that became apparent during the financial crisis, such as liquidity shortages,
16
(re-)securitizations or increased trading. In the following, the generic- and business-specific
impact of Basel III on bank’s three main business segments, namely retail-, corporate- and investment banking,17 shall be assessed.
3.1.1. The Impact of Basel III on Retail Banking
The impact of Basel III is mainly generic, because of higher capital ratios. As the business
with retail- and SME customers is little voluminous, gearing and the volume-based
leverage ratio is less important. Similarly, the business-specific impact is less relevant
because new market risk-related regulation in the trading book is not applicable to the retail
segment, which is a traditional banking book area. Moreover, retail banking goes along
with stable funding sources as even demand- and term deposits with residual maturities of
less than one year (i.e. short-term deposits) are nearly fully accepted as long-term funding
instruments.18 On the other hand, long-term funding requirements for mortgages were reduced.19 The main business-specific impact is due to higher risk weights related to credit risk of retail loans and (residential-) mortgages.
3.1.2. The Impact of Basel III on Corporate Banking
The impact of Basel III on corporate banking is both, generic and specific. Generically,
particularly the leverage ratio as volume-based capital requirement affects the larger scale
(i.e. voluminous) corporate banking businesses (e.g. structured finance or trade finance).
Specifically, long-term corporate loans and long-term asset-based finance businesses (e.g.
17
Business segment activities such as Asset Management-, Insurance-, Hedge Funds- or Private Equity-businesses shall be excluded at this point.
18 Non-maturity (demand) deposits and term deposits with residual maturities of less than one year provided by retail and small- and medium-sized entity customers receive a 95% Available Stable Funding Factor. 19
project finance or commercial real estate) require higher stable funding which increases the
funding costs. Products that will be especially hard hit are those with relatively high risk
weights such as specialized lending, unsecured loans or trade finance.
3.1.3. The Impact of Basel III on Investment Banking
From all three business segments, the impact of Basel III on investment banking is most
business-specific. The greatest business-specific impact is on the trading business, because
increased trading has been one of the main causes for the financial crisis. This is another
clear indication for the reciprocity between business models and regulation. Basel III
affects mainly the market risk-, (re-) securitization- and OTC-transaction framework. The
trading business faces stricter regulation regarding risk weights, internal models (e.g.
stressed Value at Risk) and stable funding. Besides the product-specific impact, investment
banking is also generically affected. As investment banking traditionally has the lowest
RWA (see table 11), it is strongly impacted by the leverage ratio.
3.2. Business-Model Adjustments as Reaction on Basel III
Basel III impacts retail-, corporate- and investment banking in different ways. While retail
banking is affected least, the more voluminous corporate banking is hit especially in
specialized lending and trade finance. Investment banking finds multiple core businesses
affected, especially (re-)securitizations and trading (Härle, 2010).
As an alternative definition20, banks business models can be defined as creating value from performing activities of one or a combination of the three business segments (retail-,
20
corporate or investment banking). Again, the scale and scope of each business segment
differs across banks which defines the distinctiveness of their business models. Given the
new regulatory landscape under Basel III, banks will have to review their business portfolio
and determine where value is created. Banks have to assess the relative significance of each
business and the consequences for the overall portfolio of retaining it. Based upon a
profound understanding of the impact of the new capital-, leverage-, liquidity- and funding
requirements on each segment and product, the business portfolio will have to be reviewed
using a top-down approach. This is crucial to grasp the interdependencies, links and
trade-offs among the business segments such that each asset has an impact on the bank’s capital and leverage position and each asset and liability affects the bank’s short-term liquidity and funding position.
While shareholders and the financial markets consider ROE the most important indicator
for banks value creation/profitability, the ROE is inadequate for reviewing the business
portfolio internally. To measure the creation of value, each bank’s activities have to be
adjusted for risk, capital, funding and volume in order to prevent cross-subsidization. This
is nearly impossible to be represented by a single indicator like the ROE. Although Return
on Risk-Adjusted Capital (RORAC),21 which often comes into play as better substitute for the ROE, adjusts banks activities for risk and uses economic capital, it does not take
funding and volume into account. In reality, the review of the business portfolio is much
more sophisticated than ROE or RORAC. Further factors such as the intended product-,
customer- or geographical mix as well as risk transfer possibilities, costs and (re-) pricing
21
power have to be taken into consideration. It is a combination of strategic (customer- &
cost-) focus and the question which of the business segments can be efficiently served by
the bank. To sum up, business model adjustments mean to create capital- and
liquidity-efficient business models- and products and to rethink the scope and even the viability of
specific business lines to serve target clients in the respective target region. While some
businesses require only minor adjustments, others will be hit fundamentally. One can
assume that businesses that are specifically hit by Basel III (i.e. business-specific impact)
are more subject to business model adjustments than business segments that are more
generically affected. For instance, capital market- and trading businesses may be strongly
cut due to the new business-specific regulation of Basel III.
3.3. Business Model Refocusing under Basel III
Diversification in the run-up of the financial crisis led to a convergence of business models.
Especially large European banks performed a combination of retail-, corporate- and
investment banking services. Basel III could reverse the trend and increase business model
concentration (e.g. niche players). This will decrease competition but increase the diversity
in European banking, which makes crisis less systemic. Due to the stronger regulation of
capital market- and trading businesses, one can assume that banks move back towards more
“traditional” banking models. Further, it can be expected that the banking sector continues to consolidate (increased M&A), especially after banks are no longer backed by state aid.
4. Empirical Review of Business Model Adjustments
4.1. Data Collection
The Basel III framework has been finalized in 2010 and came into effect in the beginning
of 2013 on grounds of the European CRD IV package. To examine the impact of Basel III
up to now, European banks business models shall be analyzed based upon year-end figures
from 2010 to 2013. 115 European banks22, which undergo the EU-wide stress test by the European Banking Authority in 2014, served as starting point for the sample of banks. For
each sample bank 44 variables should be collected. The variables were compiled to get
insight into banks asset and liability structure, earnings, profitability, regulatory compliance
and other indicators (see Appendix 5). The final sample under study comprises a total of 81
European banks from 21 countries for which all variables were available (see Appendix 5).
The sample of banks accounted for approximately 61% of all deposit-taking institutions in
the EU-27 in 2013. As all sample banks undergo the stress test by the EBA, they can be
considered comparable and suitable for the cluster analysis. Data was collected from
Bloomberg and from the annual reports of all 81 European banks. This resulted in 3,564
bank year observations, respectively 14,256 observations for the whole time period.
4.2. Methodology
In line with the study’s aim of identifying alternative business models and investigating empirically their adjustments as response to Basel III in the time period between 2010 and
2013, the analysis was conducted in two stages. At first, several variables from Appendix 5
were selected as instruments for clustering the sample of banks into distinct business
22
models by applying statistical tools described in two papers published by Ayadi et al.
(2011, 2012). Second, the clustered banks were evaluated based upon their business model
adjustments as well as their performance, earnings, riskiness and regulatory compliance.
For the purpose of this study, cluster analysis refers to the categorization of a set of
observations for each bank per year into alternative business models (i.e. distinct clusters).
Banks that are assigned to the same cluster share a certain degree of homogeneity while
alternative clusters are sufficiently dissimilar. As a first key step, the composition of
clusters requires the selection and definition of instruments from the 44 collected variables
to identify similarities and distinctions. As the objective of this study is to define business
models, the candidate instruments should span all core areas of activity of the sample banks
and should underline that bank managers consciously choose their business models. In so
far, the cluster analysis is based upon instruments over which the bank has a direct
influence, such as its key banking activities, funding strategies, financial exposure and risk.
Performance indicators – profitability ratios or P&L indicators – are not within the bank’s
direct influence because they depend on exogenous factors like market- or macroeconomic
conditions. They are not part of the clustering. In order not to over- or under-represent any
particular function of the bank, the cluster analysis begins with a larger set of eight
candidate instruments23 and evaluates possible permutations to select the most appropriate subset (see Appendix 6).
Technically, Ward’s (1963) hierarchical (agglomerative-) clustering method is used to form the clusters. The approach starts with considering each bank/year as separate cluster before
23 All of the instruments used for clustering were standardized so that each indicator had a mean of zero and a standard deviation of one.
merging the banks by minimizing the within-cluster sum-of-squared-errors for any given
number of clusters. To diagnose the appropriate number of clusters (i.e. stopping rule)
under the best possible configuration of candidate instruments and to ensure the highest
possible degree of objectivity, this paper follows several steps systematically. At first, a
long-list of 30 possible configurations24 were ranked according to the Calinski and Harabsz pseudo F-index25 and the distance/distinctiveness of the “optimal number of clusters” (=cluster with the highest pseudo F-index) from its corner cases.26 Secondly, a short-list of the highest ranked five configurations was selected. Thirdly, among the short-listed
candidates, the configuration of instruments and number of clusters with the easiest
interpretation was chosen. The clustering procedures and multiple configurations were
conducted by Stata’s built-in functions and Excel.
Although this study tries to ensure the highest possible objectivity, it has to be noted that
cluster analysis is an inexact science that crucially depends on the candidate instruments,
cluster methodology or stopping rule. Although multiple configurations were scrutinized to
address the arbitrariness of these aspects, the following results should be analyzed with
care.
24 One configuration consists of a minimum of five and a maximum of eight candidate instruments. Configurations with less than five instruments result in a too high number of non-interpretable clusters. 25
The Calinski and Harabsz peusdo F-index represents the ratio of between-to-within-cluster standard errors. 26 The optimal number of clusters for this paper should range somewhere between three and nine. In order to emphasize the distinctiveness of the optimal number of clusters under each configuration, the distance between the pseudo-F index of the optimal number of clusters and the pseudo F-index of two- and ten clusters (=corner cases) were measured and considered for the ranking.
4.3. Identification of Business Models
Nearly all of the long-listed 30 configurations indicate two clusters as the most appropriate
number of clusters according to the pseudo F-index. While this result goes along with the
convergence of banks business models in the run-up to the financial crisis, it indicates that
Basel III has not yet contributed to more business model diversity after the financial crisis.
As two clusters are inappropriate for the study goals of this paper, configurations with more
than two clusters were assessed although the pseudo F-index was lower. Eventually, four
alternative business models from a configuration of the five instruments customer loans,
trading assets, derivatives exposure, customer deposits and tangible equity, were selected as
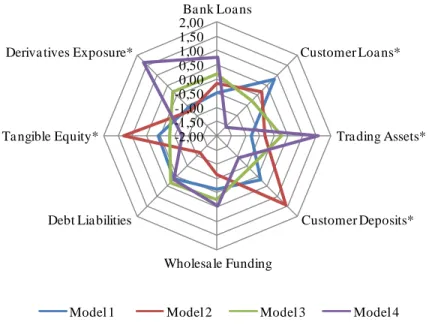
most consistent, distinct and easy to interpret cluster solution. 27
Figure 1. Comparison of Clusters, Standardized Scores
27 Table 2 shows standardized results with a mean of 0 and a standard deviation of 1. The numbers indicate standard deviations from the sample mean (= 0), which implies that any observation above or below the zero-axis is above or below the sample mean. The instruments marked with an asterisks (*) belong to the five instruments that show the best configuration.
-2,00 -1,50 -1,00 -0,50 0,00 0,50 1,00 1,50 2,00 Ba nk Loa ns Customer Loa ns*
Tra ding Assets*
Customer Deposits* Wholesa le Funding
Debt Lia bilities Ta ngible Equity*
Deriva tives Exposure*
Table 2. Descriptive Statistics for the Four Clusters
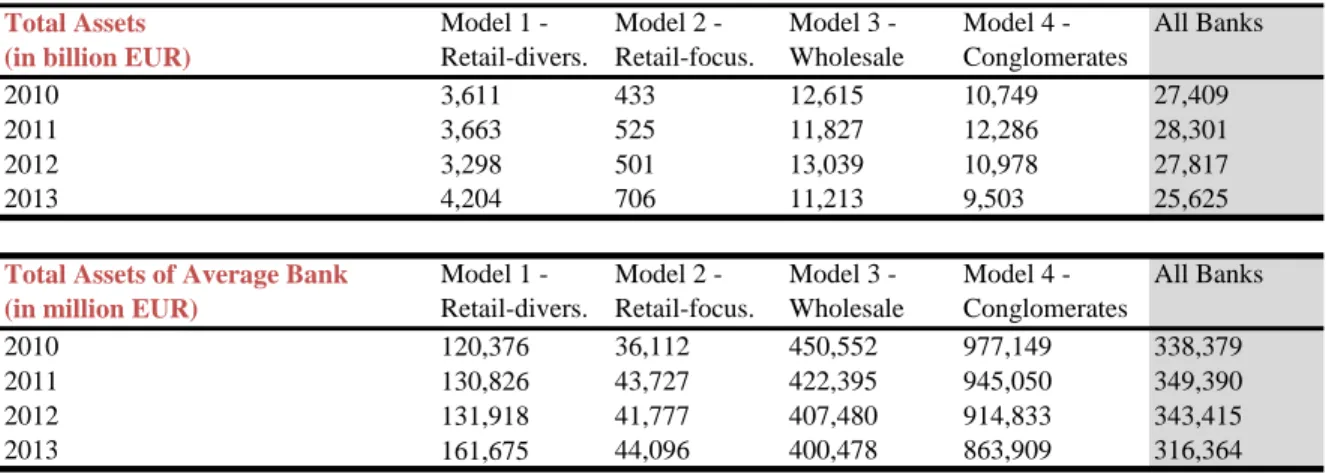
Table 3. Evolution of the Size by Business Model
Adding or dropping instruments to the configuration above leads to a worsening of the
statistical clustering results. This does only make sense as the debt liabilities of the models
1, 3 and 4 are statistically indifferent from each other as underlined by the asterisks in table
2. Likewise, the models 1 and 2 and the models 3 and 4 are statistically indifferent from
each other in bank loans and wholesale funding, respectively. By contrast, all four models
are statistically different in the five instruments leading to the most consistent, distinct and
Business Models Customer
Deposits (% assets) Customer Loans (% assets) Wholesale Funding (% assets) Bank Loans (% assets) Debt Liabilities (% assets) Derivative Exposure (% assets) Trading Assets (% assets) Tangible Common Equity (% assets) Model 1 Mean 44.9% 69.5% 16.5% 5.2% 29.4% 5.2% 21.8% 5.2% 109 obs. Std 0.150*** 0.081*** 0.100*** 0.043** 0.127* 0.039*** 0.077*** 0.021***
Diversied Retail Banks Min 1.2% 54.0% 1.0% 0.8% 3.6% 0.1% 2.9% 0.4%
Max 91.7% 91.8% 44.2% 30.7% 67.0% 18.6% 39.0% 12.8%
Model 2 Mean 68.4% 59.3% 10.9% 7.6% 9.1% 3.3% 27.9% 8.7%
52 obs. Std 0.144*** 0.162*** 0.103*** 0.107** 0.0973*** 0.044*** 0.113*** 0.028***
Focused Retail Banks Min 36.2% 22.7% 0.5% 0.3% 2.4% 0.0% 10.9% 2.6%
Max 87.8% 78.2% 38.7% 42.5% 46.6% 21.0% 58.4% 13.9%
Model 3 Mean 33.8% 51.7% 20.4% 10.2% 32.1% 16.6% 35.1% 4.0%
116 obs. Std 0.115*** 0.092*** 0.104** 0.069*** 0.152* 0.085*** 0.0672*** 0.026***
Wholesale (=Commercial) Banks Min 0.0% 28.7% 3.0% 0.5% 3.9% 1.2% 19.6% -6.4%
Max 55.8% 73.3% 51.9% 37.3% 84.5% 40.2% 51.6% 12.7%
Model 4 Mean 24.4% 30.3% 22.9% 14.7% 29.7% 38.5% 51.8% 2.7%
47 obs. Std 0.071*** 0.066*** 0.120** 0.073*** 0.138* 0.178*** 0.069*** 0.009***
Conglomerates Min 0.0% 0.0% 0.0% 0.0% 0.0% 0.0% 0.0% -0.8%
Max 40.3% 46.4% 50.4% 30.5% 63.3% 78.5% 69.5% 5.1%
All banks Mean 41.7% 55.8% 17.9% 8.7% 27.1% 27.1% 31.9% 5.0%
324 obs. Std 0.187 0.163 0.112 0.078 0.156 0.156 0.127 0.029
Min 0.0% 19.1% 0.5% 0.3% -0.5% -0.5% 2.9% -6.4%
Max 91.7% 91.8% 51.9% 42.5% 84.5% 84.5% 69.5% 13.9%
Total Assets (in billion EUR)
Model 1 - Retail-divers. Model 2 - Retail-focus. Model 3 - Wholesale Model 4 - Conglomerates All Banks 2010 3,611 433 12,615 10,749 27,409 2011 3,663 525 11,827 12,286 28,301 2012 3,298 501 13,039 10,978 27,817 2013 4,204 706 11,213 9,503 25,625
Total Assets of Average Bank (in million EUR)
Model 1 - Retail-divers. Model 2 - Retail-focus. Model 3 - Wholesale Model 4 - Conglomerates All Banks 2010 120,376 36,112 450,552 977,149 338,379 2011 130,826 43,727 422,395 945,050 349,390 2012 131,918 41,777 407,480 914,833 343,415 2013 161,675 44,096 400,478 863,909 316,364
easy to interpret configuration. The similarity of some business models in debt liabilities,
bank loans and wholesale funding underlines why most clustering configurations tested in
the long-list showed two clusters as most appropriate number of clusters. In turn, this
reinforces the hypothesis that business models are still very homogenous and that Basel III
has not yet contributed to more business model diversity after the financial crisis.
Models 1 and 2 share some similarities. Most importantly, both groups comprise
retail-oriented banks with traditional loans to retail- and SME customers representing the largest
proportion of total assets. On the other hand, bank loans and trading assets are below the
sample means. While both models are comparable in bank activities, they differ on funding
sources. Model 1 banks rely more on wholesale- and debt markets. Model 2 banks largely
depend on customer deposits. Although both models tend to be relatively well-capitalized,
the average tangible common equity of model 2 exceeds model 1 by more than one
standard deviation. The reliance on various funding sources in model 1 is most likely an
effort to keep a larger size as opposed to model 2 (see table 3). The average bank size in
model 1 exceeds model 2 by more than the threefold. To differentiate between both
retail-oriented groups, models 1 and 2 will be referred to as diversified retail banks and focused
retail banks, respectively.
In comparison to the retail-oriented banks in models 1 and 2, banks in model 3 are more
diversified on the asset side. Customer loans account for only 51.7% of total assets while
more non-traditional uses of funds, including trading assets and derivative exposures, gain
in significance as opposed to models 1 and 2. On the funding side, traditional customer
debt liabilities together account for more than 50% of all funding sources. Banks in model 3
are worse capitalized than retail-oriented banks. In the minimum, one bank even shows a
negative tangible common equity ratio of -6.4% which indicates a bank’s severe stress
situation during the European Sovereign Debt Crisis. Henceforth, model 3 banks will be
referred to as wholesale (commercial-) banks. According to table 3, wholesale banks are
considerable larger than retail-oriented banks which also underlines their business presence
in corporate banking with larger corporations as target clients.
Model 4 is by far the largest group in terms of average assets (see table 3). In 2013, the
average model 4 bank was more than the double of an average wholesale bank or more than
the fivefold of a diversified retail bank. Banks in model 4 have the most diversified
business models from the whole sample – on both, the activity and funding side – focusing
more on non-traditional- than on traditional businesses. In what follows, model 4 will be
called the cluster of conglomerates. These banks have substantial trading assets and
derivative exposures representing 51.8% and 38.5% of total assets, respectively, which
underlines their significant investment banking business. To the contrary, traditional
customer loans and customer deposits represent only 30.3% and 24.4% of total assets,
respectively. Further, conglomerates are the most active in the wholesale markets – bank
loans and wholesale funding – while debt liabilities are more or less in line with diversified
retail banks and wholesale banks. Conglomerates tend to be the worst capitalized, with an
average tangible common equity ratio of 2.7%.
The total assets of the overall sample shrank between 2010 and 2013. Wholesale banks and
portfolios as represented by the existence of non-core units. To the contrary, the more
traditional retail oriented banks could gain in size suggesting that they are less affected by
deleveraging their businesses.
4.4. Business Model Transition (2010-2013)
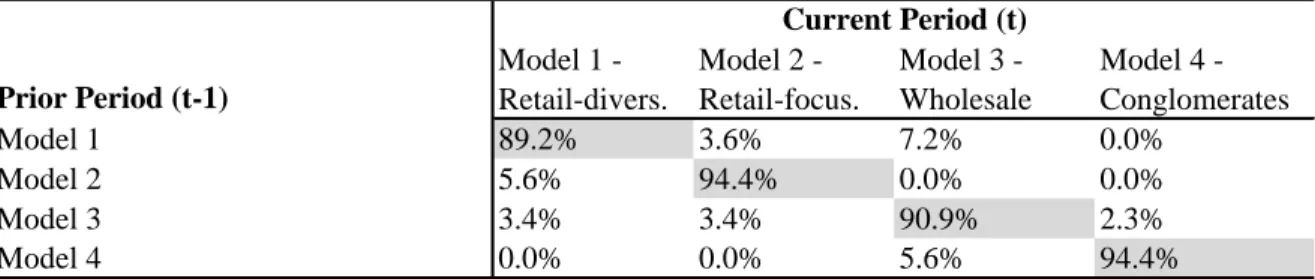
Table 4. Model Transition Matrix, Share of Sample Banks (%)
Table 4 provides the business model transition matrix as short version of Appendix 7.
While the composition of focused retail banks and conglomerates – the most contrasting
business models – are the steadiest, the transition probabilities are relatively higher for the
two intermediate business models, namely diversified retail banks and wholesale banks.
Nearly all of the focused retail banks, namely 94.4%, remain within the same model
throughout the sample years. National banking crises28 in the EU-27 are responsible for the 3.6% of diversified retail banks and the 3.4% of wholesale banks that changed their
business models to focused retail banks. The Greek Alpha Bank and Piraeus Bank, the
Allied Irish Banks, the Bank of Cyprus and the Slovenian Nova Kreditna Banka Maribor
and Nova Ljubljanska Banka; all of these banks substantially changed their business model
to more traditional and risk-averse focused retail banking. In accordance with table 3, the
28
National banking crises are deeply rooted in the European Sovereign Debt Crisis.
Prior Period (t-1) Model 1 - Retail-divers. Model 2 - Retail-focus. Model 3 - Wholesale Model 4 - Conglomerates Model 1 89.2% 3.6% 7.2% 0.0% Model 2 5.6% 94.4% 0.0% 0.0% Model 3 3.4% 3.4% 90.9% 2.3% Model 4 0.0% 0.0% 5.6% 94.4% Current Period (t)
Note: The figures indicate the portion of banks that start under a given business model in the prior period and move to another model in the current period.
growing number of focused retail banks between 2010 and 2013 is one of the drivers of the
increase in total assets of this cluster. While the composition of focused retail banks
included 12 sample banks per year from 2010 to 2012, it was 16 sample banks in 2013.
Likewise, nearly all of the conglomerates, namely 94.4%, remain within the same model.
The 5.6% share of conglomerates that change to wholesale banks is represented by the
Swedish Nordea Bank and the German Landesbank Baden-Württemberg.
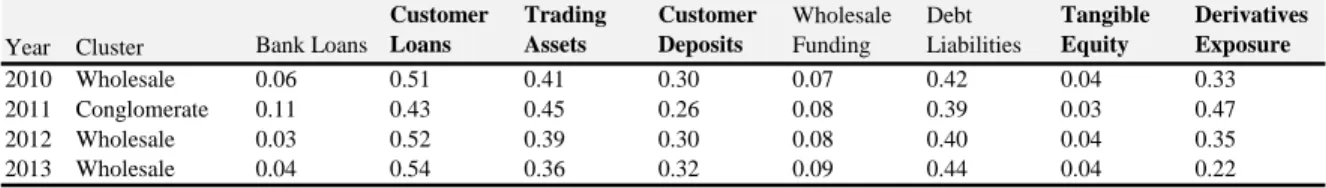
Table 5. Nordea Bank Cluster Analysis
Nordea bank is a good example for a corner case where minor year-on-year alterations in
the instrument proportions, mainly due to an increase in trading assets and derivatives
exposure in 2011, can change the business model from a wholesale bank to a conglomerate
or vice versa (see table 5). To the contrary, Landesbank Baden-Württemberg downsized
and deleveraged its business portfolio under the pressure of the European Commission after
severe financial difficulty during the financial crisis. On the other hand, the 2.3% share of
wholesale banks that changed to conglomerates is represented by the German Hypo Real
Estate. This is surprising as the bank was bailed-out by the German government in 2008
and has obviously not moved towards more traditional banking services ever since.
The 7.2% share of diversified retail banks that change to wholesale banks, which is the
most active transition, is mainly represented by the four banks Eurobank Ergasias (Greek),
BancaCarige (Italian), La Caixa and Banco Popolare (both Spanish).
Year Cluster Bank Loans
Customer Loans Trading Assets Customer Deposits Wholesale Funding Debt Liabilities Tangible Equity Derivatives Exposure 2010 Wholesale 0.06 0.51 0.41 0.30 0.07 0.42 0.04 0.33 2011 Conglomerate 0.11 0.43 0.45 0.26 0.08 0.39 0.03 0.47 2012 Wholesale 0.03 0.52 0.39 0.30 0.08 0.40 0.04 0.35 2013 Wholesale 0.04 0.54 0.36 0.32 0.09 0.44 0.04 0.22
Table 6. Comparison Between New Wholesale Banks and Previously Diversified Retail Banks
Table 6 compares the four banks previous status as diversified retail banks with their new
status as wholesale banks. It underlines that the decrease in tangible equity, customer
deposits and debt liabilities was compensated by a sharp increase in wholesale funding. As
the interbank market was quite illiquid during the past years, it is likely that these four
banks made use of short-term monetary refinancing operations with the ECB. In short, the
change from retail- to wholesale banks resulted from the European Sovereign Debt Crisis.
A last important note addresses the 20 largest European banks by total assets. From all of
them, only Lloyds (British) changed from a wholesale bank to a diversified retail bank as a
reaction to its ongoing financial difficulty in the aftermath of the financial crisis. All other
large European banks, apart from the corner case Nordea Bank, remain within its initial
cluster no matter if they were bailed-out by the government as e.g. the Royal Bank of
Scotland, or if they overcame the financial crisis without direct government intervention as
e.g. Deutsche Bank.
To summarize all these observations, there is no visible evidence that Basel III caused
banks to change their business models. Based upon the analysis of Basel III’s impact on
business segments in chapter three of this paper, we would expect more banks to change
from conglomerates to wholesale banks or from wholesale banks to diversified retail banks,
which is clearly not the case. In line with section 1.3, the post-crisis evolution of banks
Cluster Bank Loans
Customer Loans Trading Assets Customer Deposits Wholesale Funding Debt Liabilities Tangible Equity Derivatives Exposure Retail-diversified 0.07 0.62 0.27 0.40 0.23 0.26 0.05 0.06 Wholesale 0.08 0.59 0.29 0.37 0.33 0.20 0.02 0.08
Note: This table is based upon figures from the four banks EFG Eurobank Ergasias, Banca Carige, La Caixa and Banco Populare which changed from diversified retail banks to wholesale banks. The table compares the average instrument's proportion of the four banks' new status as a wholesale bank with its previous status as a diversified retail bank, irrespecitve of the year.
business model seems to be influenced still by the ongoing European Sovereign Debt
Crisis, rather than by Basel III. This is clearly underlined by the fact that only banks that
were severely hit by the financial crisis or are located in countries hit by the subsequent
European Sovereign Debt Crisis are changing clusters. Accordingly, we are still in the stage
of an immediate response to the crisis, while the achievement of a new medium-term steady
state as a response to Basel III will take more years to come. However, three crucial
remarks need to be considered at this point: at first, the analysis above does not consider
banks customer-, product- or geographical mix where considerable business model changes
might have taken place. Secondly, Basel III is still in very early shoes with long transition-
and observation periods. At last, although banks have not changed clusters, they might have
(partly) adjusted their business models as response to Basel III already. Regarding this last
point, business model adjustments shall be analyzed in the following on grounds of specific
regulatory elements of Basel III such as banks’ capitalization, risk profile, liquidity- and
funding position.
4.5. Banks Capitalization under the Influence of Basel III
Table 7. Capitalization of Sample Banks by Business Model
As the new capital ratios under Basel III were only disclosed in 2013 for the first time, the
Capital Adequacy Ratio (CAR) and tier 1 ratio under the “old” Basel II capital requirements were used to have a level playing field for all sample banks over the four
Capitalitalization acc. to Basel II Model 1 - Retail-divers. Model 2 - Retail-focus. Model 3 - Wholesale Model 4 - Conglomerates All Banks Capital Adequacy Ratio (%) 13.6%*** 15.2%* 14.9%* 14%* 14.4% Tier 1 Ratio (%) 11.4%*** 12.8%* 12.1%* 11.9%* 12.0%