Universidade de Lisboa
Faculdade de Ciências
Departamento de Biologia Animal
Developing visual
discrimination tasks for dogs
Joana Maria Guilherme Martins Fernandes
Mestrado em Biologia Evolutiva e do Desenvolvimento
2012
Universidade de Lisboa
Faculdade de Ciências
Departamento de Biologia Animal
Developing visual
discrimination tasks for dogs
Joana Maria Guilherme Martins Fernandes
Dissertação orientada por:
Professor Michael Mendl
Doutor Luís Vicente
Mestrado em Biologia Evolutiva e do Desenvolvimento
2012
V
Acknowledgments
The dissertation would not have been possible without the ones who somehow helped me and supported me during the last year, and so, in the accomplishment of this project.
First of all, I would like to express my sincere thanks to Mike Mendl, who accepted me in his research group, Animal Welfare and Behaviour group of Veterinary School of University of Bristol, United Kingdom, and agreed be my supervisor. I would not have made this project without his willingness, guidance and financial support, which without it would not have finished the project. I also could have not forgotten his skills and availability to build the complex experimental set-up.
To Luís Vicente, my internal supervisor, who the distance did not make impossible support me and contribute to the development of the project and dissertation, I would like to express my gratitude.
I am very thankful to Rachel Casey, Emily Blackwell, and Liz Paul for their crucial scientific knowledge and opinion, which were very important to the achievement of my entire project. My appreciation also extends to my colleagues: to Beth for helping me on dogs’ handling and training; to Justin for provide me with all the necessary materials and facilities; to Lauren, Alastair, Ellie, Xinming, Pernille, Audrey and Maria to help me with the experiments; and to Sarah for supporting me with her statistics knowledge. Also, to the dogs’ owners, and their pets, who participated in the experiments, for their availability, and kindness, I am deeply grateful.
For the great environment, I would like to thank everyone at the group for the good spirit and friendliness, which made all work even pleasant, especially to my office colleagues, Lauren, Alastair and Lizzie.
I am thankful for the financial support from the European Commission and PROALV (Programa de Aprendizagem ao Longo da Vida), who supported me in the first phase. Lastly, but not less important, I would like to acknowledge my family and friends for supporting and encouraging me all the way along. Without them would not be possible spent one year away, particularly the friends that I made in Bristol, who made me feel at home.
VI
Abstract
The study of animal emotion has risen in the past decades, and because non-human animals cannot talk about their feelings, different techniques have been developed with the aim to understand emotions and improve animal welfare. Here, I intended to assess animal emotions by two different approaches, cognitive bias and lateralization of the brain. Cognitive bias studies have shown that individuals in a more negative affective state tend to interpret ambiguous cues more negatively rather than those in a positive affective state. Brain lateralization studies have shown the left hemisphere is responsible for the processing and control of positive emotions and the right hemisphere for negative emotions.
In this project, I intended to develop a visual discrimination tasks for dogs. Firstly, a cognitive bias test, in which subjects were trained to response to human facial expressions (‘happy’ face vs. ‘angry’ face), and their reaction to ambiguous faces would be analysed. It was predicted that an individual in a putatively more negative state would interpret ambiguous faces more negatively. Finally, a brain lateralization test, in which ‘aggressive’ and ‘neutral’ dog facial expressions, and puzzle pictures of these two (control), were shown at the same time at both sides, left and right, to see whether dogs would present head-orientating bias, depending on the valence of the picture shown. A head-orientating bias to the left was expected when ‘aggressive’ stimuli were shown, and to the right when ‘neutral’ stimuli were shown.
In the cognitive bias test, the subjects did not past the training phase, which might be related with practical issues. In the brain lateralization test, the stimuli presented did not have a significant effect on the frequency of head movements to the left or right, or on the latency to look and time spent looking at either side. Possible future investigations are discussed.
VII
Resumo
As emoções surgiram num processo evolutivo para responder a necessidades naturais, como a sobrevivência e a reprodução, permitindo avaliar e tomar decisões, como por exemplo avaliar situações de perigo e de procura de alimento, sendo compostas por diferentes elementos: comportamento, fisiologia, cognição e consciência. O estudo das emoções animais tem vindo a crescer nas últimas décadas, e, pelo facto dos animais não-humanos não poderem falar dos seus sentimentos, diferentes técnicas têm vindo a ser desenvolvidas, com o objetivo de compreender as emoções e, consequentemente, melhorar o bem-estar animal.
Neste projeto pretendeu-se aceder às emoções animais pelo desenvolvimento de métodos que envolveram estímulos visuais, particularmente expressões faciais, pois estas, juntamente com posturas corporais, são importantes na comunicação canina. Pensa-se que, de forma semelhante, também as expressões faciais do humano são relevantes para a comunicação interespecífica, devido a um processo co-evolutivo entre o homem e o cão, resultante da Domesticação. Deste modo, através de duas abordagens distintas, cognitive bias e lateralização do cérebro, pretendeu-se observar se e/ou como os cães discriminam estados emocionais de humanos e dos seus conspecíficos, utilizando expressões faciais como estímulo.
Por semelhança com estudos em humanos, também estudos de cognitive bias em animais não humanos, como cães, ratos e galinhas, têm vindo a demonstrar que indivíduos em estados afetivos supostamente mais negativos, como, por exemplo, ansiedade, têm tendência a interpretar estímulos ambíguos mais negativamente, do que indivíduos em estados afetivos mais positivos, que, por sua vez, têm tendência a interpretar estímulos ambíguos mais positivamente. Por outro lado, relativamente ao estudo das emoções, observações de lateralização do cérebro demonstraram que a especialização diferenciada do processamento das emoções nos dois hemisférios, esquerdo e direito, permitem a ação simultânea de comportamentos. São exemplos a procura de alimento, controlado pelo hemisfério esquerdo, e a vigília de um possível ataque de um predador, controlado pelo hemisfério direito. O hemisfério esquerdo é, assim, responsável, entre outros aspetos, pelo processamento e controlo de emoções positivas, e o hemisfério direito pelo controlo e processamento de emoções negativas. No primeiro estudo, pretendeu-se desenvolver um teste de cognitive bias, no qual os sujeitos foram treinados a tocar num símbolo aquando da apresentação de uma fotografia de uma expressão facial humana “zangada”, e a tocar num símbolo diferente
VIII aquando da apresentação de uma fotografia de uma cara “sorridente”, de forma a observar, numa posterior fase de teste, de que modo os cães reagem a expressões faciais ambíguas, ou seja, que símbolo iriam tocar quando fossem apresentadas fotografias contendo elementos das duas expressões faciais. Se os cães apresentassem respostas de foro afetivo perante as diferentes imagens apresentadas, por exemplo, a associação de caras “zangadas” com eventos negativos, uma tendência para classificar imagens ambíguas como se fossem negativas (ex.: expressões faciais “zangadas”), sugeriria que os sujeitos teriam um cognitive bias negativo ou “pessimista”, o que poderia ser consequência de um estado afetivo negativo.
Deste modo, o design experimental consistia num pequeno corredor finalizado num quadro (0,80 metros da posição do sujeito), onde estavam colocados dois símbolos distintos lado a lado (um triângulo preto e um círculo branco distanciados por 0,20 metros). As fotografias das expressões faciais encontravam-se por detrás deste quadro, e eram alternadamente puxadas por uma corda, sendo este o início de cada trial. Se o cão tocasse no símbolo correspondente à fotografia apresentada, era dada uma recompensa. Posteriormente, iria ser realizado o teste, em que se analisaria a correspondência entre o símbolo e as expressões faciais ambíguas que cada individuo iria apresentar. No estudo participaram 4 indivíduos de diversas raças e idades e cada sessão consistiu em 30 trials.
O segundo estudo, um teste de lateralização do cérebro, também envolveu estímulos visuais: fotografias de expressões faciais, “agressiva” e “neutra”, de diversas raças de cães, e as respetivas fotografias-puzzle (imagens cortadas aos pedaços e rearranjadas de forma aleatória), usadas, entre outras razões, para prevenir a habituação à apresentação das expressões faciais. Cada fotografia foi apresentada ao mesmo tempo dos dois lados, esquerdo e direito, com a mesma distância relativamente à posição do sujeito, de modo a observar se os cães exibiriam diferentes movimentos da cabeça, dependendo da valência das fotografias apresentadas. Tendo em conta que o input visual recebido pelos olhos é enviado para o hemisfério contralateral do cérebro, era esperado que, aquando da apresentação das expressões faciais “agressivas”, os sujeitos movimentassem a cabeça para o lado esquerdo, processado e controlado pelo hemisfério direito, e, ao contrário, aquando da apresentação das expressões faciais “neutras”, os indivíduos virassem a cabeça para o lado direito, processado e controlado pelo hemisfério esquerdo.
IX O design experimental consistiu num corredor escuro (2 metros de comprimento), onde o sujeito ocupava uma posição central, e, em cada topo, encontravam-se telas brancas onde foram colocadas as fotografias das expressões faciais. O início do trial consistia na apresentação das fotografias quando as luzes situadas por detrás de cada tela eram ligadas. Neste estudo participaram 18 indivíduos de diversas raças e idades, e foi constituído por 4 sessões de 6 trials.
No teste de cognitive bias, os sujeitos não passaram da fase de treino, ou seja, não atingiram o critério estabelecido - 80% de respostas corretas por sessão (24 trials), o que poderá estar relacionado com problemas a nível prático. Além disso, 3 dos sujeitos apresentaram valores significativos de side bias para um dos símbolos, o que pode ser explicado pelo facto de que os cães tendem a repetir comportamentos que foram previamente aprendidos e bem sucedidos. Neste caso, é provável que os sujeitos tocassem, de forma consistente, no símbolo ao qual a primeira associação entre o comportamento “tocar” e a oferta de uma recompensa foi feita. Possíveis alternativas de investigação futura são discutidas, como, por exemplo, o desenvolvimento de um método em que não seja necessário um tipo de treino tão complexo como o aqui apresentado.
Relativamente ao teste de lateralização do cérebro, numa abordagem geral, os diferentes estímulos apresentados não tiveram qualquer efeito significativo no movimento da cabeça para esquerda ou direita, na latência de reação aos estímulos e no tempo passado a olhar para os dois lados. No entanto, fêmeas grandes e machos pequenos apresentaram latências significativamente mais curtas para virar a cabeça para a direita e, também, mais tempo passado a olhar para o lado direito, relativamente a fêmeas pequenas e machos grandes. Isto pode ser explicado pelo facto de que o primeiro grupo referido apresente um hemisfério esquerdo dominante, e consequentemente, ser um grupo de indivíduos mais calmos, não evitando, por isso, os estímulos apresentados (viraram a cabeça e passaram mais tempo a olhar para estes). Contrariamente, é possível que o segundo grupo referido apresentasse um hemisfério direito dominante, tendo tendência para comportamentos de medo e agressividade e, consequentemente, evitar os estímulos apresentados. Presumivelmente, machos grandes tendem a ser mais agressivos, devido à vantagem de tamanho e predominância da hormona sexual testosterona e, por outro lado, fêmeas pequenas tendem a expressar comportamentos que envolvem medo, devido à desvantagem de tamanho e à produção de testosterona em pequenas quantidades. Pelo facto de os resultados não serem os esperados, também, neste caso, alternativas para este método são propostas para investigações futuras, como a utilização de
X estímulos visuais em forma de silhuetas de expressões faciais e/ou corporais, que potencialmente serão mais recetíveis no campo visual lateral.
Para finalizar, é possível que indivíduos em estados afetivos mais negativos processem estímulos ambíguos no hemisfério direito e que, pelo contrário, indivíduos em estados afetivos mais positivos processem estímulos ambíguos no hemisfério esquerdo. Neste contexto, seria interessante desenvolver um método de cognitive bias, com base num tipo de teste de lateralização do cérebro como o apresentado neste projeto e, assim, aceder a estados afetivos em animais não-humanos, sem necessidade de haver um período de treino sendo, consequentemente, uma análise mais rápida e eficiente.
Palavras-chave: emoções, estímulos visuais, cognitive bias, lateralização do cérebro,
XI
Table of contents
Acknowledgments V Abstract VI Resumo VII Table of contents XI 1. Introduction ... 1 1.1. Animal emotions ... 1 1.2. Cognitive bias ... 21.2.1. To measure animal emotions ... 2
1.2.2. To treat abnormal behaviours ... 3
1.2.3. Study 1: cognitive bias test with visual stimuli ... 3
1.2.3.1. Co-evolution of human-dog... 4
1.2.3.2. Dog visual cognition... 4
1.2.3.3. Facial expressions in dog-human communication ... 5
1.2.3.4. Objectives ... 5
1.2.3.5. Prospects for the future ... 6
1.3. Brain lateralization ... 6
1.3.1. On the processing of emotions ... 6
1.3.2. On animal welfare ... 7
1.3.3. Study 2: brain lateralization test with visual stimuli ... 7
1.3.3.1. Hemispheric specialization of emotions in dogs ... 7
1.3.3.2. Objectives ... 8
1.3.3.3. Prospects for the future ... 9
2. Materials and methods ... 10
2.1. Study 1: cognitive bias test with visual stimuli ... 10
2.1.1. Subjects ... 10
2.1.2. Apparatus and stimuli ... 10
2.1.3. Procedure ... 12
2.1.4. Data analysis ... 14
2.2. Study 2: brain lateralization test with visual stimuli ... 14
2.2.1. Subjects ... 14
XII
2.2.3. Procedure ... 17
2.2.4. Data analysis ... 20
3. Results ... 22
3.1. Study 1: cognitive bias test with visual stimuli ... 22
3.2. Study 2: brain lateralization test with visual stimuli ... 26
3.2.1. Latencies to turn to left and right ... 26
3.2.2. Time spent looking to the left and right ... 26
3.2.3. Non-parametric tests for latency and time ... 28
3.2.4. Effects of sex and body size on latency and time ... 29
3.2.5. First head movement ... 31
4. Discussion ... 35
4.1. Study 1: cognitive bias test with visual stimuli ... 35
4.2. Study 2: brain lateralization test with visual stimuli ... 36
4.3. General discussion ... 40 5. References ... 41 6. Appendices ... 46 6.1. Appendix I ... 46 6.2. Appendix II ... 47 6.3. Appendix III... 48
1
1. Introduction
1.1. Animal emotions
Concern about animal health, how we treat animals that we use on farms, in zoos, in labs and as companions, and how they feel is a preoccupation in general society (Keeling et al., 2011). Therefore, animal welfare science has been studied for some decades. There are at least three areas that have received significant attention: 1) an animal’s affective state (feeling and emotions), 2) its biological function (behaviour, physiology, health and reproduction), and 3) its ability to lead a life which is relatively ‘natural’ using its evolved adaptations (Fraser et al., 1997).
It is believed that emotions or affective states evolved as response to natural needs, influencing and enhancing individual fitness (e.g. survival and reproductive success). Hence, emotions allow the animal to evaluate and make decisions, for example improving the ability to avoid threat/harm/punishment and search for valuable resources/reward (Panksepp, 1994; Rolls, 1999; Cardinal et al., 2002). Although some scientists do not agree using the term of emotion related to animals, arguing that is an anthropomorphism, others believe that animals can experience more complicated emotions such as joy and grief (Darwin, 1871; Bekoff, 2007).
Emotions are comprised of different elements: behaviour, physiology, cognition, and a subjective, conscious component (Lang, 1993; Clore and Ortony, 2000). Therefore, alongside neuroscience, psychology, pharmacology, evolutionary zoology, and pain research, animal welfare science has also been assessing emotions, trying to identify what components and methods can be used (Paul et al., 2005; Mendl et al., 2009). The conscious component of emotional states cannot be measured directly in animals which, unlike humans, cannot talk about their feelings. Instead, indirect behavioural and physiological measures need to be used. Some physiological measures have been evaluated as indicators of animal affect. However, there are some problems, such as different affective situations leading to the same physiological responses. For example, fear-inducing circumstances, such as predation, or positive situations, such as sexual activity, both can be associated with an increase in stress hormones or heart rate (Broom and Johnson, 1993). Also, behavioural measures can be used, but, like physiological measures, they are not always straightforward. For example, cessation of swimming behaviour in forced swim test can be interpreted as depression or despair-like situation, or can be interpreted as indicating a positively situation such as
2 succeeding in adapting to the stressful situation (Cryan and Mombereau, 2004). Other limitations of behaviour and physical measures to study emotions include the possibility that many of them might be indicators of emotional arousal rather than valence (refers to the positivity or negativity of an affective state) (Paul et al., 2005).
1.2. Cognitive bias
As an alternative approach to understanding animal emotions, it is thought that the links between affective state and cognitive processes could be important, as appears to be the case in research on humans (Paul et al., 2005; Mendl et al., 2010a). Here, there is some evidence that cognitive manipulations influence affective states and, on the other hand, affective manipulations impact on cognitive processes, including memory, judgment and attention (Hinde, 1985; Forgas, 2000; Mathews and MacLeod, 2002). For example, some studies demonstrate that depressed or anxious humans show a more pessimistic judgement about anticipated events or ambiguous stimuli (Eysenck et al., 1991; MacLeod & Byrne, 1996; Gotlib & Krasnoperova, 1998).
1.2.1. To measure animal emotions
Likewise, it is believed that measurement of cognitive processes can be used as a tool to assess non-human animal emotions (Paul et al., 2005). Although transfer examples of human studies of judgement bias to other animals is a difficult task, since most of them are based on linguistic responses, some researchers have developed cognitive bias methods to test non-human animals. Burman and colleagues (2008) designed a spatial judgment task to study affective state in rats. Rats were trained to associate a food pot placed at one location in a test arena with a food reward (positive location) and the same food pot placed at a different location with no food (negative location). Once they had learnt the discrimination such that when they ran fast to the food pot on trails when it was placed in the positive location and slow on trials when it was placed at the negative location, their behaviour in response to the food pot being placed in ambiguous locations (between the positive and negative locations) was tested. Rats housed in an enriched environment, possibly in a more positive emotional state, tended to judge ambiguous locations as more positive (i.e. ran to them faster) than rats living in an unenriched environment (Burman et al., 2008; see also Harding et al., 2004 for a similar finding). Similarly, birds (Bateson & S. M. Matheson, 2007; Matheson et al., 2008), bees (Bateson et al., 2011) and chicks (Salmeto et al., 2011) in apparently
3 negative affective states also show a pessimistic response bias to ambiguity. Also, Mendl and colleagues (2010b) show evidences of a correlation of a common disorder in dogs – separation-related anxiety (SRB) – and a pessimistic judgment of ambiguous cues in a spatial discrimination task (analogous to Burman et al., 2008). Here, subjects with higher levels of SRB, also exhibited a more ‘pessimistic’ judgement of ambiguous food locations. Cognitive bias may, therefore, be a good measure of the valence of an emotional state in a diverse range of species (Paul et al., 2005; Mendl et al., 2010a).
1.2.2. To treat abnormal behaviours
In the future, cognitive bias modification might be used to treat some human disorders. For example, a meta-analysis by Hakamata and colleagues (2010) revealed that attention bias modification may be a useful treatment for anxiety. Furthermore, anxious and aggressive people tend to interpret ambiguous facial expressions as being more negative (Dodge, 1993; Crick and Dodge, 1994; Blanchette and Richards, 2010), and recent findings demonstrate a decrease in depressive symptoms and mood and in aggressive behaviour, after training depressed young adults and young offenders, respectively, to interpret ambiguous facial expressions as more positive rather than negative (happy vs. angry) (Penton-Voak et al., 2012; Munafo et al., submitted). These findings indicate a causal relationship between modification of an emotional state and a change in bias of a specific behaviour. Altogether, this raises the possibility of treating animal’s behavioural disorders in a corresponding way, by developing methods to this end, based on those used for humans.
1.2.3. Study 1: cognitive bias test with visual stimuli
In this experiment I intended to develop a cognitive bias test, using dogs as the subject of study. Thereby, the main goal was to assess affective states based on visual tasks, and possibly take a step further in the future treatment of some behavioural disorders, for example, high aggressiveness.
For the understanding of my experiment, below is a brief description about some aspects of dog’s cognition significant in the development of this study.
4
1.2.3.1. Co-evolution of human-dog
Dogs share some socio-cognitive skills with humans, resulting from a process of co-evolution through domestication (Hare et al., 2002; Hare and Tomasello, 2005; Miklósi et al., 2007) for at least 14,000 years (Clutton-Brock, 1995). Some research has revealed certain unequal skills related to an adaptive social communication between dogs and humans. In some circumstances, dogs are better able to communicate with humans than other species phylogenetically more closely related to humans, like chimpanzees (Hare et al., 2001). Dogs also have a superior ability to read some human communication cues than do wolves, their closest relative (Hare et al., 2002). Some examples of these skills is the ability of dogs using visual cues, such as respond to pointing gestures (Miklósi et al. 1998) and gaze direction (Soproni et al., 2001).
1.2.3.2. Dog visual cognition
Due to these evidences, an interest in canine visual perception has been addressed in different ways. For example, some studies demonstrated that dogs can discriminate different objects, dog faces and even human faces based on visual cues alone (Guo et al., 2009; Racca et al., 2010), and also that they have the ability to categorize natural stimuli, as landscapes and dogs (Range et al., 2008). Further, eye-tracking techniques for dogs were developed, such a head-mounted equipment, based on video-record (Williams et al., 2011) and a technique based on infrared’s eye movement’s tracker integrated on a LCD monitor (Somppi et al., 2011). Both allow one to study visual cognition more accurately, as, for example, in the last-named study differences of gaze points correlated with different images: pictures of dogs produced longest gaze, and shortest gazes were performed when pictures of humans, toys and alphabetic characters where shown. Additionally, it is believed dogs have the ability to identify human faces. For example, Adachi and colleagues’ study (2007) suggest that dogs generate a visual image related with an auditory cue, particularly, they generate an internal representation of their owners’ face after hearing their call. Posteriorly, it was shown that they can use the face as a cue to recognize their owner (Marinelli et al., 2009) and, even, discriminate human facial expressions (smiling faces vs. neutral faces) of the same individual (Nagasawa et al. 2011).
5
1.2.3.3. Facial expressions in dog-human communication
In similar way to humans, for whom the facial expressions are very important, allowing people to read each other’s emotions and adjust their behaviour appropriately (Ekman and Friesen,1975), also dogs use visual signals, as facial expressions, to communicate (Abrantes, 1987). Due to the close relationship between humans and dogs, it is likely that dogs use human facial expressions to understand some particular circumstance and adapt their behaviour to this new condition. So, research is necessary to understand whether dogs can actually ‘read’ human facial expressions or whether the finding of Nagasawa and colleagues (2010) is just due to a conditional learning process during the training phase, without any understanding of the ‘meaning’ of the facial expression.
1.2.3.4. Objectives
Therefore, to try to understand if dogs have the capacity to distinguish and perceive diverse valences of human emotional states and how they then react to ambiguous stimuli (expressions that have elements of both anger and happiness, for example), I tried to develop a cognitive bias test, based on using different facial expressions as stimuli. Dogs were trained to make different responses to different images of faces (happy human vs. angry human). They were trained to touch one symbol to get food reward when they saw the happy face, and a different symbol to get food reward when they saw the angry face. If they had learnt this discrimination, they would be presented with ambiguous stimuli (morphed images containing elements of both happy and angry faces). Their responses would let us see whether they categorised these stimuli as being more like the happy or angry face, and, consequently, understand whether the dogs are responding to the emotional expression in the image. This is likely to be the case if they had shown a clear generalisation curve in responding across intermediate images between the ‘full happy’ and ‘full angry’ face (i.e. respond according to the relative weight of happy vs. angry expression in the image).
If the dogs had an affective response to the images (e.g. because they would associate angry faces with negative events), a tendency to categorise ambiguous images as being negative (e.g. angry) would suggest that they have a negative or ‘pessimistic’ cognitive bias which might reflect an underlying negative affective state (Mendl et al., 2009).
6
1.2.3.5. Prospects for the future
The test may thus be helpful in assessing dog welfare, by evaluating affective states, using pictures of human facial expressions as stimuli. Additionally, the test has the potential to be applied as a treatment for dog behavioural disorders, such as aggressiveness and anxiety, by training dogs to interpret ambiguous facial expressions (of humans or dogs) as more positive rather than negative, as in similar human research studies with apparent therapeutic effects (Penton-Voak et al., 2012; Munafo et al., submitted).
1.3. Brain lateralization
The study of lateralization of the brain is another way to access the perception and the process of emotions in animals and it has been addressed in the scientific community in the last few decades. It was found that information is processed and controlled differently by the right and left brain hemispheres, a feature that is common across vertebrates (Rogers and Andrew, 2002) and some invertebrates (e.g. Rogers and Vallortigara, 2008). It is believed that the lateralization of the brain appeared in an evolutionary course to make possible the processing of different information simultaneously, and so, perform two dissimilar tasks, as, for example, search for food and being vigilant against predators (e.g. chickens in Rogers et al., 2004).
1.3.1. On the processing of emotions
Posteriorly, left and right hemispheres have been specialized, among other things, in the expression of various types of emotions and in the control of consequent behaviours: Rogers (2010) suggested that the left hemisphere processes and controls positive emotions, approach and proactive behaviour, and, on other hand, right hemisphere processes and controls negative emotions, withdrawal and reactive behaviour, attending, easily, to novel stimuli. For example, different species use the left hemisphere to look for food, such as pigeons (Güntürkün and Kesh, 1987), and toads (Robins and Rogers, 2004). Conversely, in consequence of the right hemisphere processing, more reactive and stronger responses are made when novel type-stimuli are presented from the left side of horses (Larose et al., 2006), and also when a threat type-stimulus, a snake predator, is seen by toads from the left side (Lippolis et al., 2002), since the visual input received by the left eye is processed in the right hemisphere.
7
1.3.2. On animal welfare
These facts have recently received increased attention by the animal welfare community. Here, it is intended to improve animals’ life, in mainly domesticated species, with better techniques of handling and training. For example, avoiding handling a fearful and very reactive individual by its left side, and instead, using its right side, i.e., its right visual and auditory field (input processed in the left hemisphere), in the approach (Rogers, 2010). In the future, it might be possible develop techniques to treat behavioural problems based on better knowledge of individual differences in this matter, for example, associating behavioural traits with physical individual aspects related with brain laterality, and how those were caused (e.g. as result of stressful life experiences).
1.3.3. Study 2: brain lateralization test with visual stimuli
Brain laterality also has been investigated in dogs. In this experiment I intended to develop a brain lateralization test related with the processing of emotions in dogs. Similar with the previous study, the aim was to assess dog’s perception of emotional stimuli (images of conspecifics), examining any laterality in how dogs react to them, and so, how such images may be processed in the brain.
1.3.3.1. Hemispheric specialization of emotions in dogs
Dogs have been shown to react differently (head orientation) to various types of auditory stimuli produced at the same time from two ends, left and right sides, of a corridor 2.5 meters away from the subject. The subjects moved their heads to the left when threats stimuli were produced, as, for example, a sound of a thunderstorm, therefore processed by the right hemisphere. Contrarily, dogs moved their heads to the right when presented with conspecific vocalizations, thus indicating processing by the left hemisphere (Siniscalchi et al., 2008).
The differential processing of emotions has also been studied using visual stimuli, since in animals with eyes in a lateral position the visual input received by the left eye is mostly processed in the right hemisphere, the contralateral side of the brain, and conversely, the left hemisphere largely processes the visual input from the right eye (Rogers, 2010). Also dogs’ eyes are in a lateral position, and consequently, their visual field varies around 250 degrees, depending on the breed (Miklósi, 2007). In this
8 context, Siniscalchi and colleagues (2010) showed that dogs consistently moved the head to the left side when presented with threatening bristled cat and snake silhouettes on both sides, and, on the contrary, they moved their head to the right as reaction to a dog silhouette with neutral body posture, i.e. putatively aversive stimuli which may have induced intense emotions, received by visual input from both sides, were processed primarily by the right hemisphere of the brain.
In addition, other study, based on dogs’ monocular vision, showed laterality in eyes movement dependently of the human and dog facial expressions presented: dogs performed left gaze bias towards negative facial expressions and right gaze bias towards positive facial expressions; however when human neutral facial expressions were presented, dogs exhibit left gaze bias, but, when neutral dog facial expressions were shown, they did not performed gaze laterality (Racca et al., 2012).
1.3.3.2. Objectives
In this experiment I intended to replicate Siniscalchi and colleagues’ experiment (2010), mentioned above (in 1.3.2.1). However, instead of pictures of silhouettes, the stimuli presented were different pictures of aggressive and neutral facial expressions of various dog’s breeds, with some of them also including body postures. Puzzle pictures of the original ‘aggressive’ and ‘neutral’ stimuli (randomized rearrangement of the pictures cut in pieces) were shown to prevent habituation to the continuous presentation of those stimuli I wanted to test. In addition, the puzzle pictures contained exactly the same visual elements as the test pictures and hence could be used to determine whether any asymmetry in responding was due to these visual elements per se as opposed to the whole ‘Gestalt’ image of the aggressive or neutral dog. The puzzle pictures also represented novel stimuli, and this could illuminate any possible confounding responses, since novel events are known to be processed in the right hemisphere. This type of control was not used by Siniscalchi and colleagues (2010), and so, it is not known if dogs responded to bristled cat and snake silhouettes as being novel stimuli, or if they actually perceived these as a threat.
Therefore, in the present study, it was expected that dogs would turn the head to the left as reaction to the ‘aggressive’ stimuli and puzzle pictures (possible differences between these in terms of latency and time spend looking to the left were analysed), and turn to the right side when ‘neutral’ stimuli was shown.
9
1.3.3.3. Prospects for the future
The understanding of how emotions are processed differently in both, left and right, hemispheres of dog’s brain, will let us improve their welfare and, possibly, treat behavioural problems with a more efficient procedure. For example, handling a very reactive dog by their right side in a situation that induce it fear, as a vet consultation, or, treat a behavioural problem, as negative reactiveness to a specific stimulus, presenting it constantly by its right side, and so, inducing habituation to the stimulus.
10
2. Materials and methods
2.1. Study 1: cognitive bias test with visual stimuli
2.1.1. Subjects
Dogs were recruited from university students and staff from the School of Veterinary Sciences. Four dogs were used in this experiment: a Labrador (Coco, 3 years old), a Staffordshire bull terrier (Roxy, 3 years old), a German pointer (Mabel, 3 years old), and a Doberman cross (Lenny, 4 years old).
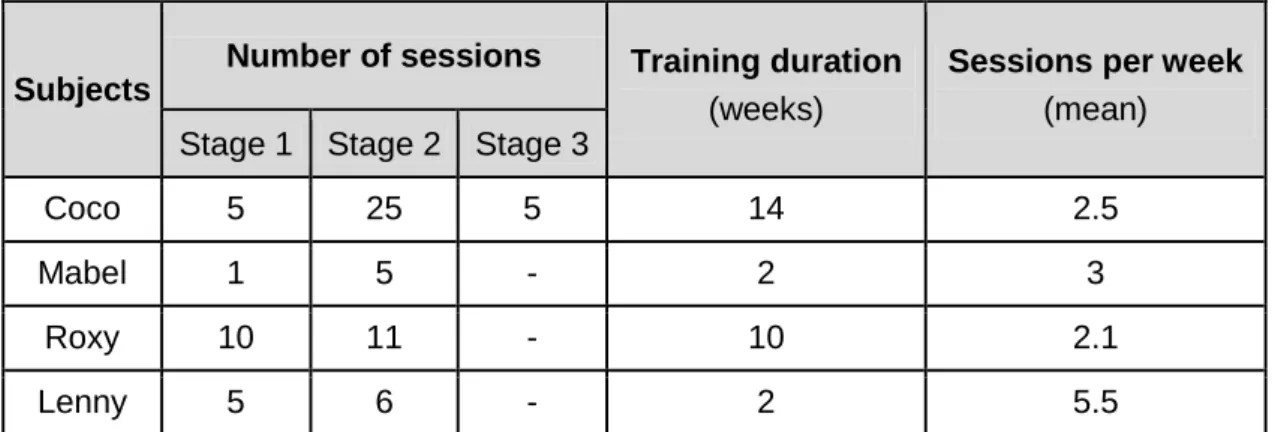
The training was done approximately three times per week, in a period that varied from 2 weeks to 14 weeks (Table 2.1.1).
Table 2.1.1 - Number of sessions spent by each subject in each different stage (1st, 2nd, and 3rd stages), the total number of the weeks it participated in the experiment, and the average number of sessions per week.
Subjects
Number of sessions Training duration
(weeks)
Sessions per week
(mean) Stage 1 Stage 2 Stage 3
Coco 5 25 5 14 2.5
Mabel 1 5 - 2 3
Roxy 10 11 - 10 2.1
Lenny 5 6 - 2 5.5
2.1.2. Apparatus and stimuli
Two different symbols were attached to a back board at the eye level of each dog: a white circle on the right (12cm diameter) and black triangle on the left (12cm (base) x 12cm (high)), with ~0.20 meters of distance. The visual stimuli wereA4 photographs of morphed human facial expressions (mimicking the real size of a human adult face (Figure 2.1.1), computer generated and provide by the School of Experimental Psychology of University of Bristol of United Kingdom, and they were presented at approximately the dog’s eye level, coming and revealed by pulling them up from behind the board by a rope. The sound of the rope pulling up the picture was designed to attract the dogs’ attention. Movement of the pictures was carried out by one of the two experimenters, who was located 1 meter from the board (Figure 2.1.2).
11
Figure 2.1.1 - Pictures of morphed human facial expressions: happy (left), angry (right), and ambiguous (morphed of ‘angry’ and ‘right’ facial expressions: 50% of ‘angry’ face and 50% of ‘neutral’ face) (middle).
Figure 2.1.2 - Experimental design: experimental set-up, and the positions of the experimenters, 1 and 2.
Experimenter 1 was in charge of handling the subjects, and at the start of each trial, she commanded the dog to sit down facing towards, and ~0.80 meters away from, the
12 board. After the presentation of the stimulus, experimenter 2 played a recorded voice saying ‘go’ as cue to move forward to choose and touch one of the symbols, each one corresponding to a different facial expression (e.g., if the happy face was presented, touch the circle, if the angry face touch the triangle). The face-symbol contingency was balanced across dogs. Each trial began after the stimulus was shown and finished when the dog touched the symbol. At every correct trial, experimenter 2 dropped the reward into a tube, the end of which was located at the bottom of the back board where the dog to retrieve the reward.
The experiment was recorded by experimenter 2, who had an appropriate sheet to fill during the sessions.
2.1.3. Procedure
The experiment comprised 4 stages:
1) Stage 1: shape the operant response
After a period of habituation to the experimenters, room and apparatus, the dog was introduced to the basic behaviour to perform in every stages: sit down, touch the symbol after the stimulus and command ‘go’, and, finally, food-rewarded for correct response (indicated by a clicker) and no food-reward for the incorrect response (indicated by a buzzer). Helping signals from the experimenters (pointing) were reduced progressively and the stage was considered finished when the dogs performed without any cues from the experimenters.
The stimuli, ‘happy’ face and ‘angry’ face, were available in all training sessions, and during any one trial, one of the pictures was shown. The sequence of pictures was pseudo-randomised with the proviso that each image could not be shown more than two times in a row.
2) Stage 2: training phase (counterbalanced and not randomized)
The trials were carried out in 6 blocks of 5 pictures of the same face, so 3 blocks of ‘happy’ face and 3 blocks of ‘angry’ face. The blocks were alternated and the block which started each training session was randomized between sessions. The dogs were allowed a short break between blocks.
For each block, if the subject touched the incorrect symbol 3 times in a row, we carried out a forced trial. In the forced trials, only the correct symbol was available and a
13 reward was given if the subject touched it. The forced trials were implemented when the 3rd incorrect response in a row occurred on the 3rd or 4th trial. So, this procedure, was not done if the 3rd wrong response happened in the 5th trial. Each forced trial was followed by a trial with both symbols available, so this means that a 6th trial was necessary if the 3rd wrong response was on the 4th trial of the block.
Stage 2 was considered completed when dogs got 12 out of 15 trials correct for each face type (‘happy’ and ‘angry’) across the 6 blocks of 5 trials. Forced trials were not counted as a correct trial.
3) Stage 3: training phase (counterbalanced and randomized)
Similarly with the stage 1, the stimuli, ‘happy’ face or ‘angry’ face, was shown alternately between each trial or two trials in a row. The sequence was randomized and counterbalanced within the set of the 6 blocks. Each block was composed of 3 trials of one face and 2 trials of the other face, with the same face presented twice in a row at most. The dog was allowed a short break between blocks.
Stage 3 was considered completed when dogs got 12 out of 15 trials correct for each face type (‘happy’ and ‘angry’).
4) Test phase
In this stage we would present ‘happy’ and ‘angry’ face alternated with ambiguous faces (different intermediate morphed faces containing elements of both ‘happy’ and ‘angry’ faces). Ambiguous and wrong trials would not be reward.
Trials would be given in 6 blocks of 5: 2 ‘happy’ faces, 2 ‘angry’ faces and 1 ambiguous face. The sequence of trials would be randomized within each block, with ambiguous face taking the 2nd/3rd/4th position. The ‘happy’ and ‘angry’ faces could be shown twice in a row. We would presented three ambiguous faces, for example, a ‘mid-point’ face (50% of ‘happy’ face elements and 50% of ‘angry’ face elements), a ‘happier’ face (75% of ‘happy’ face elements and 25% of ‘angry’ face elements), and ‘angrier’ face (25% of ‘happy’ face elements and 75% of ‘angry’ face elements). These stimuli would be randomized and counterbalanced between the 6 blocks.
As in the previous stages, the subject would be allowed a break of 30 seconds to 3 minutes between blocks.
14 From the analysis of the recordings we could see whether each ambiguous face was judged as more positive or negative (based on which symbol is selected most), and, so, observe whether any cognitive bias was apparent.
During all the trials of the training period, the experimenters did not talk or interact with the dog more than necessary and they minimized talking with each other. In the presence of external distractions, the trial would not start until these ceased.
2.1.4. Data analysis
The correct responses per session and the responses per symbol/side were analysed by binomial tests, to obtain the chance level by the p-values from the two-tail test.
2.2. Study 2: brain lateralization test with visual stimuli
2.2.1. Subjects
The participants were twenty dogs recruited from university staff from the School of Veterinary Sciences of the University of Bristol. Eighteen of them completed the study, and two were excluded due to lack of collaboration to execute the task.
The subjects are representative of various breeds. Large breeds: 2 Golden Retriever, 1 Irish Setter, 2 Lurcher, 2 Labrador, 1 Flat-coated Retriever, 1 Hugarian Vizsla, 1 German pointer, 1 Labrador crossed with Border Collie, and 1 Doberman cross with Rottweiler. Small breeds: 2 Cocker Spaniel, 1 Staffordshire Bull Terrier, 1 Parsons Terrier, 1 Springer Spaniel, and 1 Jack Russell Terrier crossed with Springer Spaniel. They were between 1 and 12 years old, with an average of 5.11±3.05 years old (mean±SE), and, in total, they were 10 males and 8 females (Table 2.2.1).
Table 2.2.1 - Number of large and small males and large and small females that participated in the study. Sex Male Female Body size Large 7 5 Small 3 3
15
2.2.2. Apparatus and stimuli
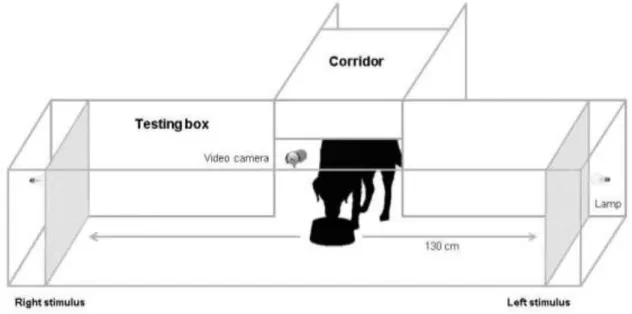
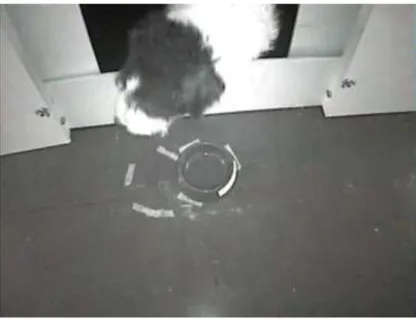
The experimental setup was comprised of one testing box (300 cm x 60 cm x 80 cm) where the test was done, joined mid-way with a corridor (100 cm x 60 cm x 80 cm) where the subject was placed. At the junction point, the subject had access to a bowl in the corridor from where a small amount of food was given (figure 2.2.1).
At each trial, stimuli (A3 printed pictures) were placed on 2 Perspex screens (20 cm from the bottom) at both ends of the corridor (130 cm from the bowl). The corridor environment was dark and each trial started when the lamps, placed behind the screens, were turned on at the same time for approximately 5 seconds, allowing the dog to see the images.
The dog’s behaviour was video recorded by an infra-red camera located on the top of the box, opposite to the bowl location. The camera was connected to a computer and a screen, and so the experimenter was able to monitor the dog’s behaviour during the experiment, and also to record from the videos at a later time.
Figure 2.2.1 - Experimental design.
The picture stimuli comprised:
6 pictures of ‘neutral’ dog (N)
6 pictures of ‘aggressive’ dog (A)
6 picture puzzles of ’neutral’ dog (Np)
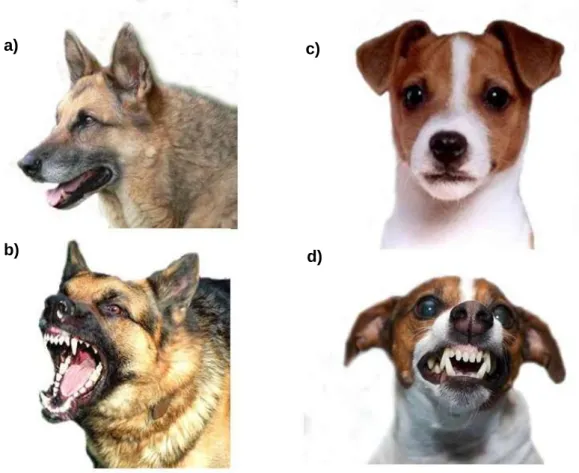
16 The pictures were collected from the internet and represented 6 different dogs of diverse breeds (large breeds: Dalmatian, German Shepherd, Rottweiler, and Golden Retriever; small breeds: Jack Russell Terrier, and Miniature Schnauzer), with the aim to observe if dogs respond similarly to a variety of pictures of the same type (aggressive or neutral) (see examples in Figure 2.2.2), which includes different physiognomies, as body size, fur colours, etc., and also to minimize the chance of habituation to the ‘neutral’ and aggressive’ dog pictures, if only one being shown repeatedly. Puzzle pictures (original stimuli cut in pieces and randomly rearranged) (see examples in Figure 2.2.3) were also used as control (see explanation in 1.3.3.2). On each trial, the images placed at each end of the corridor were the same, i.e., the symmetric pair, and the question investigated was whether the type of image shown affected whether the dog turned more often, or more quickly, to the left or right.
Figure 2.2.2 - Examples of pictures of the dog’ breeds presented: ‘neutral’ (a) and ‘aggressive’ (b) German Shepherd and ‘neutral’ (c) and ‘aggressive’ (d) Jack Russell Terrier.
a)
b)
c)
17
Figure 2.2.3 - Examples of pictures of the dog’ breeds presented: ’neutral puzzle’ (a) and
‘aggressive (b) puzzle’ German Shepherd and ‘neutral puzzle’ (c) and ‘aggressive puzzle’ (d) Jack Russell Terrier.
2.2.3. Procedure
The experiment comprised 4 stages: 1) Habituation phase
The subject was given a habituation period to the general experimental environment, i.e., time was given to interaction with the experiment (e.g. playing and offering treats), to explore the room and the box, at the same time that the room’s darkness was experienced, until the dog seemed available to be trained to remain in its test position and eat from the bowl, and then start the test.
c) a)
d) b)
18 2) Test phase
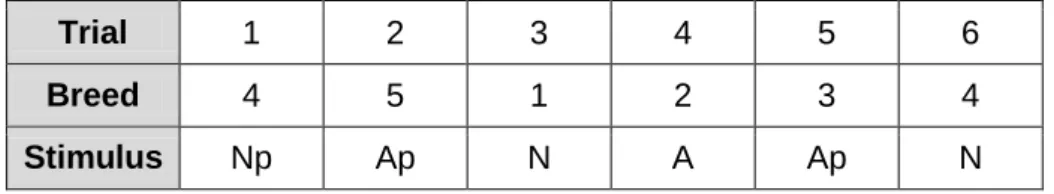
This comprised 4 sessions of 6 trials. Each session of 6 trials included a randomized and balanced sequence (across all sessions) of the different types of stimuli, with each stimulus representing one of the 6 dog breeds mentioned above, such that all 6 breeds were shown during any one session. For example, as shown in Table 2.2.2, the order of the breed could be 4 to 1, and the correspondent stimuli order could be Np, Ap, N, A, Ap and N.
Table 2.2.2 - Example of sequence of stimuli in a session, comprising 6 trials in a randomize order of the type of stimuli ('neutral' (N), 'aggressive' (A), 'neutral puzzle' (Np) and 'aggressive puzzle' (Ap)), representing all breeds.
Trial 1 2 3 4 5 6
Breed 4 5 1 2 3 4
Stimulus Np Ap N A Ap N
Ideally, 2 sessions per week were carried out over 2 consecutive weeks, but for several reasons, there were some exceptions to this rule, for example, a longer interval than one week between the first two sessions and the two last sessions. Per session, the trials were alternated with breaks of 5 minutes, when the subject was given freedom to play or rest. Throughout the trials, the experimenter did not talk to/interact with the dog, apart from some exceptional cases, for example, encouraging them to walk towards to the bowl, when they needed some orientation.
At the start of each trial, a small amount of food was placed on the bowl. The stimuli were the presented (lamps turned on) when the subject was eating the food or shortly after it finished eating the food, and with its head facing straight ahead (i.e. not towards one or other end of the corridor). Each stimulus presentation lasted about 5 seconds, and behaviour during this period was analysed.
3) Behavioural analysis
The behaviour during each 5 second stimulus presentation was analysed frame by frame using Solveig Multimedia software which converted the video images into 10 frames per second bins, yielding a total of 50 frames across each 5 second trial.
19 The behaviours observed per trial (frame by frame) were:
Head movement:
o Centre – both eyes on the bowl’s line (Figure 2.2.4)
o Right – both eyes on the right side of the bowl (Figure 2.2.5) o Left – both eyes on the left side of the bowl (Figure 2.2.6)
Other behaviours:
o Feeding – chewing food or licking the bowl
o Smelling – snout down, beside the bowl/floor; excludes feeding
Figure 2.2.4 - Example of a trial at which the subject look at the centre.
20
Figure 2.2.6 - Example of a trial at which the subject look at the left side.
2.2.4. Data analysis
Behaviour recorded from the videos was entered in Excel 2010, with each line of data corresponding to behaviour recorder during one frame of a trial. Summary statistics were calculated as described below and then analysed using IBM SPSS Statistics 20. I did two different types of analysis related to the number of first head movements to left (‘first lefts’) and right (‘first rights’) sides over the trials for the four stimuli presented. In other words, since at each trial the subject was given time to turn the head to both sides, in the analysis was only taken into account the side to where the first head movement was done, in other words, the immediate response to the stimuli. First, I did Chi-Square Tests, as Pearson Chi-Square, Likelihood Ratio and Fisher’s Exact Test, in which was also included the number of trials spent only in the centre, i.e., those trials where no head movement to left or right sides was done. For the second analysis, I calculated the Laterality Index (LI) for every dog, using the formula LI = (number of ‘first lefts’ – number of ‘first rights’) / (number of ‘first lefts’ + number of ‘first rights’). A score of 1 means exclusive first head movement to left and a score of -1 means exclusive first head movement to right. LI was analysed with repeated-measures ANOVA. Also here, normality of residuals was verified.
The number of frames spent with head facing the centre, left and right sides, and the summation of these behaviours, which is the total number of frames spent in the box during the 5 second trial, were used to calculate the proportion of total frames per trial spent with the head facing both sides and centrally. I also included latencies to turn the
21 head to left and right in the statistical analysis. The number of frames spent in the centre from the start point, until the first frame spent in one of the sides is the latency of the first look. The latency of the second look, if it occurred, is the time elapsed until the first frame with the head facing the other side. In addition I calculated the average of the values presented in 6 trials for the 4 stimuli (‘neutral’, ‘aggressive’, ‘neutral puzzle’, and ‘aggressive puzzle’) per dog, for the time spent in the left and right sides, and latencies to move the head for left and right. These data were analysed with repeated-measures ANOVA, which met the assumption of normality of residuals. For these two categories, latency and proportions of the number of frames, the interaction between the different independent variables (stimuli and direction) with the two independent variables, sex and body size, were analysed also with repeated-measures ANOVA. Normality of residuals was verified.
The effect of the order of the presentation across the 6 trials for each stimuli, the effect of the 6 different breeds in the picture, and the effect of the different pictures between the same breed’ group in the subjects performance were analysed as related samples using non-parametric tests, particularly Friedman test.
Unfortunately, ‘feeding’ and ‘smelling’ behaviour were not suitable for my analysis, so, these were excluded of it. Since these behaviours were simultaneous of the head position (e.g. in the same trial the subject being in the left side and smelling), they could be important to understand if these affected the subjects’ reaction to the stimuli. However, with this type of analysis, it is just possible investigate the number of frames of ‘feeding’ and ‘smelling’, and not their simultaneity with the response to the stimuli.
22
3. Results
3.1. Study 1: cognitive bias test with visual stimuli
This experiment was unsuccessful, since none of the subjects made it past the training phase, i.e., none of the dogs performed correctly in 12 out of 15 trials for each stimulus at stage 2 (80% correct trials). Also, a gradual increase of correct responses during the training sessions was expected, but the subjects showed an irregular performance, as we can see in Figure 3.1.1. It is noted that correct responses in forced trials were not considered for analysis.
Roxy showed a more constant performance, around 50% of her responses were correct, due to a very strong bias for one of the sides/symbols, as I will discuss later. Although Coco had higher percentage values than the other subjects, and often over 50% of her responses were correct, she never met the requirements necessary to proceed to the following stage. This will also be discussed in more detail below.
Figure 3.1.1 - Representation of the percentages of correct responses per session for each subject (Coco (light blue line), Mabel (yellow line), Roxy (red line), and Lenny (green line)), and the criterion indication (purple line).
Coco was trained from the first attempt to design a protocol for the cognitive bias test, in other words, in the absence of a complete and final set-up. At this stage, the following adaptations were absent: lateral boards to make dogs focus on the task, and
0 10 20 30 40 50 60 70 80 90 1 3 5 7 9 11 13 15 17 19 21 23 25 27 29 Co rr ec t res p o n se s (% ) Sessions
Subjects' performance
Coco Mabel Roxy Lenny Criterion23 to prevent the experimenters give body cues; a system to pull the ropes (initially the changes were done directly by hand); a system to reward the dog without the reward being given directly by the experimenter (liable to cues, for example, human visual signs). Thus, Coco was subjected to several changes in the protocol, as well as the inexperience of the experimenters. Nevertheless, we decided carry on with her training sessions due to several reasons; for example, she exhibited good learning ability, good concentration and high motivation to food.
Contrary to the other subjects, further discussed, Coco did not present a systematic side bias throughout the sessions. Instead, she showed random side bias (both directions) on a half of the sessions (Figure 3.1.2, Appendix I and II).
Figure 3.1.2 - Percentage of correct responses per session, performed by Coco, for circle (blue line) (‘happy’ face) and for triangle (yellow line) (‘angry’ face).
Moreover, observing Figure 3.1.2, Appendices I and II, this subject shows a value of performance equal and above 50% of correct responses in almost 2/3 of the 30 sessions. In detail, Coco’s training showed an improvement of performance at 6th session, shifting the number of correct responses from less than 50% to more than 50%, maintaining these values for most of the training period, including 3 sessions with significant good performance (session 15 (70.00%, p=0.0428), session 19 (76.67%, p=0.0052) and session 23 (70.00%, p=0.0428)). However, we observed a decrease of correct responses after the 24th session (mainly under 50%), probably due to a decline of the motivation and concentration caused by the intensive training. Also, she
0 10 20 30 40 50 60 70 80 90 100 1 3 5 7 9 11 13 15 17 19 21 23 25 27 29 C o rrect resp o n ses (% ) Sessions
Coco's performance
Circle Triangle24 exhibited behaviours such as touching the symbols before the stimulus was presented, lying down during the training, or leaving the apparatus area before finishing the block. During the experiment, thus in the absence of the statistical analysis, we perceived Coco was using some kind of strategy; not learning the actual task, but not showing side bias at every session either and, when side bias were present, she tent to alternate them between sessions, unlike the other subjects. For this reason, it was decided proceed to the next stage and randomize the presentation of both stimuli, but making sure that the same stimulus was not presented more than two times in a row. Due to the lack of concentration and motivation shown at this period, accentuated with the modification from stage 2 to 3 at 26th session, we then changed the randomized sequence for maximum of 3 times in a row in the last 2 trials. We observed Coco’s performance in the trials following the above mentioned changes in protocol, in order to see whether these changes lead to an improvement in performance. But no improvement was observed.
Following, it is the analysis of the other subjects’ performance, to whom the results suggest a systematic bias for one of the symbols/sides, and a poor performance (Figure 3.1.3 and appendix III), i.e., more incorrect responses than expected, or 50% of responses corrected (p=1.1445), explained by a strong bias.
For Mabel, the defined associations between stimulus and symbol are happy face with circle, and angry face with triangle. Although, she presented a significant triangle/left bias, Mabel showed a loss of this bias to circle/right in the last 2 sessions, but not with significant p-values (Figure 3.1.3 and appendix III). We did not proceed with her training, due to her lack of concentration and low motivation, which seemed influence her performance. Additionally, she was absent in the following weeks, which also could influence her performance due to a long break.
Roxy presented a very significant circle/right bias (Figure 3.1.3 and appendix III). Although she was very motivated to perform the task, she presented a lack of concentration and, consequently, difficulties of learning the basic behaviour (sit, and go touch the symbol after the stimulus is shown), and, she was also very dependent on the experimenter’s instructions, mainly in the first stage. Altogether, this might explain the very significant bias.
Lenny was subjected to slight changes in the protocol. Instead of using human facial expressions as stimulus, we decided use a picture of a toy and a bowl. Since the difference between the new stimuli is much more evident, this could help us to
25 understand if the fact the protocol was not working due to a complexity of the task (association between one of the stimulus presented and the correspondent symbol as correct answer), or the fact that dogs cannot distinguish facial expressions. If this protocol worked, we could substitute both pictures, for the previous used facial expressions, ‘happy’ face and ‘angry’ face, and carry on with the training (method similar to that used in Nagasawa et al (2010)). However, also Lenny presented a symbol/side bias, in this case, to circle/right side (Figure 3.1.3 and appendix III). Similar with the 2 previous mentioned subjects, during the training, and strongly in the last few sessions, Lenny presented a lack of concentration and low motivation.
Figure 3.1.3 - Percentage of correct responses per session for circle (on the top) and triangle (on the bottom), for each dog: Mabel (blue line), Roxy (yellow line) and Lenny (red line).
0 10 20 30 40 50 60 70 80 90 100 1 2 3 4 5 6 7 8 9 10 11 C o rrect t rials ( % ) Sessions
Responses to triangle
Mabel Roxy Lenny 0 10 20 30 40 50 60 70 80 90 100 1 2 3 4 5 6 7 8 9 10 11 Co rr ec t tr ial s (% ) SessionsResponses to circle
Mabel Roxy Lenny26 Other dogs were introduced to the method, but due to several reasons, such as an occasionally low attendance at the establishment, where the experiment was conducted, or low motivation, we did not proceed with their training. A particular case, Ruby, had to be excluded of the training, because of her dependency on the experimenter’s body cues, and therefore not being able to perform independently.
3.2. Study 2: brain lateralization test with visual stimuli
The subjects showed a percentage of response of 88.22±16.30 (mean±SE) (percentage of trials on which dogs moved the head to either left or right). However due to several reasons, as for example, dogs not looking straight ahead at the start point, 6.25% of the trials were excluded from the analysis.
3.2.1. Latencies to turn to left and right
There was no significant effect of the treatment (4 different types of stimuli) on the latency to turn left (p-values between p=0.456 and p=1.000), or on the latency to turn right (p-values between p=0.538 and p=1.000). Figure 3.2.1 shows that for ‘neutral’ and ‘aggressive’ pictures, dogs exhibited longer latencies to turn the head to left than to the right side, with a larger difference between latencies being evident for aggressive pictures than for neutral ones. However, for the related puzzle pictures, they showed longer latencies to move the head to right, than to the left side, and a larger difference between latencies for the neutral puzzle compared to the aggressive puzzle pictures. However, these data did not reveal significant differences in any of these measures.
3.2.2. Time spent looking to the left and right
There was no significant effect of the treatment (4 different types of stimuli) on the time spent looking to the left side (p-values between p=0.413 and p=1.000) and to the right side (p=1.000). Although, dogs did not show significant differences in this behaviour across the various stimuli, it is again interesting to look at the graphed data (Figure 3.2.2). This shows that in the presence of ‘neutral’ picture the dogs tend to look longer to the left than to the right, whereas the opposite appears to be the case when the ‘aggressive’ pictures are shown. However, once more, these differences are not significant.
27
Figure 3.2.1 - Mean of the latencies (number of frames) to move the head to the left side (blue line) and to move the head to the right side (green line), related to the stimuli 'neutral' (N), 'aggressive' (A), 'neutral puzzle' (Np) and 'aggressive puzzle' (Ap).
Figure 3.2.2 - Mean of the time spent in the left side (proportion of the number of frames spent in the left) (blue line) and time spent in the right side (proportion of the number of frames spent in the right) (green line), related to the stimuli 'neutral' (N), 'aggressive' (A), 'neutral puzzle' (Np) and 'aggressive puzzle' (Ap).
28
3.2.3. Non-parametric tests for latency and time
Friedman’s tests showed that the distributions of latencies and time spent looking to the left and right sides for the 4 stimuli (‘neutral’, ‘aggressive’, ‘neutral puzzle’ and ‘aggressive puzzle’) were the same across the 6 trials over the 4 sessions. This possibly means there was no habituation to the presentation of the same type of stimulus over the sessions, since mean latency and time spent in both sides does not decrease or increase over the time.
Related to the different groups of breeds in the pictures shown across the 4 sessions, where the same breed was presented only once in the same session, mean latency and time spent in both sides was not differently affected by these.
Finally, comparisons between responses to the different type of pictures within each of the 6 breeds were carried out using Friedman’s tests. Mean latency to turn the head to the left when the ‘aggressive German Shepherd’ stimulus was presented was higher than the latencies to turn left when the other type of German Shepherd stimuli (N, Np and Ap) were shown (p=0.029, i.e. rejected the null hypotheses: stimuli being equally distributed) (Figure 3.2.3). No such differences were observed between the different types of image within any of the 5 other breeds.
Figure 3.2.3 - Mean of latency (number of frames) to turn the head to the left side when the group of pictures representing the German Shepherd dog's breed was shown: 'neutral German Shepherd' stimulus (N6) (blue bar); 'aggressive German Shepherd' stimulus (A6) (yellow bar); 'neutral puzzle German Shepherd' stimulus (Np6) (red bar); 'aggressive neutral German Shepherd' stimulus (Ap6) (green bar).
1 6 11 16 21 26 31 36 41 46 51 L aten cy ( mean o f n u mb er o f fr am e s) Type of stimulus
German Shepherd pictures
N6 A6 Np6 Ap6
29
3.2.4. Effects of sex and body size on latency and time
There was a significant interaction effect of sex and body size on the latency to turn the head to right side (p=0.029), but not for the left side (p=0.139). Here, large females and small males showed significantly shorter latencies to look to the right, compared with large males and small females (Figure 3.2.4).
Figure 3.2.4 - Mean of the latencies (number of frames) to move the head to the right side for the stimuli 'neutral' (N), 'aggressive' (A), 'neutral puzzle' (Np) and 'aggressive puzzle' (Ap), related with the body size of the subjects: a) large males (blue line) and large females (green line); and b) small males (blue line) and small females (green line).
a )
b )