Can Vertical Integration Reduce Hospital Readmissions?
A Difference-in-Differences Approach
Sı´lvia Lopes, PhD,* O
´ scar B. Fernandes, MSc,
w
Ana Patrı´cia Marques, BSc,*
Bruno Moita, BSc,
w
Joa˜o Sarmento, MD, MSc,
w
and Rui Santana, PhD*
Background: Vertical integration is expected to improve commu-nication and coordination between inpatient care and care after discharge. Despite being used across health systems worldwide, evidence about its impact on readmissions is sparse and contra-dictory.
Objective: To assess the impact of vertical integration on hospital readmissions.
Research Design, Subjects, and Measures: Using difference-in-differences we compared readmissions before and after vertical integration in 6 Portuguese hospitals for years 2004–2013. A con-trol group with 6 similar hospitals not integrated was utilized. Considered outcome was 30-day unplanned readmission. We used logistic regression at the admission level and accounted for patients’ risk factors using claims data. Analyses for each hospital and se-lected conditions were also run.
Results: Our results suggest that readmissions decreased overall after vertical integration [odds ratio (OR) = 0.900; 95% confidence interval (CI), 0.812–0.997]. Hospital analysis indicated that there was no impact for 2 hospitals (OR = 0.960; 95% CI, 0.848–1.087 and OR = 0.944; 95% CI, 0.857–1.038), and a positive effect in 4 hospitals (greatest effect: OR = 0.811; 95% CI, 0.736–0.894). A positive evolution was observed for a limited number of conditions, with better results for diabetes with complications (OR = 0.689;
95% CI, 0.525–0.904), but no impact regarding congestive heart failure (OR = 1.067; 95% CI, 0.827–1.377).
Conclusions: Merging acute and primary care providers was as-sociated with reduced readmissions, even though improvements were not found for all institutions or condition-specific groups. There are still challenges to be addressed regarding the success of vertical integration in reducing 30-day hospital readmissions. Key Words: integrated care, delivery of health care, readmissions, quality improvement, international health
(Med Care 2017;55: 506–513)
H
ealth systems around the world seek to increase the continuity of care between providers at different lev-els.1–3By merging health care providers of different levels into a single unit,4vertical integration is a means to reduce fragmentation of care and its negative consequences, espe-cially for older patients or those with multiple chronic con-ditions, whose disease trajectories typically require contact with several types of providers.5 A study conducted in 11 countries showed that the population above 65 years old frequently sees >4 different doctors per year, or takes >4 medications; and also that in 10 countries Z20% reported receiving uncoordinated care, with values even higher for some countries.6Avoidable readmissions are one of the negative con-sequences of fragmentation of care, due to poor care tran-sitions between providers.7,8Vertical integration is therefore expected to reduce readmissions, which is advantageous for patients and providers, as readmissions are frequent,9,10 ex-pose patients to avoidable risks,11disrupt their routine,12and are costly.9 Readmissions depend on patients’ risk factors, but are partially avoidable through changes in care delivery and organization.13These changes may include predischarge interventions, postdischarge interventions, or bridging terventions, with better results for more comprehensive in-terventions.14
From 1999 to 2012, 8 vertically integrated units were created by the Portuguese Ministry of Health, which merged hospitals and primary care public providers sharing a com-mon geographical location, aiming to improve efficiency, effectiveness, and population-level outcomes.15–21 In each case the intervention from the Ministry of Health was to merge existing providers of different levels of care into a new single institution—Local Health Unit (LHU)—and to From the *Escola Nacional de Sau´de Pu´blica, Universidade NOVA
de Lisboa; Centro de Investigac¸a˜o em Sau´de Pu´blica, Escola Nacional de Sau´de Pu´blica, Universidade NOVA de Lisboa. Escola Nacional de Sau´de Pu´blica, Lisboa, Portugal; and wEscola Nacional de Sau´de Pu´blica, Universidade NOVA de Lisboa. Escola Nacional de Sau´de Pu´blica, Lisboa, Portugal.
A preliminary and partial version of this work was presented at the 16th International Conference on Integrated Care, May 2016, Barcelona. Supported by the Calouste Gulbenkian Foundation.
The authors declare no conflict of interest.
Reprints: Sı´lvia Lopes, PhD, Escola Nacional de Sau´de Pu´blica, Avenida Padre Cruz, 1600-560 Lisboa, Portugal. E-mail: silvia.lopes @ensp.unl.pt.
Supplemental Digital Content is available for this article. Direct URL cita-tions appear in the printed text and are provided in the HTML and PDF versions of this article on the journal’s Website, www.lww-medical care.com.
Copyrightr2017 The Author(s). Published by Wolters Kluwer Health, Inc.
This is an open-access article distributed under the terms of the Creative Commons Attribution-Non Commercial-No Derivatives License 4.0 (CCBY-NC-ND), where it is permissible to download and share the work provided it is properly cited. The work cannot be changed in any way or used commercially without permission from the journal.
define the new organization design. This intervention oc-curred in a limited number of providers, whereas others re-mained unaltered. LHUs are entirely accountable for health care delivery, health promotion, and public health of the population in the catchment area. In 2014 integrated pro-viders were accountable for 11.6% of the population in the country.22
Although there are increasing needs for coordination between providers, our understanding of the relationship between vertical integration and readmissions is still in-sufficient to guide future developments, as there is mixed evidence about it. An increased level of integration between acute and primary care has been shown to reduce read-missions,23–25but other studies indicate that benefit occurred but only for some patients,26whereas reviews on this subject report both a positive effect and its absence.27–30Despite its important findings, prior research focused mainly on inter-ventions aimed at partial components of care provision or specific groups of patients.24,25,27–30 A study focusing on organizational-level integration reports that nonintegrated providers had a higher risk of readmission for people aged 65 and over [odds ratio (OR) = 1.10; 95% confidence interval (CI), 1.03–1.16].26 However, these results were not con-sistent by condition, as the opposite was found for diabetes, and for 3 conditions there were no significant differences (chronic obstructive pulmonary disease, hypertension, and congestive heart failure).26 More recent studies about ac-countable care organizations show that the readmission rate was 1.3% higher in accountable care organizations with less primary care orientation.23
The need remains to compare the same providers in the prevertical and postvertical integration periods. In this study, we expand on the literature by looking at the evolution of readmissions after the creation of providers integrated at a complete organizational level targeting health of the whole population in a geographic area, and then comparing that evolution with the evolution of nonintegrated providers, over a 10-year period.
This study assesses the impact of vertical integration on hospital readmissions in Portugal, with a view to generate evidence relevant to monitor existing integrated providers and to decide upon the creation of new ones.
METHODS
Study Design
We compared unplanned 30-day readmissions before and after vertical integration in 6 hospitals transitioned to vertically integrated units in a 10-year period (2004–2013). The independent effect of vertical integration on hospital readmissions was assessed at the admission level with a difference-in-differences technique. Accordingly, the 6 hos-pitals transitioned to vertically integrated units formed the intervention group, and a control group of 6 institutions having similar characteristics was utilized. The occurrence of a 30-day unplanned readmission was the outcome considered as dependent variable (1: readmitted). We used logistic re-gression and accounted for the impact of patients’ risk fac-tors and systemic-level effects. We assessed changes on
readmissions after vertical integration for each hospital and selected conditions.
Data Sources and Inclusion/Exclusion Criteria
Administrative data on inpatient care were provided by the Central Administration of Health System31and included sex, age, principal diagnosis, secondary diagnoses, proce-dures, discharge hospital, admission type, admission and discharge dates, discharge status, and a random unique pa-tients’ identifier.
Diagnoses and procedures were coded according to the International Classification of Diseases—9th version— Clinical Modification. Nineteen secondary diagnoses were considered. To guarantee anonymity the patients’ unique identifier was randomly generated solely for this database by the institution providing the data.
The study sample included admissions to the hospitals included in the intervention or control group in years 2004–2013 (1,597,159). We excluded 469 admissions for data quality reasons (0.03%); deceased, transferred, or left against medical advice (147,946; 9.3%); for which discharge date occurred in the last 30 days of each civil year impeding a 30-day follow-up (112,838; 7.1%); or admitted for psy-chiatric diagnoses, rehabilitation, or medical treatment of cancer (67,375; 4.2%). As vertical integration effects need time to occur, the 6-month period after the intervention was excluded (71,697 admissions, 4.5%). There were no missing data on variables included in the study.
Period and Vertical Integration Status
Available data concerned the 2004–2013 period, which allowed us to include 6 of the 8 LHUs existing in 2013. There were no data on the preintervention period for the first experience of vertical integration (1999), and the most re-cently integrated unit (2012) was also excluded, as only 1 full year of data following the intervention year was avail-able. Vertical integration of the hospitals studied occurred in February 2007 (1 hospital), September 2008 (3), November 2009 (1), and June 2011 (1).16–19
Hospitals did not self-volunteer to be integrated and the reduction of readmissions was not the main goal of vertical integration,15–21 so it was not necessary to account for these factors in the study design.
We considered 2 vertical integration statuses: hospitals transitioned to vertically integrated units (intervention group) and hospitals not vertically integrated (control group). The control group included 6 hospitals that were not vertically integrated to consider systemic-level effects affecting the evolution of readmissions during the period besides vertical integration. The control group included only hospitals in the same benchmarking group as intervention group hospitals. These clusters were previously defined by a central health authority (Central Administration of Health System) for benchmarking purposes, using hierarchical clustering and principal component analyses.32 Specialty hospitals, public-private partnerships, and hospitals with a large difference in volume of admissions were not candidates to be included in the control group. Dimension of hospitals in the control group was slightly smaller, but there was a concentration in
the range of 250–400 beds in both groups (3 in both). We compared the evolution of readmissions rate in the control group to the evolution of all hospitals in mainland Portugal. Between 2004 and 2013 the readmission rate grew 1% overall (from 3.8% to 4.8%) and 1.1% in the control group (from 5.1% to 6.2%) [see yearly values in Supplementary Digital Content (SDC), Appendix 1, Supplemental Digital Content 1, http://links.lww.com/MLR/B347]. All hospitals are not-for-profit public providers.
Dependent Variable
The primary outcome was unplanned 30-day read-missions, acute clinical events requiring urgent hospital-ization within 30 days of discharge, identified as defined elsewhere (indicator variable, 1: readmitted).33 Study was conducted at the admission level, and the dependent variable was occurrence of readmission. We selected index admis-sions from hospitals considered in the study, but the read-mission may have occurred at any public hospital in mainland Portugal.
Statistical Analysis
Characterization of the population studied included absolute and relative frequency by vertical integration status of sex, age group (0–17, 18–64, 65–84, 85+ y), condition (acute cerebrovascular disease; congestive heart failure, nonhypertensive; diabetes mellitus with complications; pneumonia; and urinary tract infections), and comorbidities (congestive heart failure; coronary atherosclerosis or angina, cerebrovascular disease; diabetes mellitus; iron deficiency or other unspecified anemias and blood disease; other infectious diseases and pneumonias; specified arrythmias) in 2004–2013. We selected these conditions based on their high frequency of admissions and readmissions. Yearly read-mission rates for intervention and control group were also computed (number of readmissions/number of admissions).
To assess the relationship between readmission and the change to a vertically integrated unit we used logistic re-gression (1: readmitted) in a difference-in-differences tech-nique. We first analyzed all admissions in the dataset, then we compared each hospital individually with the control group, and finally we ran a condition-specific analysis. This allowed us to study the impact of vertical integration at an overall level, at each unit of intervention, and for specific groups of patients.
To develop the 10-year difference-in-differences model, we computed a continuous time variable consisting of time difference in months between patients’ date of admis-sion and date of vertical integration for each hospital in the intervention group. As no vertical integration occurred for the control group, that variable was computed by assuming dataset mid-point as the intervention date. On the basis of that, an indicator variable distinguishing patients admitted after vertical integration (intervention group) or after mid-point (control group) was included in the model (1: after). Another indicator variable categorized patients admitted to the intervention group (1: intervention group). The inter-action term between these 2 indicator variables gives an estimate of the independent effect of the intervention on the
outcome studied: an OR significantly <1 indicates a reduc-tion of risk of readmission after vertical integrareduc-tion. To ad-dress potential sources of bias we included 3 covariates: individual risk of readmission, hospital of treatment, and the continuous time variable (see SDC, Appendix 2, Supple-mental Digital Content 2, http://links.lww.com/MLR/B348 for more details). Individual risk of readmission was based on age, disease, and comorbidities,33 and model discrim-ination was between 0.60 and 0.71 (values similar to those found by original authors). This risk of readmission was computed with a hierarchical logistic regression model from a larger database including all public hospitals in mainland Portugal (7,329,979 admissions), so that estimates were more stable (further details in SDC, Appendix 3, Supplemental Digital Content 3, http://links.lww.com/MLR/B349).
In the provider-specific analysis, we compared each hospital in the intervention group with all hospitals in the control group.
We also tested the consistency of impact of vertical integration across a group of selected conditions: acute cerebrovascular disease; congestive heart failure, non-hypertensive; diabetes mellitus with complications; pneu-monia; and urinary tract infections.
Finally, to test whether our results were robust to a change in the period studied, we ran a sensitivity analysis for provider-specific analysis in which we included only the 24 months before and 24 months after date of vertical in-tegration. This model included the same variables as the baseline model. However, it was not necessary to utilize the data set mid-point, as the date of vertical integration of each provider was considered for intervention and control groups. Individual risk of readmission was computed with SAS University Edition. All other analyses were run with Stata 13.0. A level of significance of 95% was considered in the study.
RESULTS
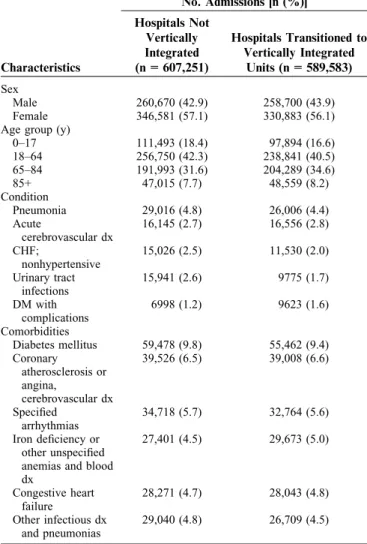
The final sample included 1,196,834 admissions during 2004–2013, of which 589,583 (49.3%) were admitted to hospitals transitioned to vertically integrated units (Table 1). Remaining admissions were treated in hospitals not verti-cally integrated (50.7%).
From 2004–2013, patients treated at hospitals transi-tioned to vertically integrated units were similar to those treated at hospitals not vertically integrated, except for the fact that they were older in the first group (above 65 y: 42.8% vs. 39.3%). All remaining absolute differences between percentages were r1% when we considered sex, age, con-dition, and comorbidities.
The overall readmission rate was 5.1% (4.8% in the intervention group; 5.4% in the control group). Throughout the 10-year period (2004–2013), yearly readmission rate was lower at hospitals transitioned to a vertically integrated unit (Fig. 1). In 2008, the difference between the intervention and control group increased (2004–2008: range, 0.2%–0.5%; 2009–2013: range, 0.7%–1.1%).
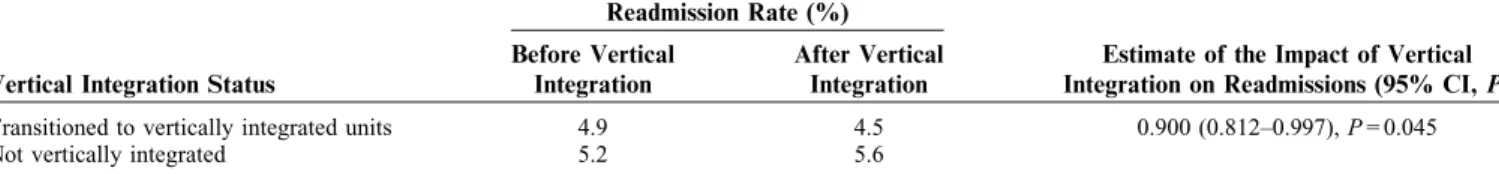
The crude readmission rate fell after vertical in-tegration from 4.9% to 4.5%, whereas it increased in the
control group (5.2%–5.6%) (Table 2). Results from the dif-ference-in-differences technique suggest that after adjust-ing for patients’ characteristics and systemic-level effects, readmissions decreased after vertical integration (OR =
0.900; 95% CI, 0.812–0.997).
Considering the period 2004–2013, readmission rate decreased in 2 hospitals (H1 = 3.9%–3.2%; H4 = 5.6%–5.0%) and increased in 1 hospital (H3 = 5.6%–6.3%) (Table 3). In the remaining hospitals absolute variations were <0.3%. We found that the risk of readmission decreased after vertical integration in 4 providers compared with the control group. We observed a significant reduction from 19% (H1 = 0.811; 95% CI, 0.736–0.894) to 10% (H6 = 0.891; 95% CI, 0.809–0.981 and H4 = 0.893; 95% CI, 0.806–0.988). For 1 hospital, there was a more moderate reduction (H5 = 0.911; 95% CI, 0.827–1.003). We found no effect for 2 providers (H3 = 0.960; 95% CI, 0.848–1.087 and H2 = 0.944; 95% CI, 0.857–1.038). Moreover, we observed that reduction
occurred among providers with high and low readmission rates (H4 = 5.6% before vertical integration; H6 = 5.0%; H1 = 3.9%; H5 = 3.8%).
We observed a considerable reduction of crude read-mission rates for patients with diabetes mellitus with com-plications after vertical integration, from 8.8% to 6.2% (Table 4). For the remaining selected conditions, absolute variations were <0.3%. The estimate of the impact of vertical integration indicated that there was a strong reduction of risk of readmission among patients with diabetes mellitus with complications (0.689; 95% CI, 0.525–0.904) and urinary tract infections (0.762; 95% CI, 0.648–0.897). For patients with pneumonia there was also a reduction of risk of read-mission (0.855; 95% CI, 0.751–0.972). No effect was found for patients with congestive heart failure (1.067; 95% CI, 0.827–1.377) or acute cerebrovascular disease (0.944; 95% CI, 0.734–1.214).
Results from the sensitivity analysis were similar to the baseline analysis. We observed a reduction of readmissions after vertical integration in 4 institutions (H1, H4, H5, and H6) and no effect at 2 (H2 and H3).
DISCUSSION
A major system change occurred in the Portuguese National Health Service when several hospitals and primary care public providers were merged into a single institution (LHU). In this study, we found that risk of readmission de-creased overall following vertical integration. Even if there was no effect for 2 hospitals, impact was positive in 4 hos-pitals. Impact of vertical integration was heterogenous in different groups of patients: there was a clear reduction of risk of readmission especially of patients with diabetes mellitus with complications and urinary tract infections. However, there was no effect for patients admitted for con-gestive heart failure or acute cerebrovascular disease. Our overall findings are consistent with the literature reporting a positive impact of organizational-level integration on read-missions,23 and also the existence of differences between conditions.26
TABLE 1. Patient Characteristics by Vertical Integration Status, 2004–2013 No. Admissions [n (%)] Characteristics Hospitals Not Vertically Integrated (n = 607,251) Hospitals Transitioned to Vertically Integrated Units (n = 589,583) Sex Male 260,670 (42.9) 258,700 (43.9) Female 346,581 (57.1) 330,883 (56.1) Age group (y)
0–17 111,493 (18.4) 97,894 (16.6) 18–64 256,750 (42.3) 238,841 (40.5) 65–84 191,993 (31.6) 204,289 (34.6) 85+ 47,015 (7.7) 48,559 (8.2) Condition Pneumonia 29,016 (4.8) 26,006 (4.4) Acute cerebrovascular dx 16,145 (2.7) 16,556 (2.8) CHF; nonhypertensive 15,026 (2.5) 11,530 (2.0) Urinary tract infections 15,941 (2.6) 9775 (1.7) DM with complications 6998 (1.2) 9623 (1.6) Comorbidities Diabetes mellitus 59,478 (9.8) 55,462 (9.4) Coronary atherosclerosis or angina, cerebrovascular dx 39,526 (6.5) 39,008 (6.6) Specified arrhythmias 34,718 (5.7) 32,764 (5.6) Iron deficiency or other unspecified anemias and blood dx 27,401 (4.5) 29,673 (5.0) Congestive heart failure 28,271 (4.7) 28,043 (4.8) Other infectious dx and pneumonias 29,040 (4.8) 26,709 (4.5)
The final sample included 1,196,834 admissions, with 49.3% admitted to hospitals transitioned to vertically integrated units.
CHF indicates congestive heart failure; DM, diabetes mellitus; dx, disease.
FIGURE 1. Yearly readmission rate (%) by vertical integration status, 2004–2013. Overall readmission rate was 5.1% (4.8% in hospitals transitioned to vertically integrated units, 5.4% in hospitals not vertically integrated). The period studied is 2004–2013, and the 6 months after vertical integration were excluded (n = 1,196,834 admissions).
Our study demonstrates that vertical integration had a positive impact on readmissions in 4 of the 6 institutions. A possible insight into the context and process of implementation34 of vertical integration is provided by the perception of professionals regarding the level of integration achieved. Earlier studies sought to evaluate the perception of integration in hospitals transitioned to vertically integrated units in Portugal. A group of 544 individuals was queried in 2010, and the same questionnaire was used again in 2015 (n = 294).35,36 These groups included physicians from pri-mary and acute care, and managers from top and inter-mediate levels from institutions studied. Available evidence indicated that the professionals’ perceptions of integration had increased with time and some institutions achieved higher levels of integration, which is in line with the dif-ferences in scale of the impact that we observed. The rela-tionship between the perception of integration at each provider and the impact of vertical integration on read-missions needs to be studied further. Also, detailed knowl-edge from case studies on differences between providers that sheds light on enablers of and barriers to vertical integration is needed. Still, it is important to note that earlier studies have shown that readmissions are a multifactorial event, and in some cases difficult to reduce even with initiatives aimed directly at that purpose.37,38
Moreover, it should be highlighted that this was a policy-level change, as the Ministry of Health defined centrally which providers would be merged and central ini-tiatives were limited, leaving to each institution the respon-sibility to increase integration at the operational level, choosing which initiatives to pursue and their content. Therefore, we can expect that process and measures of im-plementation may have differed among institutions, which is consistent with the different scale of impacts we found by institution.
The evolution of readmissions was different depend-ing on condition, which adds to the complexity of the mechanisms that link vertical integration and readmissions. Possible explanations include the fact that readmissions for some conditions may be more susceptible to integration between acute and primary care or there were differences in the collaboration between primary care and hospital pro-fessionals that differed between conditions. These findings warrant further study, but the involvement of professionals in the vertical integration process, particularly physicians, is a condition for the success of this organizational change.39The reduction of readmissions from patients with complicated diabetes is the greatest effect detected in our study, as the risk of readmission decreased nearly 30%. In Portugal, there is a national program for the control of
TABLE 2. Readmission Rate (%) Before and After Vertical Integration, and Adjusted Difference-in-Differences Estimate of the Impact of Vertical Integration on Readmissions, 2004–2013
Readmission Rate (%)
Vertical Integration Status
Before Vertical Integration
After Vertical Integration
Estimate of the Impact of Vertical Integration on Readmissions (95% CI, P) Transitioned to vertically integrated units 4.9 4.5 0.900 (0.812–0.997), P = 0.045
Not vertically integrated 5.2 5.6
The estimates are derived from a difference-in-differences logistic regression model and give an estimate of the independent effect of vertical integration on readmissions, based on an odds ratio. Values significantly <1 indicate a reduction of readmissions following vertical integration. Results are presented relative to a control group of hospitals that did not transition to a vertically integrated unit. The period studied is 2004–2013 and the 6 months after vertical integration were excluded (n = 1,196,834 admissions).
CI indicates confidence interval.
TABLE 3. Readmission Rate (%) Before and After Vertical Integration, and Adjusted Difference-in-Differences Estimate of the Impact of Vertical Integration on Readmissions for Each Hospital Transitioned to a Vertically Integrated Unit, 2004–2013
Readmission Rate (%) Hospitals Before Vertical Integration After Vertical Integration
Estimates of the Impact of Vertical Integration on Readmissions (95% CI, P) H1 3.9 3.2 0.811 (0.736–0.894), P < 0.001 H2 4.7 4.8 0.944 (0.857–1.038), P = 0.234 H3 5.6 6.3 0.960 (0.848–1.087), P = 0.521 H4 5.6 5.0 0.893 (0.806–0.988), P = 0.029 H5 3.8 3.8 0.911 (0.827–1.003), P = 0.058 H6 5.0 4.7 0.891 (0.809–0.981), P = 0.019
H1–H6 are the hospitals transitioned to vertically integrated units. The estimates are derived from a difference-in-differences logistic regression model and give an estimate of the independent effect of vertical integration on readmissions, based on an odds ratio. Values significantly <1 indicate a reduction of readmissions following vertical integration. Results are presented relative to a control group of hospitals that did not transition to a vertically integrated unit. The period studied is 2004–2013 and the 6 months after vertical integration were excluded (nZ674,213 admissions).
diabetes that aims to integrate the various levels of diabetes management and prevention.40 It is possible that the or-ganizational design of integrated providers created a con-text favorable to the adoption of actions in the program, allowing for better results than those achieved by non-integrated providers. We observed that approximately 40% of admissions were from patients over 65 years old (ap-proximately 8% above 85), so it was interesting to observe also a positive impact of vertical integration on the read-mission of patients admitted with urinary tract infection. However, the absence of an effect for congestive heart failure patients is reason for concern, due to the high readmission rates observed.
Our study has important implications that should be considered in future developments in vertical integration initiatives. These initiatives would gain from a case study of some providers or conditions showing what aspects of the context were more favorable to the intervention, what spe-cific processes and measures of implementation were put in place and how, and what level of integration was achieved and its relation with the scale of reduction of readmissions. Patients with congestive heart failure are a group to consider, as it is a condition for which no effect was found and ini-tiatives to reduce readmissions have been described.41 In Portugal, vertical integration lacked traditional incentives to support its development, such as the definition of common performance measures for all levels of care.39 Instead, dif-ferent performance measures were adopted at each level, apparently unrelated with each other, creating potential in-centives for fragmented focus of care. Therefore, the ques-tion remains whether improvements could have been realized in a more coordinated program. Finally, vertical integration was expected to reduce readmissions, but there were many reasons for vertical integration, which aimed to increase
ef-ficiency, effectiveness, and population-level outcomes.15–21 Adding to the fact that the consequences of such a complex intervention cannot be reduced to a binary answer (works/ does not work), this study’s results do not provide an evaluation of the overall success of the vertical integration experience. Such an evaluation would also require consid-ering other outcomes and the cost-effectiveness of the in-tervention.
The study’s findings must be borne in light of several limitations. Readmissions are focused on the hospitals’ per-spective, so the viewpoint of primary care was out of the scope of this study. Considering patients’ experiences and emergency department use would provide a complementary perspective on the outcomes of vertical integration. Patients’ experiences of coordination problems6 are relevant, and reasons why patients return after discharge are still not clearly understood or addressed.42 Emergency department visits have a considerable impact on health care use and are disruptive for patients and their families.43 Another limi-tation resides in the fact that our results cannot be ex-trapolated to the 2 integrated units we were not able to include in the study. The limitations of administrative data we used for risk adjustment are well described elsewhere.44 Despite having accounted for the major risk factors for re-admission and considering that rere-admissions from the con-trol group followed the country’s evolution trend, the risk of unmeasured differences remains a weakness of any ob-servational research. Randomized control trials offer prom-ising insights into health services research, but that study design was not feasible in this case.
In summary, our results indicate that merging acute and primary care providers into LHUs was associated with reduced risk of readmission, even though improvements were not found for all institutions or condition-specific
TABLE 4. Readmission Rate (%) Before and After Vertical Integration, and Adjusted Difference-in-Differences Estimate of the Impact of Vertical Integration on Readmissions for Selected Conditions, 2004–2013
Readmission Rate (%) Conditions Before Vertical Integration After Vertical Integration
Estimate of the Impact of Vertical Integration on Readmissions (95% CI, P) Pneumonia
Transitioned to vertically integrated units 8.2 8.2 0.855 (0.751–0.972), P = 0.017
Not vertically integrated 9.6 11.0
Acute cerebrovascular disease
Transitioned to vertically integrated units 5.3 5.1 0.944 (0.734–1.214), P = 0.653
Not vertically integrated 7.1 7.6
Congestive heart failure, nonhypertensive
Transitioned to vertically integrated units 10.5 10.2 1.067 (0.827–1.377), P = 0.616
Not vertically integrated 14.0 13.1
Urinary tract infections
Transitioned to vertically integrated units 9.1 9.1 0.762 (0.648–0.897), P = 0.001
Not vertically integrated 9.1 11.5
Diabetes mellitus with complications
Transitioned to vertically integrated units 8.8 6.2 0.689 (0.525–0.904), P = 0.007
Not vertically integrated 10.2 11.3
Selection of conditions included in the table is based on their high frequency of admissions and readmissions. The estimates are derived from a difference-in-differences logistic regression model and give an estimate of the independent effect of vertical integration on readmissions, based on an odds ratio. Values significantly <1 indicate a reduction of readmissions following vertical integration. Results are presented relative to a control group of hospitals that did not transition to a vertically integrated unit. The period studied is 2004–2013 and the 6 months after vertical integration were excluded (nZ16,621 admissions).
groups. These findings suggest that vertical integration can have a positive impact, but there are still challenges to be addressed regarding the success of vertical integration in reducing 30-day hospital readmissions.
ACKNOWLEDGMENT
The authors thank the deputy editor and reviewers for their helpful comments.
REFERENCES
1. Haggerty JL, Reid RJ, Freeman GK, et al. Continuity of care: a multidisciplinary review. BMJ. 2003;327:1219–1221.
2. World Health Organization. People-Centred and Integrated Health
Services: An Overview of the Evidence: Interim Report. Geneva:
WHO—World Health Organization; 2015.
3. Centers for Medicare and Medicaid Services. Improving Quality of Care
for Medicare Patients: Accountable Care Organizations. Baltimore,
MD: Centers for Medicare and Medicaid Services; 2016.
4. Shaw S, Rosen R, Rumbold B. An Overview of Integrated Care in the
NHS: What is Integrated Care?. London: Nuffield Trust; 2011.
5. Coleman K, Austin BT, Brach C, et al. Evidence on the chronic care model in the new millennium. Health Aff. 2009;28:75–85.
6. Osborn R, Moulds D, Squires D, et al. International survey of older adults finds shortcomings in access, coordination, and patient-centered care. Health Aff. 2014;33:2247–2255.
7. Coleman EA, Parry C, Chalmers S, et al. The care transitions intervention: results of a randomized controlled trial. JAMA Intern
Med. 2006;166:1822–1828.
8. Verhaegh KJ, MacNeil-Vroomen JL, Eslami S, et al. Transitional care interventions prevent hospital readmissions for adults with chronic illnesses. Health Aff. 2014;33:1531–1539.
9. Jencks SF, Williams MV, Coleman EA. Rehospitalizations among patients in the medicare fee-for-service program. N Engl J Med. 2009; 360:1418–1428.
10. Sousa-Pinto B, Gomes AR, Oliveira A, et al. Reinternamentos hospitalares em Portugal na u´ltima de´cada. [Hospital readmissions in Portugal over the last decade]. Acta Med Port. 2013;26:711–720.
11. Agency for Healthcare Research and Quality. Saving Lives and Saving
Money: Hospital-Acquired Conditions Update: Interim Data From National Efforts to Make Care Safer: 2010-2014. Rockville, MD:
AHRQ—Agency for Healthcare Research and Quality; 2016. 12. Krumholz HM. Post-hospital syndrome: a condition of generalized risk.
N Engl J Med. 2013;368:100–102.
13. Walraven C, van, Bennett C, Jennings A, et al. Proportion of hospital readmissions deemed avoidable: a systematic review. Can Med Assoc J. 2011;183:391–402.
14. Hansen LO, Young RS, Hinami K, et al. Interventions to reduce 30-day rehospitalization: a systematic review. Ann Intern Med. 2011;155:520–528. 15. Decreto-Lei n.1 207/1999. Criac¸a˜o da Unidade Local de Sau´de de Matosinhos. [Creation of Local Health Unit of Matosinhos] Dia´rio da Repu´blica 2005;1a se´rie A:3258–64. Available at: https://dre.pt/ application/file/310886. Accessed December 29, 2016.
16. Decreto-Lei n.1 50-B/2007. Criac¸a˜o da Unidade Local de Sau´de do Norte Alentejano [Creation of Local Health Unit of Norte Alentejano]. Dia´rio da Repu´blica 2007;1a se´rie:1414–29. Available at: https://dre.pt/ application/file/470118. Accessed December 29, 2016.
17. Decreto-Lei n.1 183/2008. Criac¸a˜o das Unidades Locais de Sau´de da Guarda, Baixo Alentejo e Alto Minho [Creation of Local Health Units of Guarda, Baixo Alentejo, and Alto Minho]. Dia´rio da Repu´blica 2008;1a se´rie:6225–33. Available at: https://dre.pt/application/file/ 453939. Accessed December 29, 2016.
18. Decreto-Lei n.1 318/2009. Criac¸a˜o da Unidade Local de Sau´de de Castelo Branco [Creation of Local Health Unit of Castelo Branco]. Dia´rio da Repu´blica 2009;1a se´rie:8310–7. Available at: https://dre.pt/ application/file/483318. Accessed December 29, 2016.
19. Decreto-Lei n.1 67/2011. Criac¸a˜o da Unidade Local de Sau´de do Nordeste [Creation of Local Health Unit of Nordeste]. Dia´rio da Repu´blica 2011;1a se´rie:3032–41. Available at: https://dre.pt/applica tion/file/673493. Accessed December 29, 2016.
20. Decreto-Lei n.1 238/2012. Criac¸a˜o da Unidade Local de Sau´de do Litoral Alentejano [Creation of Local Health Unit of Litoral Alentejano]. Dia´rio da Repu´blica 2012;1a se´rie:6288–97. Available at: https://dre.pt/application/file/191630. Accessed December 29, 2016. 21. OECD. OECD Reviews of Health Care Quality: Portugal 2015: Raising
Standard. Paris: OECD—Organisation for Economic Co-operation and
Development; 2015.
22. ACSS. Ministe´rio da Sau´de Contrato-Programa 2014: metodologia
para definic¸a˜o de prec¸os e fixac¸a˜o de objectivos. Lisboa:
Admin-istrac¸a˜o Central do Sistema de Sau´de. Ministe´rio da Sau´de; 2013. 23. McWilliams JM, Chernew ME, Zaslavsky AM, et al. Delivery system
integration and health care spending and quality for medicare beneficiaries. JAMA Intern Med. 2013;173:1447–1456.
24. White B, Carney PA, Flynn J, et al. Reducing hospital readmissions through primary care practice transformation. J Fam Pract. 2014;63: 67–74.
25. Brooke BS, Stone DH, Cronenwett JL, et al. Early primary care provider follow-up and readmission after high-risk surgery. JAMA Surg. 2014;149:821–828.
26. Schiøtz M, Price M, Frølich A, et al. Something is amiss in Denmark: a comparison of preventable hospitalisations and readmissions for chronic medical conditions in the Danish healthcare system and Kaiser Permanente. BMC Health Serv Res. 2011;11:347.
27. Hesselink G, Schoonhoven L, Barach P, et al. Improving patient handovers from hospital to primary care: a systematic review. Ann
Intern Med. 2012;157:417–428.
28. Martı´nez-Gonza´lez NA, Berchtold P, Ullman K, et al. Integrated care programmes for adults with chronic conditions: a meta-review. Int J
Qual Health Care. 2014;26:561–570.
29. Nolte E, Pitchforth E. What is the Evidence on the Economic Impacts
of Integrated Care? Copenhagen: WHO—World Health Organization;
2014.
30. Kansagara D, Chiovaro JC, Kagen D, et al. Transitions of Care From
Hospital to Home: An Overview of Systematic Reviews and Recom-mendations for Improving Transitional Care in the Veterans Health Administration. Portland, OR: ESP—Evidence-based Synthesis
Pro-gram; 2015.
31. ACSS. Ministe´rio da Sau´de Administrac¸a˜o Central do Sistema de
Sau´de, IP [flyer]. Lisboa: ACSS; 2016. Available at: http://www2.acss.
min-saude.pt/portals/0/Flyer%20acss%20EN.pdf.
32. Ministe´rio da Sau´de. Administrac¸a˜o Central do Sistema de Sau´de
Abordagem Metodolo´gica. Lisboa: ACSS—Administrac¸a˜o Central do
Sistema de Sau´de; 2013. Available at: http://benchmarking.acss.min-saude.pt/aces-benchmarking/enquadramentoaces/abordagemmetodologica. aspx.
33. Yale New Haven Health Services Corporation, Center for Outcomes Research & Evaluation. 2014 Measures Updates and Specifications
Report: Hospital-wide All-Cause Unplanned Readmission: Version 30.
New Haven, CT: Yale New Haven Health Services Corporation, Center for Outcomes Research & Evaluation; 2014.
34. Agency for Healthcare Research and Quality. Methods Research
Report: Contextual Frameworks for Research on the Implementation of Complex System Interventions. Rockville, MD: AHRQ—Agency for
Healthcare Research and Quality; 2014.
35. Marques AP, Barreto X, Lourenc¸o A, et al. Medir o processo. In: Santana R, Marques AP, eds. A integrac¸a˜o vertical de cuidados de
sau´de. Lisbon: Escola Nacional de Sau´de Pu´blica; 2016:153–182.
36. Gonc¸alves RC. Estudo sobre o grau de integrac¸a˜o de organizac¸o˜es de
sau´de: EGIOS II. Lisbon: Universidade Nova de Lisboa. Escola
Nacional de Sau´de Pu´blica; 2015. Available at: https://run.unl.pt/ handle/10362/16274.
37. Gonc¸alves-Bradley DC, Lannin NA, Clemson LM, et al. Discharge planning from hospital. Cochrane Database Syst Rev. 2016;1:CD000313. 38. Brewster AL, Cherlin EJ, Ndumele CD, et al. What works in readmissions reduction: how hospitals improve performance. Med Care. 2016;54:600–607.
39. Suter E, Oelke ND, Adair CE, et al. Ten key principles for successful health systems integration. Healthc Q. 2009;13:16–23.
40. Richardson E, Zaletel J, Nolte E. National Diabetes Plans in Europe:
What Lessons are There for the Prevention and Control of Chronic Diseases in Europe?. Copenhagen: World Health Organization Regional
Office for Europe; 2016.
41. Albert NM, Barnason S, Deswal A, et al. Transitions of care in heart failure: a scientific statement from the American Heart Association.
Circ Heart Fail. 2015;8:384–409.
42. Suffoletto B, Hu J, Guyette M, et al. Factors contributing to emergency department care within 30 days of hospital discharge and potential ways to prevent it: differences in perspectives of patients, caregivers, and emergency physicians. J Hosp Med. 2014;9:315–319.
43. Forster AJ, Murff HJ, Peterson JF, et al. The incidence and severity of adverse events affecting patients after discharge from the hospital. Ann
Intern Med. 2003;138:161–167.
44. Sarrazin MSV, Rosenthal GE. Finding pure and simple truths with administrative data. J Am Med Assoc. 2012;307:1433–1435.