Effect of weight and body composition
changes on waist measurement of
severely obese women receiving
carbohydrate-restricted diet
Efeito da alteração de peso e composição corporal
sobre medidas abdominais de mulheres
obesas graves, recebendo dieta com
restrição de carboidratos
Andresa Toledo TRIFFONI-MELO1
Rita de Cássia Lusia dos SANTOS2
Rosa Wanda DIEZ-GARCIA2
A B S T R A C T
Objective
To evaluate the effect of weight and body composition changes on waist measurement of severely obese women receiving a low-carbohydrate diet for a short-term.
Methods
Nineteen severely obese women divided into an intervention and a control group received a low-carbohydrate diet and a conventional diet, respectively, both with 1,200kcal, for seven days. Anthropometric measurements such as weight, body mass index, arm circumference, waist circumference (at the navel), two proposed measurements of waist circumference (waist circumference 1, 10cm above the navel; and waist circumference 2, 20cm above the navel), hip circumference; and body composition (lean mass and fat mass) were performed at baseline and end of the study.
Results
There was significant reduction of all variables in the intervention group (p<0.01), but the control group had no change in waist circumference (p=0.06) and hip circumference (p=0.36). Patients of the intervention group
1Universidade de São Paulo, Faculdade de Medicina de Ribeirão Preto, Programa de Pós-Graduação em Clínica Médica. Ribeirão
Preto, SP, Brasil.
2Universidade de São Paulo, Faculdade de Medicina de Ribeirão Preto, Departamento de Clínica Médica. Av. Bandeirantes,
3900, 14049-900, Ribeirão Preto, SP, Brasil. Correspondência para/Correspondence to: RW DIEZ-GARCIA. E-mail: <[email protected]>.
presented greater weight loss (4.4kg, p<0.01) and reduction of body mass index, waist circumference, waist circumference 1, waist circumference 2 (p<0.01), and fat mass (p=0.04) than the control group.
Conclusion
The weight loss and body composition changes were greater in the low-carbohydrate group than in the conventional-diet group, and they had a greater impact on waist measurements. The proposed measurements (waist circumference 1 and waist circumference 2) were sensitive to weight reduction in both groups.
Indexing terms: Abnominal circumference. Body composition. Diet, carbohydrate-restricted. Weight loss.
R E S U M O
Objetivo
Avaliar o efeito da alteração de peso e da composição corporal em medidas abdominais de mulheres obesas graves em dieta restrita em carboidratos por curto período.
Métodos
Dezenove mulheres obesas graves, divididas em grupo-intervenção (n=10) e grupo-controle (n=9), receberam durante sete dias, respectivamente, dieta restrita em carboidratos e dieta convencional, com 1.200kcal. As avaliações antropométricas - peso, índice de massa corporal, circunferência do braço, circunferência abdominal (na cicatriz umbilical), incluindo dois novos pontos propostos de medida de circunferência abdominal (circunferência abdominal 1, 10cm acima da circunferência abdominal; e circunferência abdominal 2, 20cm acima da circunferência abdominal), e circunferência do quadril - e as de composição corporal (massa magra e massa gorda) foram realizadas no início e no final do estudo.
Resultados
Houve redução significativa de todas as medidas analisadas no grupo-intervenção (p<0,01), e o grupo-controle não teve alteração em circunferência abdominal (p=0,06) e circunferência do quadril (p=0,36). As pacientes do grupo-intervenção apresentaram maior redução de peso (4,4kg, p<0,01), índice de massa corporal, circunferência abdominal, circunferência abdominal 1 e circunferência abdominal 2 (p<0,01), além de redução da massa gorda (p=0,04), quando comparadas às pacientes do grupo-controle.
Conclusão
A redução de peso, a mudança na composição corporal e o impacto nas medidas abdominais foram maiores com dieta com restrição de carboidratos do que com dieta convencional. As medidas propostas (circunferência abdominal 1 e circunferência abdominal 2) foram sensíveis à redução do peso em ambos os grupos.
Termos de indexação: Circunferência abdominal. Composição corporal. Dieta com restrição de carboidratos.
Perda de peso.
I N T R O D U C T I O N
Severe or grade III obesity is caused by excessive accumulation of adipose tissue and carries a very high risk of comorbidity. Many methods are used for measuring body composition, such as Bioelectrical Impedance Analysis (BIA) and anthropometric assessment. The latter includes weight, height, Body Mass Index (BMI), Waist Circumference (WC), Hip Circumference (HC), and waist-to-hip ratio1.
Anthropometric measurements are easy and inexpensive ways to assess nutritional status,
but they have some problems such as the errors related to the use of the technique that may stem from interpersonal variation or difficulties related to individuals’ physical characteristics2.
Although body mass index is one of the most common nutritional assessment methods, its limitations include not assessing the percentage of body fat and cut-off points unadjusted for gender and ethnicity3,4. However, when associated
with other methods, it is an effective means of nutritional status assessment.
WC is also associated with chronic Non-Communicable Diseases (NCD), such as hypertension and high serum lipids6, conditions aggravated by
the accumulation of abdominal fat2,7. The increased
of WC measurement prevalence has been higher8,9
than that of BMI, showing its importance and the need of measuring it accurately.
One of the main challenges regarding body measurements is the determination of the WC of severely obese patients10 whose excess
abdominal fat turns the abdomen into an apron because of gravity. This change in abdominal shape impairs or even prevents measuring waist circumference as usual, which requires finding the midpoint between the last rib and iliac crest11,12.
The development of sensitive anthropometric measurements for assessing weight changes and distribution of body fat is important for making the nutritional diagnosis and monitoring of obese patients, especially those with severe obesity that often prevent conventional measurement techniques.
According to Fett et al.13,BIA helps the
nutritional assessment by determining the body composition; they compared this technique with anthropometric assessments and the association of these measurements with blood markers, such as cholesterol and fractions, triglycerides, glucose, and uric acid in normal weight women and women with different obesity grades. These authors found that anthropometric assessments are sensitive enough for assessing body composition and that the percentage of body fat correlates well with biochemical markers.
Various types of diet are used for treating obesity. A low-carbohydrate diet that restricts carbohydrate intake to less than 20% of the total energy has been widely used for reducing weight and abdominal fat14,15. A study with obese women
receiving three different diets (low-carbohydrate and high fat diet; high protein diet; and high carbohydrate and fiber diet - control diet) found that the weight loss and waist circumference reduction were higher in women consuming the low-carbohydrate diet after a 24-week
intervention16. A similar result was showed in
another study: a very low-carbohydrate diet followed by obese women resulted in greater fat and lean body mass reduction after three and six months, respectively, than one low fat17.
The evaluation of body measurements and body composition are very important for identifying obesity and body changes due to dietary interventions. These identify excess body fat, its distribution, especially abdominal obesity, strongly related with the onset of cardiovascular diseases2,3,18 and allow one to know the effects
of diet composition on body changes. Therefore, the objective of this study was to assess the effect of weight and body composition changes on the abdominal measurements of severely obese women receiving a short-term low carbohydrate diet.
M E T H O D S
Twenty obese females with a BMI >40kg/m2 aged 20 to 50 years were selected for
the study and hospitalized at the Hospital da Faculdade de Medicina de Ribeirão Preto da
Universidade de São Paulo (HCFMRP-USP).
Exclusion criteria were diabetes Mellitus, use of diuretics, chronic renal failure, chronic liver failure, obesity caused by endocrine diseases, eating disorders, and severe psychiatric diseases, including alcohol and drug abuse, neoplasms, and active systemic inflammatory or infectious diseases19. Indeed, patients taking metformin
were asked to discontinue it.
The participants signed an Informed Consent Form and were divided into two groups: the intervention group, which received the hypocaloric, low-carbohydrate diet, and the control group, which received a conventional hypocaloric diet.
Both groups received the same amount of energy (1,200kcal). However, the macronutrient composition of the diets was different. The intervention group received a diet containing 45g of carbohydrates (15%), 105g of proteins (35%), and 67g of fat (50%). The control group received a diet with 171g of carbohydrates (54%), 74g of proteins (23%), and 32g of fat (23%). Both were administered for seven days and fractioned into six meals per day.
The anthropometric and body composition measurements were evaluated at baseline (before starting the diet) and on the day 8 (after seven days of dieting). Weight was determined by an electronic scale (Filizola ID-1500) with an accuracy of 200g and capacity of 300kg and BMI was calculated. Arm, abdominal, and HC were measured using an inelastic tape measure (200cm). Arm Circumference (AC) was measured at the midpoint between the acromion and olecranon. Abdominal circumference was measured at three points: at the navel, a location used commonly by some services because of the inability to measure at the conventional point11,
the midpoint between the last rib and iliac crest, and two new proposed points: 10cm above the navel (WC1), and 20cm above the navel (WC2). HC was obtained at the widest point between the hip and buttock.
Body composition was assessed by BIA, used for estimating Lean Mass (LM) and Fat Mass (FM). BIA measures resistance in ohms, used in the formula21 for calculating the LM and FM of
obese individuals. The body composition was evaluated after an overnight fast using the device Biodynamics BIA 450.
The data were tabulated in an Excel spreadsheet and analyzed by the statistical software SAS® 9.0. A linear mixed effect model
(random and fixed) was used for comparing the baseline and end-of-study variables, and Analysis of Variance (Anova) for comparing the differences between groups22,23. The results were presented
as means ± standard deviation. The significance level was set at 5% (p<0.05).
R E S U L T S
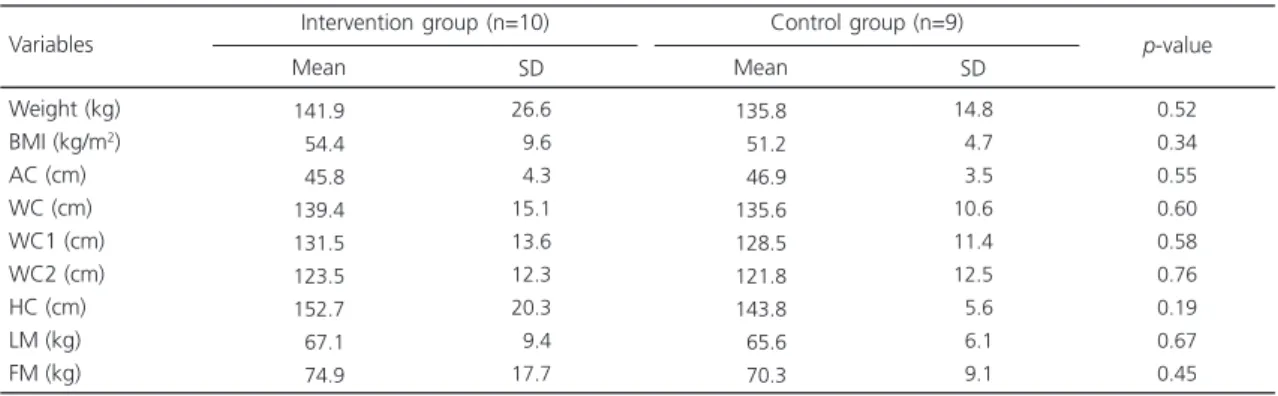
Twenty individuals were selected for this study but only nineteen completed the study. One person from the control group was excluded for not following the study protocol. The study sample was considered homogeneous regarding the anthropometric and body composition measurements (Table 1). The mean age was also similar between the groups: 35±8 years in the intervention group and 32±8 years in the control group.
Table 1. Baseline anthropometric and body composition assessment of the groups. Ribeirão Preto (SP), Brazil, 2007-2008.
Note: Values expressed as Mean ± Standard Deviation (SD); There was no statistically significant difference.
BMI: Body Mass Index; AC: Arm Circumference; WC: Waist Circumference; WC1: Waist Circumference 10cm above the navel; WC2: Waist Circumference 20cm above the navel; HC: Hip Circumference; LM: Lean Mass; FM: Fat Mass.
141.9 054.4 045.8 139.4 131.5 123.5 152.7 067.1 074.9 Weight (kg) BMI (kg/m2)
AC (cm) WC (cm) WC1 (cm) WC2 (cm) HC (cm) LM (kg) FM (kg) 26.6 09.6 04.3 15.1 13.6 12.3 20.3 09.4 17.7 Variables Mean SD
Intervention group (n=10)
135.8 051.2 046.9 135.6 128.5 121.8 143.8 065.6 070.3 14.8 04.7 03.5 10.6 11.4 12.5 05.6 06.1 09.1 Mean SD
Control group (n=9)
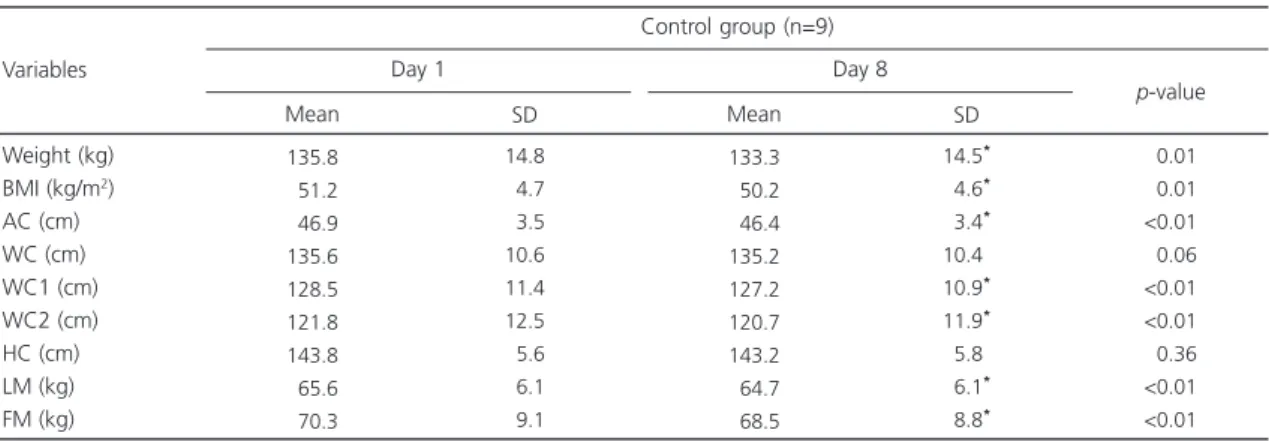
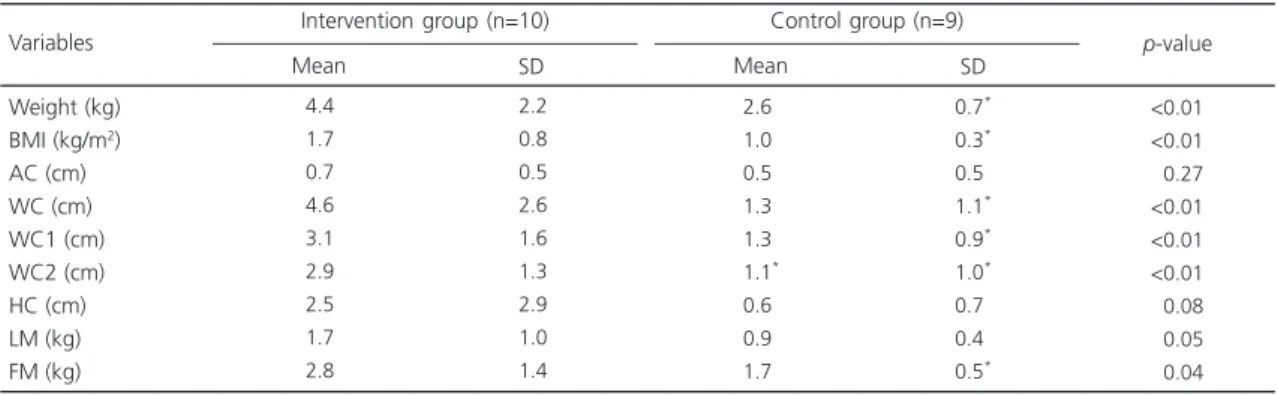
At the end of the study, the patients in the intervention group (n=10) presented significant losses for all anthropometric and body composition measurements (Table 2). On the other hand, the WC and HC of the patients in the control group did not decrease significantly (n=9), but the other parameters did (Table 3). Obese women with low-carbohydrate diet showed greater weight loss and waist circumference (WC, WC1 and WC2) and fat mass reduction than obese women following conventional diet (Table 4).
Table 2. Anthropometric and body composition assessment of the intervention group during one week. Ribeirão Preto (SP), Brazil, 2007-2008.
Note: Values expressed as Mean ± Standard Deviation (SD). *Statistically significant difference.
BMI: Body Mass Index; AC: Arm Circumference; WC: Waist Circumference; WC1: Waist Circumference 10cm above the navel; WC2: Waist Circumference 20cm above the navel; HC: Hip Circumference; LM: Lean Mass; FM: Fat Mass.
141.9 054.4 045.8 139.4 131.5 123.5 152.7 067.1 074.9 Weight (kg) BMI (kg/m2)
AC (cm) WC (cm) WC1 (cm) WC2 (cm) HC (cm) LM (kg) FM (kg) 26.6 09.6 04.3 15.1 13.6 12.3 20.3 09.4 17.7 Variables Mean SD Day 1 137.5 052.6 045.1 134.8 128.4 120.6 150.2 065.4 072.1 26.2* 09.4* 04.4* 13.5* 14.0* 12.2* 20.2* 09.3* 17.3* Mean SD Day 8 <0.01 <0.01 <0.01 <0.01 <0.01 <0.01 <0.01 <0.01 <0.01 p-value Intervention group (n=10)
Table 3. Anthropometric and body composition assessment of the control group during one week. Ribeirão Preto (SP), Brazil, 2007-2008.
Note: Values expressed as Mean ± Standard Deviation (SD). *Statistically significant difference.
BMI: Body Mass Index; AC: Arm Circumference; WC: Waist Circumference; WC1: Waist Circumference 10cm above the navel; WC2: Waist Circumference 20cm above the navel; HC: Hip Circumference; LM: Lean Mass; FM: Fat Mass.
135.8 051.2 046.9 135.6 128.5 121.8 143.8 065.6 070.3 Weight (kg) BMI (kg/m2)
AC (cm) WC (cm) WC1 (cm) WC2 (cm) HC (cm) LM (kg) FM (kg) 14.8 04.7 03.5 10.6 11.4 12.5 05.6 06.1 09.1 Variables Mean SD Day 1 133.3 050.2 046.4 135.2 127.2 120.7 143.2 064.7 068.5 14.5* 04.6* 03.4* 10.4* 10.9* 11.9* 05.8* 06.1* 08.8* Mean SD Day 8 <0.01 <0.01 <0.01 <0.06 <0.01 <0.01 <0.36 <0.01 <0.01 p-value Control group (n=9)
D I S C U S S I O N
intervention group experienced significant losses in all three measurements.
When the groups are compared, all indicators changed, except for arm and hip circumferences. Regarding anthropometric measurements, abdominal circumferences were more sensitive to dietary changes, despite the short-term intervention. The obese women with low-carbohydrate diet had greater reduction of waist circumference when compared to obese women with conventional diet. Nevertheless, these values were still much higher than those recommended by the World Health Organization (WHO)24. Verweij et al.25 discuss the errors
associated with abdominal circumference measurements, showing that the changes between them may be clinically significant. However, additional abdominal measurements, such as those performed by the present study (WC1 and WC2), may attenuate the errors by increasing the accuracy of the abdominal measurements.
The significant reduction in the WC measurements of the intervention group may suggest an improvement in the metabolic profile, as demonstrated by Laaksonen et al.26, who
studied patients with the metabolic syndrome following a hypocaloric diet during nine weeks and maintaining the weight for one year; they
found that weight loss reduced body fat and waist circumference, which correlated with higher insulin s e n s i t i v i t y. A c c o rd i n g t o Ravensbergen et al.7 and Martins & Marinho27,
WC is significantly associated with hypertension and hypercholesterolemia.
Shai et al.28 compared the consumption
of a low-carbohydrate, a low-fat, or the Mediterranean diet by obese grade I followed by two years. Even though all groups lost waist circumference, the intergroup differences were not significant. However, the low-carbohydrate diet promoted a waist circumference reduction of 3.8cm, similar to the value found by the present study with a low-carbohydrate diet, which was of 4.6cm (WC), 3.1cm (WC1), and 2.9cm (WC2).
As observed by the control group, the proposed measurements for determining waist circumference (WC1, WC2) were sensitive to weight loss during the study period, showing that these measurements are effective and may be used, along with WC, to follow the body changes in severely obese individuals.
The obese women with low-carbohydrate diet experienced a greater weight loss than the obese women with conventional diet during the intervention period of one week. These data were corroborated by the results of many studies but with longer intervention periods, such as Samaha
Table 4. Comparison of the mean reduction in the anthropometric and body composition measurements of the intervention and control groups after one week. Ribeirão Preto (SP), Brazil, 2007-2008.
Note: Values expressed as Mean ± Standard Deviation (SD). *Statistically significant difference.
BMI: Body Mass Index; AC: Arm Circumference; WC: Waist Circumference; WC1: Waist Circumference 10cm above the navel; WC2: Waist Circumference 20cm above the navel; HC: Hip Circumference; LM: Lean Mass; FM: Fat Mass.
4.4 1.7 0.7 4.6 3.1 2.9 2.5 1.7 2.8 Weight (kg) BMI (kg/m2)
AC (cm) WC (cm) WC1 (cm) WC2 (cm) HC (cm) LM (kg) FM (kg) 2.2 0.8 0.5 2.6 1.6 1.3 2.9 1.0 1.4 Variables Mean SD
Intervention group (n=10)
2.6* 1.0* 0.5* 1.3* 1.3* 1.1* 0.6* 0.9* 1.7* 0.7* 0.3* 0.5* 1.1* 0.9* 1.0* 0.7* 0.4* 0.5* Mean SD
Control group (n=9)
et al.29 who compared a low-carbohydrate diet
(<30g/day) with a conventional hypocaloric diet (caloric restriction of 500kcal/day) in 132 severely obese individuals (BMI ≥35kg/m2). The authors
found that, after six months, the low-carbohydrate group had a weight loss of 5.7kg, and the conventional-diet group reduced 1.8kg of body weight28,30.
The Fat Mass and Lean Mass of both groups decreased significantly after one week. However, only the FM loss differed significantly between the groups, with the intervention group experiencing a greater loss than control group. The LM loss of the two groups did not differ, perhaps because of the short-term intervention. The reductions seen in the FM values for the intervention and control groups were, respectively, 2.7kg and 1.7kg, while for the LM they were 1.9kg and 0.9kg. These results are higher than those found by a review31 that analyzed the effects
of protein and carbohydrate intake on body composition in patients with hypocaloric diets, finding that a low-carbohydrate diet reduced fat mass by 1.8kg and lean mass by 0.3kg in studies up to 12 weeks.
Another study14 compared a
low-carbohydrate diet with a low-fat diet and their effects on the body composition of obese women and found that the low-carbohydrate group experienced a greater FM loss (4.7kg) and LM loss (5.9kg) at three months, and a reduction of 5.1kg and 5.8kg, respectively, at six months.
Dietary changes have an important impact on body composition and body measurements, suggesting the need of improving anthropometric techniques and technologies to assess the body compartments.
C O N C L U S I O N
The proposed abdominal measurements (WC1 and WC2) for severely obese women effectively reflected the effects of a low-carbohydrate diet, especially in abdominal obesity
measurements, since they increase the accuracy of abdominal measurement. Weight loss and body composition change were greater in obese women with low-carbohydrate than in obese women with conventional diet and the low-carbohydrate diet had a greater impact on the abdomen of the obese women. Associated with other anthropometric and body composition indicators, the proposed measurements improve nutritional assessment. The validation of these new tools in future studies will allow their use in the professional routine.
A C K N O W L E D G M E N T S
We thank Fundação de Apoio ao Ensino, Pes-quisa e Assistência of Hospital da Faculdade de Medicina de Ribeirão Preto da Universidade de São Paulo for the financial support.
C O N T R I B U T O R S
AT TRIFFONI-MELO and RW GARCIA DIEZ were responsible for the design, data collection, literature review, analysis and writing of the manuscript. RCL SANTOS collaborated in the study design, data collection, analysis and writing of the manuscript. RW DIEZ-GARCIA supervised this study. All authors were responsible for the critical review of the manuscript.
R E F E R E N C E S
1. Ellis KJ. Select body composition methods can be used in field studies. J Nutr. 2001; 131(5):1589S-9 5S. 2. Perini TA, Oliveira GL, Ornellas JS, Oliveira FP. Cál-culo do erro técnico de medição em antropometria. Rev Bras Med Esporte. 2005; 11(1):81-5. doi: 10.15 90/S1517-86922005000100009
3. Anjos LA. Índice de massa corporal (massa corpo-ral.estatura-2) como indicador do estado nutricional
de adultos: revisão da literatura. Rev Saúde Pública. 1992; 26(6):431-6. doi: 10.1590/50034-89101992 000600009
grandes estudos populacionais e clínicos. Arch Latinoam Nutr. 2007; 57(4):327-34.
5. Rankinen T, Kim SY, Pérusse L, Després JP, Bouchard C. The prediction of abdominal visceral fat level from body composition and anthropometry: ROC analysis. Int J Obes Relat Metab Disord. 1999; 23(8):801-9. doi: 10.1038/sj.ijo.0800929 6. Pereira RA, Sichieri R, Marins VMR. Razão cintura/
quadril como preditor de hipertensão arterial. Cad Saúde Pública. 1999; 15(2):333-44. doi: 10.1590/S0 102-311X1999000200018
7. Ravensbergen HR, Lear S, Claydon VE. Waist circumference is the best index for obesity in individuals with spinal cord injury. J Neurotrauma. 2013; 37(3):336-46. doi: 10.1089/neu.2013.3042 8. Elobeid MA, Brock DW, Allison DB, Padilla MA, Ruden DM. Endocrine disruptors and obesity: An examination of selected persistent organic pollutants in the NHANES 1999-2002 data. Int J Environ Res Public Health. 2010; 7(7):2988-3005. doi: 10.3390/ijerph7072988
9. Walls HL, Magliano DJ, McNeil JJ, Stevenson C, Ademi Z, Shaw J, et al. Predictors of increasing waist circumference in an Australian population. Public Health Nutr. 2011; 14(5):870-81. doi: 10.1017/S13 68980010002673
10. Chumlea WM, Guo SS. Assessment and prevalence of obesity: Application of new methods to a major problem. Endocrine. 2000; 13(2):135-42. doi: 10.1 385/ENDO:13:2:135
11. Callaway CW, Chumlea WC, Bouchard C, Himes JH, Lohman TG, Martin AD, et al. Circumferences. In: Lohman TG, Roche AF, Martorell R, Editors. Anthropometric standardization reference manual. Champaign (Ill): Human Kinetics Books; 1988. p.39-54.
12. Arnold TJ, Schweitzer A, Hoffman HJ, Onyewu C, Hurtado ME, Hoffman EP, et al. Neck and waist circumference biomarkers of cardiovascular risk in a cohort of predominantly African-American college students: A preliminary study. J Acad Nutr Diet. 2014; 114(1):107-16. doi: 10.1016/j.jand.2013.0 7.005
13. Fett CA, Fett WCR, Marchini JS. Comparação entre a bioimpedância e antropometria e a relação de índices corporais ao gasto energético de repouso e marcadores bioquímicos sanguíneos em mulheres da normalidade à obesidade. Rev Bras Cineantropom Desempenho Hum. 2006; 8(1):29-36. doi: 10.15 90/S1415-790X2011000400014
14. Laquatra I. Nutrição para o controle de peso. In: KL Mahan, S Escott-Stuump. Krause: alimentos, nutrição e dietoterapia. 11ª ed. São Paulo: Rocca; 2004. p.535-60.
15. Yancy Jr. WS, Foy M, Chalecki AM, Vernon MC, Westman EC. A low-carbohydrate, ketogenic diet to treat type 2 diabetes. Nutr Metab. 2005; 2:34. doi: 10.1186/1743-7075-2-34
16. McAuley KA, Hopkins CM, Smith KJ, McLay RT, Williams SM, Taylor RW, et al. Comparison of high-fat and high-protein diets with a high-carbohydrate diet in insulin-resistant obese women. Diabetologia. 2005; 48(1):8-16. doi: 10.1007/s00125-004 17. Brehm BJ, Seeley RJ, Daniels SR, D’Alessio DA. A
randomized trial comparing a very low carbohydrate diet and a calorie-restricted low fat diet on body weight and cardiovascular risk factors in healthy women. J Clin Endocrinol Metab. 2003; 88(4):1617-23. doi: 10.1210/jc.2002-021480 18. Maclnnis RJ, Hodge AM, Dixon HG, Peeters A,
Johnson LEA, English DR, et al. Predictors of increased body weight and waist circumference for middle-aged adults. Public Health Nutr. 2013; 1:1-11. doi: 10.1017/S1368980013001031
19. Brasil. Ministério da Saúde. Portaria 390, de 6 de julho de 2005. Institui diretrizes para a atenção ao paciente portador de obesidade. Brasília: Ministério da Saúde; 2005 [acesso 2010 out 3]. Disponível em: <http://dtr2001.saude.gov.br/sas/PORTARIAS/ Port2005/PT-390.htm>.
20. Triffoni-Melo AT, Dick-de-Paula I, Portari GV, Jordão AA, Chiarello PG, Diez-Garcia RW. Short-term carbohydrate-restricted diet for weight loss in severely obese women. Obes Surg. 2011; 21(8): 1194-202. doi: 10.1007/s11695-010-0110-6 21. Kyle UG, Bosaeus I, De Lorenzo AD, Deurenberg P,
Elia M, Manuel Gómez J, et al. Bioelectrical impedance analysis-part II: Utilization in clinical practice. Clin Nutr. 2004; 23(6):1430-53. doi: 10.10 16/j.clnu.2004.09.012
22. Schall R. Estimation in generalized linear models with random effects. Biometrika. 1991; 78(4):719-27. doi: 10.1093/biomet/78.4.719
23. Montgomery DC. Design and Analysis of Experiments. 5th ed. New York: John Wiley & Sons;
2000.
24. World Health Organization. Obesity: Preventing and managing the global epidemic. Report of a WHO consultation on obesity. Geneva: WHO; 1998. 25. Verweij LM, Terwee CB, Proper KI, Hulshof CTJ, van
Mechelen W. Measurement error of waist circumference: Gaps in knowledge. Public Health Nutr. 2013; 16(2):281-8. doi: 10.1017/S13689800 12002741
men and women. Int J Obes Relat Metab Disord. 2003; 27(6):677-83. doi: 10.1038/sj.ijp.0802296 27. Martins IS, Marinho SP. O potencial diagnóstico dos indicadores da obesidade centralizada.Rev Saúde Pública. 2003; 37(6):760-7. doi: 10.1590/S0034-89 102003000600011
28. Shai I, Schwarzfuchs D, Henkin Y, Shahar DR, Witknow S, Greenberg I, et al. Weight loss with a low-carbohydrate, mediterranean, or low-fat diet. N Engl J Med. 2008; 359(3):229-41. doi: 10.1056/NE JMoa0708681
29. Samaha FF, Iqbal N, Seshadri P, Chicano KL, Dayli DA, McGrory J, et al. A low-carbohydrate as compared with low-fat diet in severe obesity. N Engl J Med. 2003; 348(21):2074-81. doi: 10.1056/NEJ Moa022637
30. Foster GD, Wyatt HR, Hill JO, McGuckin BG, Brill C, Mohammed BS, et al. A randomized trial of a low-carbohydrate diet for obesity. N Engl J Med. 2003; 348(21):2082-90. doi: 10.1056/NEJMoa02 2207
31. Krieger WJ, Sitren HS, Daniels MJ, Langkamp-Henken B. Effects of variation in protein and carbohydrate intake on body mass and composition during energy restriction: A meta-regression 1. Am J Clin Nutr. 2006; 83(2):260-74.