_________________________________
1 Engo Agrônomo, Doutor em Microbiologia Agropecuária pela Faculdade de Ciências Agrárias e Veterinárias, UNESP,
Universidade Estadual Paulista, Câmpus de Jaboticabal.
2 Enga Química, Mestre, Doutora e Pós-doutoranda em Microbiologia Agropecuária pela Faculdade de Ciências Agrárias e
Veterinárias, UNESP, Universidade Estadual Paulista, Câmpus de Jaboticabal, Profa. Assistente da Faculdade de Tecnologia de Jaboticabal.
3 Engo Agrônomo e Tecnólogo em Construção Civil, Mestre em Agronomia e Doutor em Hidráulica e Saneamento, Prof. Dr.,
Faculdade de Ciências Agrárias e Veterinárias, UNESP, Universidade Estadual Paulista, Câmpus de Jaboticabal, Departamento de Engenharia Rural, Fone (0XX16)32092637, raoder@fcav.unesp.br.
Recebido pelo Conselho Editorial em: 29-9-2010
AND OLR TREATING RESIDUAL WATERS OF SWINE FARMING
ESTEVÃO URBINATI1, ROSE M. DUDA2, ROBERTO A. DE OLIVEIRA3
ABSTRACT: In this study it was evaluated the effects of hydraulic retention time (HRT) and Organic Loading Rate (OLR) on the performance of UASB (Upflow Anaerobic Sludge Blanket) reactors in two stages treating residual waters of swine farming. The system consisted of two UASB reactors in pilot scale, installed in series, with volumes of 908 and 188 L, for the first and second stages (R1 and R2), respectively. The HRT applied in the system of anaerobic treatment in two stages (R1 + R2) was of 19.3, 29.0 and 57.9 h. The OLR applied in the R1 ranged from 5.5 to 40.1 kg CODtotal (m3 d)-1. The average removal efficiencies of chemical oxygen demand (COD) and total
suspended solids (TSS) ranged, respectively, from 66.3 to 88.2% and 62.5 to 89.3% in the R1, and from 85.5 to 95.5% and 76.4 to 96.1% in the system (R1 + R2). The volumetric production of methane in the system (R1 + R2) ranged from 0.295 to 0.721 m3 CH4 (m3 reactor d)-1. It was found
that the OLR applied were not limiting to obtain high efficiencies of CODtotal and TSS removal and
methane production. The inclusion of the UASB reactor in the second stage contributed to increase the efficiencies of CODtotal and TSS removal, especially, when the treatment system was submitted
to the lowest HRT and the highest OLR.
KEYWORDS: anaerobic digestion, swine excrements, methane gas, UASB reactors in series, two stage treatments.
DESEMPENHO DE REATORES UASB EM DOIS ESTÁGIOS SOB DIFERENTES TDH E COV TRATANDO ÁGUAS RESIDUÁRIAS DE SUINOCULTURA
RESUMO: Neste trabalho, avaliou-se o efeito do tempo de detenção hidráulica (TDH) e da carga orgânica volumétrica (COV) no desempenho de reatores UASB (Upflow Anaerobic Sludge Blanket), em dois estágios, tratando águas residuárias de suinocultura. O sistema foi constituído por dois reatores UASB em escala-piloto, instalados em série, com volumes de 908 e 188 L, para o primeiro e segundo estágios (R1 e R2), respectivamente. Os TDH, aplicados no sistema de tratamento anaeróbio, em dois estágios (R1 + R2), foram de 19,3; 29,0 e 57,9 h. As COVs aplicadas no R1 variaram de 5,5 a 40,1 kg DQOtotal (m3 d)-1. As eficiências médias de remoção de demanda
química de oxigênio total (DQOtotal) e sólidos suspensos totais (SST) variaram, respectivamente, de
66,3 a 88,2% e de 62,5 a 89,3% no R1, e de 85,5 a 95,5% e de 76,4 a 96,1% (no sistema R1 + R2). A produção volumétrica de metano no sistema R1 + R2 variou de 0,295 a 0,721 m3 CH4
(m3 reator d)-1. Verificou-se que as COVs aplicadas não foram limitantes para a obtenção de altas eficiências de remoção de DQOtotal e SST e produção de metano. A inclusão do reator UASB no
segundo estágio contribuiu para o aumento das eficiências de remoção de DQOtotal e SST, sobretudo
quando o sistema de tratamento foi submetido aos menores TDHs e maiores COVs.
INTRODUCTION
According to FAO (2010), the swine meat is the most consumed worldwide, which makes the swine farming an important source of animal protein for the human population, exerting important role in food security. However, it is one of the activities that most accentuate its participation in the impact caused to the environment, especially with the adoption of confined systems (FERNANDES & OLIVEIRA, 2006). In such systems, the high levels of animal concentration per unit area, often cause an imbalance between the agricultural area available for nutrient recycling and the amount of excrements produced on the farm (MIRANDA, 2007), causing contamination of soil and groundwater when using the ground as the final destination.
The swine excrements, when thrown into water bodies can cause impact superior than the equivalent domestic sewage. Comparatively, a pig with their excreta may impact up to 4.6 times more than a human, because while the biochemical oxygen demand (BOD5) per capita of pigs can
reach 208 g d-1 per animal, for humans the BOD5 varies from 45 to 75 g d-1 per capita (PERDOMO
& LIMA, 1998).
According to ABREU NETO & OLIVEIRA (2009), the anaerobic digestion can be applied as an alternative in the treatment of swine culture waste, to reduce pollutant power and obtaining biogas and stabilized effluent, which may have direct application on farms.
A promising technology for anaerobic digestion, already consolidated for the treatment of domestic and industrial sewage, is the UASB reactor. In this reactor, an intern device of separation of solid/gas/liquid works with high cell retention time, even with low hydraulic retention time (HRT) (CAMPOS et al., 2005). The result is a compact reactor which requires little area for construction, with lower volume than conventional anaerobic digester.
For swine culture residual water, the use of UASB has been studied with promising results, especially for obtaining design parameters such as HRT and organic loading rate (OLR). SONG et al. (2010) operated UASB reactor of 35 m3 at a temperature of 35 ºC, using HRT decreasing from 7.0 to 3.5 and OLR increasing from 1.3 to 5.8 kg COD (m3 d)-1, and obtained efficiencies of removal from 74.0 to 78.7% for COD.
RODRIGUES et al. (2010) evaluated a system consisted of a 7.4 m3 decanter followed by UASB reactor of 11.5 m3 and applied OLR of 1.1 to 17.5 kg COD (m3 d)-1 and HRT of 1.7 to 4,1 d in the UASB reactor to treat swine culture residual water. They observed average removal efficiencies of COD of 85% in the UASB reactor, even under average air temperature of 20 ºC. The authors observed entrainment of solid particles of sludge blanket in the final effluent throughout the experimental phase and attributed the fact to potential operational irregularities.
Although the UASB reactor includes ample advantages, there are still some limitations mainly related to hydrolysis of organic solids present in greater quantity in residual water such as in swine culture. According to SEGHEZZO (1998) for residual water having high particulate organic fraction, it may be advantageous to apply the anaerobic process in two stages.
According to TREVISAN & MONTEGGIA (2009), two stage anaerobic systems present reduction of the HRT, higher performance and better stability against fluctuations of OLR. SANTANA & OLIVEIRA (2005) treated waters of swine culture using two UASB reactors of 908 and 188 L, installed in series, with HRT of 62.3 and 31.1 h and OLR of 3.4 to 14.44 kg COD (m3 d)-1 in the first reactor, and observed COD removal efficiencies above 85% in the anaerobic treatment system in two stages.
treating swine culture residual water, with HRT of 16, 24 and 48 h and OLR increasing to 40 kg COD (m3 d)-1 in the reactor R1.
MATERIAL AND METHODS
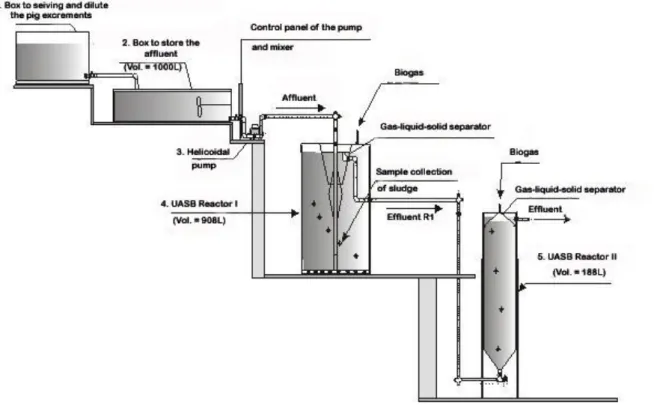
The experimental unit located in the Faculty of Agriculture and Veterinary Sciences, (Faculdade de Ciências Agrárias e Veterinárias, Universidade Estadual Paulista - FCAV/UNESP) Campus of Jaboticabal, located in Jaboticabal - State of São Paulo (SP), Brazil, was formed by two UASB reactors installed in series with volumes of 908 L (first stage - R1) and 188 L (second stage - R2), boxes for daily screening and storage of the affluent and helicoidal pump for precise control of the affluent flow in the first reactor, as illustrated in Figure 1 and described in the study of SANTANA & OLIVEIRA (2005). Coupled to the gas outputs of the reactors, hydraulic seals and gasometers were installed and built in fiberglass for monitoring the production of biogas.
The affluent used to feed the UASB reactors was swine manure pre-screened through a sieve with square mesh with opening of 3 mm to remove coarse materials that would impair the functioning of the helicoidal pump. Thus, the average concentrations of total suspended solids (TSS) in the affluent ranged from 1,417 to 13,060 mg L-1.
Source: SANTANA & OLIVEIRA (2005).
FIGURE 1. Schematic longitudinal section of the anaerobic treatment system in two stages, in pilot scale, with 908 L UASB reactor, built in armed mortar (4), and 188 L UASB reactor, built with plastic tube (polyvinyl chloride - PVC) (5).
The experimental part was conducted in five different tests, with Organic Loading Rate (OLR) applied of 5.5; 10.4; 20.7; 5.6 and 40.1 kg CODtotal (m3 d)-1 in the first reactor (R1). The
TABLE 1. Operation time and operating conditions of the UASB reactors (R1 and R2).
Test
Operation
time HRT OLR V
(h) (kg CODtotal (m3 d)-1) (cm h-1)
(d) R1 R2 R1 R2 R1 R2
1 40 48 9.9 5.5 8.4 2.6 10.9
2 41 48 9.9 10.4 5.1 2.6 10.9
3 35 24 5.0 20.7 10.8 5.2 21.8
4 57 16 3.3 5.6 4.5 7.8 32.7
5 60 16 3.3 40.1 29.7 7.8 32.7
HRT - hydraulic retention time; OLR - Organic Loading Rate; V - velocity in ascension.
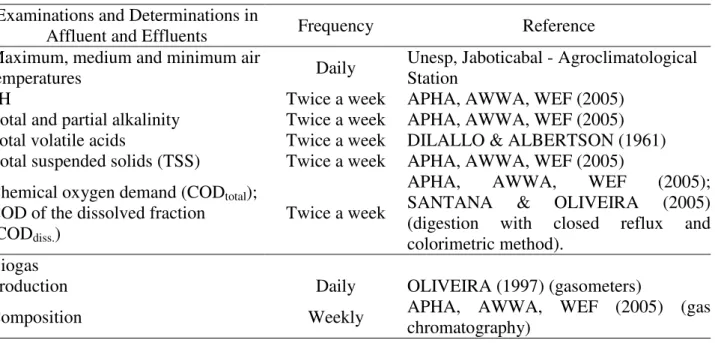
The physical examinations and determinations made in the collected samples (affluent of the reactor R1 and effluents of reactors R1 and R2) and the frequencies of realization and sources of methodologies are presented in Table 2.
TABLE 2. Examinations and determinations, frequency and sources of the methodologies used. Examinations and Determinations in
Affluent and Effluents Frequency Reference Maximum, medium and minimum air
temperatures Daily Unesp, Jaboticabal - Agroclimatological Station pH Twice a week APHA, AWWA, WEF (2005)
Total and partial alkalinity Twice a week APHA, AWWA, WEF (2005) Total volatile acids Twice a week DILALLO & ALBERTSON (1961)
Total suspended solids (TSS) Twice a week APHA, AWWA, WEF (2005) Chemical oxygen demand (CODtotal);
COD of the dissolved fraction (CODdiss.)
Twice a week
APHA, AWWA, WEF (2005); SANTANA & OLIVEIRA (2005) (digestion with closed reflux and colorimetric method).
Biogas
Production Daily OLIVEIRA (1997) (gasometers)
Composition Weekly APHA, AWWA, WEF (2005) (gas chromatography)
The sampling for the determination of the analytical parameters of the affluent and effluents of the reactors R1 and R2, was performed between 7h30 and 13h30, each hour, with simple samples of 400 mL, forming composed samples with sufficient volume to conduct all analyzes .
For the starting of the treatment system, in the R1 and R2, it was kept the sludge already adapted to the treatment of swine culture residual water, from the research study of RAMIRES (2005), discarding only the surplus to maintain 30% of the volume of each reactor filled with sludge. At the beginning of the subsequent tests, the excess sludge was discarded, remaining 30% of the volume of the reactors R1 and R2 filled with sludge.
It was performed statistical analysis of the values obtained by the F and Tukey tests, considering the completely randomized delineation, with five treatments (OLR of 5.5; 10.4; 20.7; 5.6 and 40.1 h ) and different number of repetitions. The repetitions were taken from the samples during the tests, considering the stability conditions of the reactors. The reactors were considered stable when the values of coefficients of variation (CV) of the CODtotal and suspended solids (SS)
RESULTS AND DISCUSSION
Figure 2 shows the averages of each period (tests 1; 2; 3; 4 and 5) to the average daily air temperature. It can be observed that the reactors were operated predominantly in the mesophilic range throughout the period. The highest average daily temperatures (p<0.05), which resulted in averages of 24 to 25 °C for periods, occurred in tests 2; 3 and 4. In tests 1 and 5 were the lowest observed average daily air temperatures of 22.3 and 22.7 ºC (averages for periods), values that differed from the others at 5% level of significance by the Tukey test.
The averages of daily thermal amplitudes (Figure 2) were 14.2o; 12.4o; 11.3o; 11.2o and 11.9 ºC in the tests 1; 2; 3; 4 and 5, respectively. In tests 3; 4 and 5 did not differ significantly (p<0.05 and C.V. of 25.9%), but were lower (p<0.05) than in trial 1, in which the highest average amplitude value may have disadvantaged the good performance of this test system.
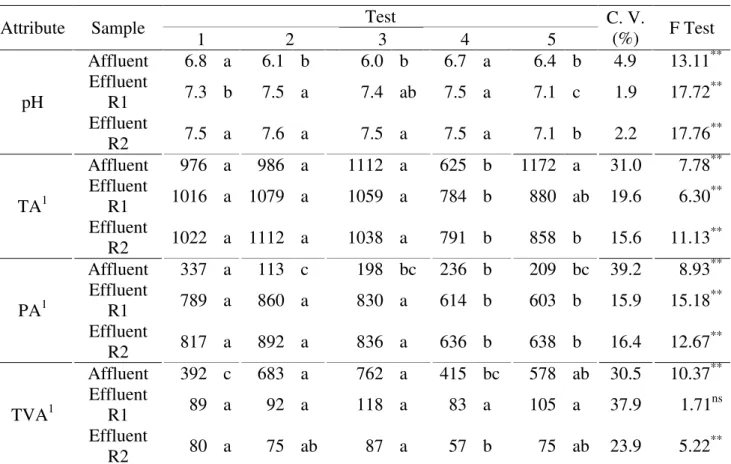
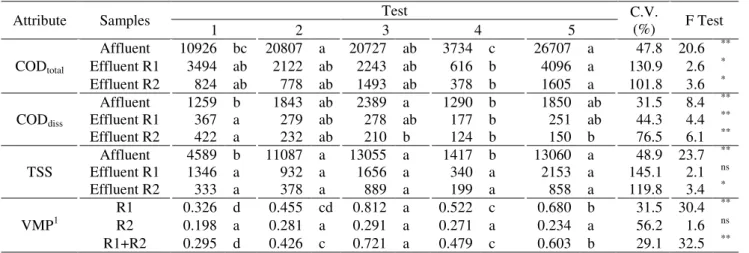
Tables 3 and 4 shows the data of average values of all tests and determinations measured during the operation of the treatment system. The removal efficiencies are shown in Figures 3; 4 and 5.
FIGURE 2. Average daily air temperature - average values for each period (numbers above the bar followed by the same letter do not differ by the Tukey test at 5% probability), and representation of the temperature amplitude for each test.
In all tests, the pH of the effluents was stable in the range of 7.1 to 7.6 (Table 3) and these values are within the recommended to occur the methanogenesis, as cited by CHERNICHARO (2007). These average values were higher than those observed for the affluent, indicating consumption of volatile acids and generation of alkalinity. The lowest average value of pH, of 7.1, for the effluents of R1 and R2 reactors was observed in test 5, differing significantly from the others (p<0.05).
With the exception of the third and fifth tests, it was found higher average values of total alkalinity (TA) for effluents than for affluent, showing that the generation of alkalinity is responsible for process plugging and stability. Possibly, the largest OLR applied in tests 3 and 5, resulted in a higher consumption of generated alkalinity, from those on other tests, resulting in decreased values of TA at the end of the process.
effluents (Table 3). These differ significantly from those observed in other tests (p<0.05), indicating lower plugging capacity of the pH in case of load imbalances and shocks.
TABLE 3. Average values of pH, total alkalinity (TA), partial alkalinity (PA) and total volatile acids (TVA) in the affluent and effluents from reactors R1 and R2, obtained during the operation of anaerobic treatment system in two stages in the tests 1 to 5.
Attribute Sample Test C. V. (%) F Test
1 2 3 4 5
pH
Affluent 6.8 a 6.1 b 6.0 b 6.7 a 6.4 b 4.9 13.11** Effluent
R1 7.3 b 7.5 a 7.4 ab 7.5 a 7.1 c 1.9 17.72** Effluent
R2 7.5 a 7.6 a 7.5 a 7.5 a 7.1 b 2.2 17.76**
TA1
Affluent 976 a 986 a 1112 a 625 b 1172 a 31.0 7.78** Effluent
R1 1016 a 1079 a 1059 a 784 b 880 ab 19.6 6.30** Effluent
R2 1022 a 1112 a 1038 a 791 b 858 b 15.6 11.13
**
PA1
Affluent 337 a 113 c 198 bc 236 b 209 bc 39.2 8.93** Effluent
R1 789 a 860 a 830 a 614 b 603 b 15.9 15.18** Effluent
R2 817 a 892 a 836 a 636 b 638 b 16.4 12.67**
TVA1
Affluent 392 c 683 a 762 a 415 bc 578 ab 30.5 10.37** Effluent
R1 89 a 92 a 118 a 83 a 105 a 37.9 1.71
ns
Effluent
R2 80 a 75 ab 87 a 57 b 75 ab 23.9 5.22**
For different small letters on the same line, the averages differ by the Tukey test, at 5% probability. ** significative at 1% of probability; * significative at 5% de probability; ns - non significative; C.V. - coefficient of variation;
1Unities - TA and PA - mg CaCO
3 L-1; TVA - mg CH3COOH L-1.
The average values of volatile acids (TVA) in the affluent ranged from 392 to 762 mg CH3COOH L-1 (Table 3). These values decreased to the range of 83 to 118 mg CH3COOH L-1 after
the reactor R1, indicating TVA consumption during the process. The values for this parameter do not differ statistically in the effluent of R1. After the second reactor, the concentration of acid decreased to values of 57 to 87 mg CH3COOH L-1. Thus, concentrations of TVA in the effluent
remained below the 200 mg L-1 recommended by LETTINGA & HULSHOFF-POL (1991) to operate with stability the UASB reactor treating domestic sewage. Thus, even with the application of OLR of 40.1 kg CODtotal (m3 d)-1 in test 5, the concentrations of volatile acids in the reactors R1
and R2 remained at stable conditions.
The average values of concentration of total suspended solids (TSS) and total chemical oxygen demand (CODtotal) of the affluent ranged from 1,417 to 13,060 mg L-1 and from 3,734 to
TABLE 4. Average values for the total chemical oxygen demand (CODtotal) and dissolved chemical
oxygen demand (CODdiss), and total suspended solids (TSS) in the affluent and
effluents, and volumetric methane production (VMP) in the reactors R1 and R2 obtained during the operation of anaerobic treatment system in two stages in the tests 1 to 5.
Attribute Samples Test C.V. (%) F Test
1 2 3 4 5
CODtotal
Affluent 10926 bc 20807 a 20727 ab 3734 c 26707 a 47.8 20.6 **
Effluent R1 3494 ab 2122 ab 2243 ab 616 b 4096 a 130.9 2.6 *
Effluent R2 824 ab 778 ab 1493 ab 378 b 1605 a 101.8 3.6 *
CODdiss
Affluent 1259 b 1843 ab 2389 a 1290 b 1850 ab 31.5 8.4 **
Effluent R1 367 a 279 ab 278 ab 177 b 251 ab 44.3 4.4 **
Effluent R2 422 a 232 ab 210 b 124 b 150 b 76.5 6.1 **
TSS Affluent 4589 b 11087 a 13055 a 1417 b 13060 a 48.9 23.7
**
Effluent R1 1346 a 932 a 1656 a 340 a 2153 a 145.1 2.1 ns
Effluent R2 333 a 378 a 889 a 199 a 858 a 119.8 3.4 *
VMP1 R1 0.326 d 0.455 cd 0.812 a 0.522 c 0.680 b 31.5 30.4
**
R2 0.198 a 0.281 a 0.291 a 0.271 a 0.234 a 56.2 1.6 ns
R1+R2 0.295 d 0.426 c 0.721 a 0.479 c 0.603 b 29.1 32.5 **
For different small letters on the same line, the average differs by the Tukey test, at 5% of probability. ** Significative at 1% of probability; * significative at 5% of probability; ns - non significative.
1Unities: COD and TSS - mg L-1; VMP - m3CH
4(m3reactor d)-1 at CNTP (1 atm e 0 oC).
It was observed high values of coefficient of variation (C.V.) for the average CODtotal and
TSS because of alterations in the composition of the effluent by variations in age and handling of animals. Despite this variability, the anaerobic treatment system in two stages maintained high removal efficiencies, showing its robustness in situations that are very close to the conditions existing on properties with pig culture.
The average values of CODtotal in the system output ranged from 378 to 1,605 mg L-1 and
occurred on tests 4 and 5, respectively. These values differ significantly (p<0.05). Considering the discharge standards in the Brazilian States, cited by VON SPERLING (2005), with the least restrictive of 200 mg L-1 for CODtotal, the observed values revealed the need for post-treatment of
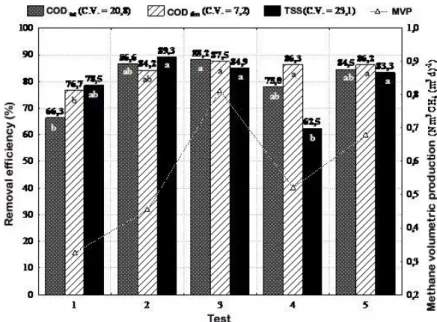
effluents before being discharged into bodies of water, even for tests with better performance. Figures 3, 4 and 5 show the average values of the five test performances, in relation to CODtotal and CODdiss .The CODtotal removal efficiencies were observed in 66.3; 86.6; 88.2; 78.0 and
84.5% in R1, and 89.9; 95.5; 92.5; 85.5 and 93.4% in the anaerobic treatment system in two stages (R1 + R2), for the tests 1; 2; 3; 4 and 5, respectively.
In tests 1 and 4, the average values of CODtotal removal efficiency were 66.3 and 78.0% in the
reactor R1, with OLR of 5.5 to 5.6 kg CODtotal (m3 d)-1, respectively, and did not differ significantly
(p>0.05). They were similar to those obtained by SONG et al. (2010), of 74.0 to 78.7% in the UASB reactor operated at 35 oC with OLR ranging from 1.3 to 5.8 kg CODtotal (m3 d)-1 and HRT
from 3.5 to 7.0 d, fed with swine culture residual water with COD concentration ranging from 7,300 to 30,900 mg L-1.
With reduction of the HRT from 24 to 16 h, in tests 3 and 5, and about 100% of increase in OLR applied in R1 (40.1kg CODtotal (m3 d)-1), the CODtotal, CODdiss and TSS removal efficiencies
were from 88.2% to 84.5%, from 87.5% to 86.2% and from 84.9% to 83.3%, respectively. The statistical analysis showed that the values obtained in the fifth test did not differ significantly from those obtained in test 3.
For the R2, with reduction of the HRT from 5.0 to 3.3 h, and an increase of the OLR from 10.8 to 29.7 kg CODtotal (m3 d)-1 in the tests 3 and 5, the CODtotal removal efficiencies were 36.1
and 50.3%, of CODdiss were 30.0 and 40.8% and of TSS were 40.5 and 53.3%, respectively, but no
For the HRT of 16 hours in R1, during tests 4 and 5, even with the increase of seven times in OLR, from 5.6 to 40.1kg CODtotal (m3 d)-1, respectively, it was observed an increase in the TSS
efficiency removal of 62.5 to 83.3%, differing significantly from each other (p<0.05). For the CODdiss it was observed removal efficiencies similar to 86.3 and 86.2% in tests 4 and 5.
FIGURE 3. Average values and coefficient of variation (C.V.) of the average removal efficiencies of CODtotal, CODdiss, total suspended solids (TSS) and methane volumetric production
(MVP) in the UASB reactor R1 in the tests 1 to 5. For the same attribute, between tests, numbers above the bar followed by different small letters indicate that the averages differ by the Tukey test at 5% probability.
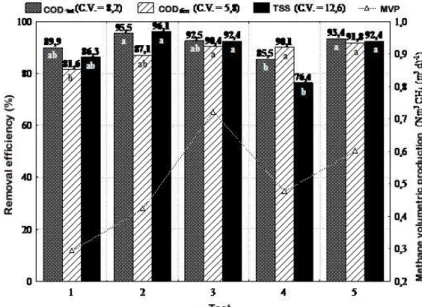
For the treatment system (R1 + R2), with HRT of 19.3 h, in the tests 4 and 5 the CODtotal
removal efficiency increased significantly (p<0.05) from 85.5 to 93.4% respectively, even with the increase of seven times in the OLR, reaching 40.1 kg CODtotal (m3 d)-1 in R1. This can be explained
by the increase of physical removal of particulate organic matter, of CODdiss, with the decrease of
the average air temperature during the test 5 (Figure 2).
FIGURE 4. Average values and coefficient of variation (C.V.) for removal efficiencies of CODtotal,
CODdiss,total suspended solids (TSS) and methane volumetric production (MVP) in the
In all tests, it was observed that there was significant variation in the CODtotal of the affluent,
which were attenuated in R2. Therefore, allowing to obtain high values of CODtotal removal
efficiency (predominantly above 90.0%) for the anaerobic treatment system in two stages (R1 + R2), with C.V. values below 15.0%. Similar behavior was observed for dissolved COD, except in tests 1 and 2.
Although in R2 it was observed the lowest efficiency removal of COD, there was a contribution to the maintenance of the system removal efficiency (R1 + R2). The contribution of the second reactor was mainly due to the accommodation of overloads and attenuation of entrainment of sludge of the first reactor, as also observed by OLIVEIRA (2001) and SANTANA & OLIVEIRA (2005).
FIGURE 5. Average values and coefficient of variation (C.V.) for removal efficiencies of CODtotal,
CODdiss, total suspended solids (TSS) and methane volumetric production (MVP) in
the anaerobic treatment system in two stages (R1 + R2) in the tests 1 to 5. For the same attribute, between tests, numbers above the bar followed by different small letters indicate that the averages differ by the Tukey test at 5% of probability.
For the anaerobic treatment system in two stages (R1 + R2) with HRT of 58 h and a significant increase (p<0.05) of the average concentration of TSS from 4,589 to 11,087 mg L-1, in tests 1 and 2, the removal efficiencies of TSS were 86.3 and 96.1%, respectively, although not differing statistically. These results can be attributed to higher (p<0.05) values of average daily air temperature occurred during test 2 (Figure 2), providing higher hydrolytic activity of microbes and thus the removal of volatile suspended solids.
For HRT of 19.3 h in the treatment system (R1 + R2), in tests 4 and 5 it was observed a significantly increase (p<0.05) in the TSS removal efficiency of 76.4 to 92.4%, respectively. This, as already stated, can be explained by the increase of the physical removal of particulate organic matter, with the significant decrease (p<0.05) of the average daily air temperature in the test 5 (Figure 2).
The average results and coefficient of variation (C.V.) of the methane volumetric production (MVP) in R1, R2 and the treatment system (R1 + R2) obtained during tests 1; 2; 3; 4 and 5 of the experiment are presented in Table 4 and Figures 3; 4 and 5.
The higher methane volumetric production (MVP), of 0.812 Nm3 CH4 (m3 d)-1 in R1,
occurred with HRT of 24 h and OLR of 20.7 kg CODtotal (m3 d)-1 in phase 3, differing significantly
(p<0.05) from the values observed in the other studies (Table 4). Until the fourth test, the MVP varied proportionally to the Organic Loading Rate of applied CODdiss; however, in test 5, even with
This may be attributed to the lower methanogenic activity as a result of lower temperatures observed in this period, and also to the high OLR the reactors R1 and R2 were submitted.
The same anaerobic treatment system in two stages with UASB reactors was operated by SANTANA & OLIVEIRA (2005), treating swine culture residual water, with HRT of 31.1 and 62.3 h in R1, and they recorded the highest value of MVP of 1,130 Nm3 CH4 (m3 d)-1 to 31.1 h,
which coincided with the higher Organic Loading Rate of CODdiss.
ABREU NETO & OLIVEIRA (2009), using anaerobic treatment system in two stages with compartment reactor followed by UASB reactor in the second stage, observed MVP maximum of 0.227 m3 CH4 (m3 d)-1 in the UASB reactor with OLR of 10.6 kg CODtotal (m3 d)-1 and HRT of
5.4 h, treating swine culture residual water. In this study, in test 3, with HRT of 5.0 h and OLR of 10.8kg CODtotal (m3 d)-1, the MVP in R2 was similar to 0.291 Nm3 CH4 (m3 d) -1.
CONCLUSIONS
Under the conditions studied, the UASB reactor (R1):
With OLR around 5kg CODtotal (m3 d)-1, the decrease in HRT from 48 to 16 h caused no
reduction in CODtotal and TSS removal efficiencies, increased the removal of CODdiss and
consequently, the production of methane;
- With the increase of OLR, ranging from 5 to 40 kg CODtotal (m3 d)-1, there were not
decreases in removal efficiencies of COD and TSS, and methane production increased;
- The smallest average temperatures (near 20 °C) resulted in reduced production of methane when it was applied to higher OLR of 40.1 kg COD (m3 d)-1, but promoted physical removal of suspended solids, disallowing the reduction of the removal efficiencies of COD and TSS.
In anaerobic treatment system in two stages, with the UASB reactors (R1 + R2):
- The applied OLR were not limiting to obtain high efficiency removal of COD and TSS predominantly above 90%;
- Even for HRT of 19.3 h, with the highest OLR applied, the high removal efficiencies of COD and TSS were kept similar to those of larger HRT, of 57.9 and 29.0 h. This indicates that the use of UASB reactors in two stages in treating swine culture residual water can be viable with high OLR and low HRT. However, for the HRT of 19.3 h there was a reduction in plugging capacity, making the system more susceptible to load shocks;
- The inclusion of the UASB reactor of the second stage (R2) contributed to the increase in the removal efficiencies of CODtotal, CODdiss. and TSS, especially when the treatment system was
submitted to the smaller HRT and larger OLR;
- With HRT of 19.3 and 29.0 h, the methane production and the removal efficiencies of COD and TSS were higher or similar to those obtained in the UASB reactor (R1) with HRT of 48 h, indicating that the system in two stages can be reduced to less than half the required volume of reactor.
ACKNOWLEDGMENT
To the FAPESP and CAPES, for financial support.
REFERENCES
ABREU NETO, M. S.; OLIVEIRA, R. A. de. Remoção de matéria orgânica, de nutrientes e de coliformes no processo anaeróbio em dois estágios (reator compartimentado seguido de reator UASB) para o tratamento de águas residuárias de suinocultura. Engenharia Agrícola, Jaboticabal,
APHA; AWWA; WEF. Standard methods for the examination of water and wastewater. 21th ed.
Washington, 2005.
CAMPOS, C. M. M.; DAMASCENO, L. H. S.; MOCHIZUKI, E. T.; BOTELHO, C. G. Avaliação do desempenho do reator anaeróbio de manta de lodo (UASB) em escala laboratorial na remoção da carga orgânica de águas residuárias da suinocultura. Ciência e Agrotecnologia, Lavras, v.29, n.2,
p.390-399, mar./abr.2005.
CHERNICHARO, C. A. L. de. Reatores anaeróbios: princípios do tratamento biológico de águas
residuárias. 2.ed. Belo Horizonte: Departamento de Engenharia Sanitária e Ambiental, UFMG,
2007. 380 p.
DILALLO, R.; ALBERTSON, O. E. Volatile acids by direct titration. Journal Water Pollution Control Federation, Alexandria, v.33, n.4, p.356-365, abril 1961.
FAO. Food and Agriculture Organization of the United Nations. FAO Statistical Yearbook 2009.
Disponível em: < http://www.fao.org/economic/ess/publications-studies/statistical-yearbook/fao-statistical-yearbook-2009/d-consumption/en/ >. Acesso em: 28 set. 2010.
FERNANDES, G. F. R.; OLIVEIRA, R. A. de. Desempenho de processo anaeróbio em dois
estágios (reator compartimentado seguido de reator UASB) para tratamento de águas residuárias de suinocultura. Engenharia Agrícola, Jaboticabal, v.26, n.1, p.243-256, jan./abr. 2006.
LETTINGA, G.; HULSHOFF POL, L. W. Uasb - process design for various types of wastewaters.
Water Science and Technology, Kidlington, v.24, n.8, p.87-107, 1991.
MIRANDA, C. R. de. Aspectos ambientais da suinocultura brasileira. In: SEGANFREDO, M. A. (Ed.). Gestão ambiental na suinocultura. Brasília: Embrapa Informação Tecnológica, 2007. cap. 1,
p.13-36.
OLIVEIRA, R. A. de. Efeito da carga hidráulica volumétrica, da temperatura climatológica e do descarte do excesso de lodo da manta no desempenho de reatores UASB tratando águas
residuárias de suinocultura. Jaboticabal: FCAV, UNESP, 2001. 125 p. (Relatório final de pesquisa
CPA/UNESP).
OLIVEIRA, R. A. de. Efeito da concentração de sólidos suspensos do afluente no desempenho e características do lodo de reatores anaeróbios de fluxo ascendente com manta de lodo tratando águas residuárias de suinocultura. 1997. 359 f. Tese (Doutorado em Hidráulica e Saneamento) -
Escola de Engenharia, Universidade de São Paulo, São Carlos, 1997.
PERDOMO, C. C.; LIMA, G. J. M. M. Considerações sobre a questão dos dejetos e o meio ambiente. In: SOBESTIANSKY, J. ; WENTZ, I.; SILVEIRA, P. R. S.; SESTI, L. Suinocultura intensiva: produção, manejo e saúde do rebanho. Brasília: Embrapa, 1998. cap. 11, p.221-235.
RAMIRES, R. D. A. Produção de metano e remoção de matéria orgânica, nutrientes e microrganismos patogênicos em reatores anaeróbios de fluxo ascendente com manta de lodo (UASB) em dois estágios tratando águas residuárias de suinocultura. 2005. 136 f. Dissertação
(Mestrado em Microbiologia Agropecuária) - Faculdade de Ciências Agrárias e Veterinárias, Universidade Estadual Paulista, Jaboticabal, 2005.
RODRIGUES, L. S.; SILVA, I. J.; ZOCRATO, M. C. de O.; PAPA, D. N.; SPERLING, M. V.; OLIVEIRA, P. R. Avaliação de desempenho de reator UASB no tratamento de águas residuárias de suinocultura. Revista Brasileira de Engenharia Agrícola e Ambiental, Campina Grande, v.14, n.1,
p.94-100, 2010.
SANTANA, A. M. de; OLIVEIRA, R. A. de. Desempenho de reatores anaeróbios de fluxo ascendente com manta de lodo em dois estágios tratando águas residuárias de suinocultura.
SEGHEZZO, L.; GRIETJE, Z.; LIER, J. B. Van; HAMELERS, H. V. M.; LETTINGA, G. A review: the anaerobic treatment of sewage in UASB and EGSB reactors. Bioresource Technology,
Kiddlington, v.65, p.175-190, 1998.
SILVA, G. H. R.; NOUR, E. A. A. Reator compartimentado anaeróbio/aeróbio: sistema de baixo custo para tratamento de esgotos de pequenas comunidades. Revista Brasileira de Engenharia Agrícola e Ambiental, Campina Grande, v.9, n.2, p.268-275, 2005.
SONG, M.; GU SHIN, S.; HWANG, S. Methanogenic population dynamics assessed by real-time quantitative PCR in sludge granule in upflow anaerobic sludge blanked treating swine wastewater.
Bioresource Technology, Essex, v.101, p.S23-S28, 2010.
TREVISAN, V.; MONTEGGIA, L. O. Produção de biogás a partir de efluente da suinocultura utilizando digestão anaeróbia em dois estágios. In: SIMPOSIO INTERNACIONAL SOBRE GERENCIAMENTO DE RESÍDUOS DE ANIMAIS, 1., 2009, Florianópolis. Anais... Concórdia:
Embrapa Suínos e Aves, 2009. p.264-268.
VON SPERLING, M. Legislação ambiental e impacto do lançamento de efluentes nos corpos receptores. In: VON SPERLING, M. Introdução à qualidade das águas e ao tratamento de esgotos.
