Evaluation of soluble microbial products and aromatic amines
accumulation during a combined anaerobic/aerobic treatment
of a model azo dye
B.E.L. Baêta
a, D.R.S. Lima
b, S.Q. Silva
c, S.F. Aquino
a,⇑ aChemistry Department, Federal University of Ouro Preto, Ouro Preto, Brazil b
Post-Graduate Programme in Environmental Engineering, Federal University of Ouro Preto, Ouro Preto, Brazil cBiological Sciences Department, Federal University of Ouro Preto, Ouro Preto, Brazil
h i g h l i g h t s
Anaerobic–aerobic combined system was efficient in removing aromatic amines, VFA, SMP and color from azo dye effluents. PAC played a key role in reducing SMP accumulation in anaerobic environment.
Yeast extract, a cheap source of redox mediators, enhance color removal in the anaerobic reactor.
The aerobic post-treatment unit completely removed the aromatic amines and VFA from the anaerobic effluent.
a r t i c l e
i n f o
Article history:
Received 20 March 2014
Received in revised form 14 August 2014 Accepted 17 August 2014
Available online 27 August 2014
Keywords:
Azo dye degradation Anaerobic digestion Soluble microbial products Powdered activated carbon
a b s t r a c t
The current work have investigated the accumulation of soluble microbial products (SMP) and aromatic amines in anaerobic reactors followed by aerobic reactors (Ar1 or Ar2) during the azo dye Remazol Golden Yellow RNL (RGYRNL) degradation. One anaerobic reactor (An2) contained powdered activated carbon (PAC) in its interior, while another one (An1) was used as control. The results have shown the effi-ciency of COD and color removal in the combined system An1/Ar1 was higher than 70%, while in the An2/ Ar2 system the COD and color removal was above 85% and 90%, respectively, in all three operational phases. The aerobic reactors were capable of removing most of the residual organic matter, volatile fatty acid (VFA) and aromatic amines, generated during the anaerobic step, and the presence of PAC inside reactor An2 ensured higher operational stability since it minimized the toxic effects caused by anaerobic degradation byproducts. The presence of PAC contributed to reduce SMP accumulation in phases 2 (CODSMP= 32.40 mg/L) and 3 (CODSMP= 21.61 mg/L) and enhanced the effluent quality.
Ó2014 Elsevier B.V. All rights reserved.
1. Introduction
Nowadays, azo dyes represent the larger class of synthetic dyes produced worldwide (about 70%) and its high production might be associated with its use by different industrial sectors such as tex-tile, food, paper and cosmetics[1]. The discharge of colorful efflu-ents in the environment, even those containing low concentration of soluble dyes, is not just an aesthetic issue, but also an environ-mental trouble.
The discharge of colorful wastewater negatively impacts aqua-tic eco-systems, worsens water quality and inhibits aquaaqua-tic photo-synthesis. Such troubles are related to the depletion of dissolved
oxygen, pH changes, and incorporation of recalcitrant substances in the environment. Some studies have also pointed out that azo dyes and their byproducts (aromatic amines) can be carcinogen and mutagen to many species[2].
In view of the complexity of effluents that contain azo dyes, dif-ferent kinds of treatment have been used, such as (electro) coagu-lation/flocculation [3,4] and advanced oxidation [5], including photocatalysis [6]. The main disadvantage of these technologies is their high cost, in addition to the fact they demand a greater amount of energy[7]. In some cases, such treatments can generate toxic byproducts that are not easily disposed of[8]. Due to such reasons, some authors state that biological processes are the most economically feasible technology to efficiently degrade industrial organic compounds such as the azo dyes and their byproducts
[9–12].
http://dx.doi.org/10.1016/j.cej.2014.08.050
1385-8947/Ó2014 Elsevier B.V. All rights reserved.
⇑Corresponding author. Tel.: +55 (031) 3559 1229.
E-mail address:sergio@iceb.ufop.br(S.F. Aquino).
Contents lists available atScienceDirect
Chemical Engineering Journal
Amidst the biological processes, the conventional activated sludge system is widely used to treat textile wastewaters. Despite being very efficient in removing the organic load it exhibits rela-tively low discoloration rates. Such obstacle is explained by the fact dissolved oxygen is a preferred electron acceptor when compared to azo dyes[13]. On the other hand, azo dye discoloration is more easily achieved in anaerobic systems which promote its reductive degradation. Nonetheless, when effluents contain other electron acceptors with higher reductive potentials, such as sulfates (SO42), nitrates (NO3) and nitrites (NO2), the azo dye anaerobic degradation can be hampered[14].
According to some authors, biological azo dye degradation hap-pens in two stages[15]. The first step is the reductive cleavage of the azo bond (AN@NA), which normally leads to color reduction;
and the subsequent degradation of the produced aromatic amines, which is more easily accomplished in aerobic environments. Therefore, an inconvenient caused by azo dye reductive degrada-tion in anaerobic reactors is the accumuladegrada-tion of recalcitrant byproducts. In many cases these compounds exhibit certain toxic-ity to the anaerobic microbial consortium, thus leading to opera-tional limitations in such systems[16]. In face of the limitations observed in both aerobic (low color removal) and anaerobic (diffi-culty in aromatic amines mineralization) reactors, many authors suggest that a feasible alternative to the treatment of colorful efflu-ents containing different types of azo dyes is the combination of both processes[16–18].
Due to the aforementioned, the current work aimed to evaluate the performance of an anaerobic/aerobic treatment system com-prised of anaerobic reactors (with and without powdered activated carbon [PAC] in its interior) followed by aerobic reactors. The treat-ment system was fed with a model azo dye (Remazol Golden Yellow RNL – RGY-RNL) solution. Particularly, this study focused
on the accumulation of soluble microbial products (SMP) and other byproducts (aromatic amines and VFA) in the combined treatment system.
2. Materials and methods
2.1. Reactors configuration
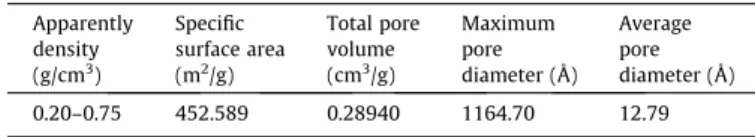
The study was performed using two batch anaerobic reactors named An1 (Control, without PAC) and An2 (Operated with 4 g/L of PAC in its interior added only once during all operational phases). The PAC used inside the An2 reactor originated from pines wood and was manufactured byCarbon SolutionÒ
and some charac-teristics can be seen inTable 1.
Both anaerobic reactors (An1 and An2) were built out of pipe joints and polyvinyl chloride connections (PVC), so that both had the same working volume of 3.25 L. As it can be seen inFig. 1, efflu-ents from An1 and An2 were submitted to aerobic post-treatment in the reactors Ar1 and Ar2. Such reactors were built out of glass, and had a working volume of 3.5 L. The mixture and the aeration in reactors Ar1 and Ar2 were ensured by compressed air pumps. The effluents of reactors Ar1 and Ar2 flowed to the settler units (Fig. 1) that were also built out of PVC and had a working volume of 3.5 L.
2.2. Operational conditions
Throughout the three operational phases the An1/Ar1 and An2/ Ar2 systems were fed with a dye solution containing micro and macro nutrients. Micro and macro nutrient concentrations were defined in order to maintain the proportion of COD:N:P close to that considered as ideal (350:5:1) to anaerobic process[19].Table 2
shows the composition of the feeding solution used in each opera-tional phase.
An1/Ar1 and An2/Ar2 bench reactors were simultaneously fed under the same operational conditions during all three operational phases. Anaerobic reactors (An1 and An2) operated with a hydrau-lic retention time (HRT) of 24 h and controlled temperature of 35°C. The pH inside these reactors was kept between 6.5 and 7.5
by adding Na2CO3 0.1 M buffer solution. On the other hand, the aerobic reactors (Ar1 and Ar2) operated with an HRT of approxi-mately 28 h, at room temperature, pH between 6.8 and 7.2; and
Table 1
Characteristics of the powdered activated carbon (PAC). Apparently
density (g/cm3)
Specific surface area (m2/g)
Total pore volume (cm3/g)
Maximum pore diameter (Å)
Average pore diameter (Å) 0.20–0.75 452.589 0.28940 1164.70 12.79 Raw material: wood ofPinusspp.
Fig. 1.Schematic of the bench scale combined anaerobic–aerobic (An–Ar) treatment system.
dissolved oxygen concentration (DO) between 2.0 and 3.5 mg/L. The difference between Ar1 and Ar2 are the fact that Ar2 receives an effluent from an anaerobic reactor (An2) that contains PAC inside it.
During the operation of An/Ar systems, it was used a secondary settler (Fig. 1) in order to separate the biologically active biomass fraction coming from the aerobic reactor. Such biomass was re-circulated from the bottom of the secondary settler into the aerobic reactors. Some fundamental parameters regarding the aerobic reactors functioning – calculated according to mean values observed in each operational phase – are presented inTable 3.
An1 and An2 reactors were incubated with 0.8 L of anaerobic sludge having a volatile suspended solids (VSS) concentration of approximately 10 g/L. On the other hand, the Ar1 and Ar2 reactors were incubated with 1.5 L of activated sludge with volatile sus-pended solids (VSS) concentration of 8 g/L. The anaerobic and aerobic sludge were taken from UASB reactors and activated sludge systems, respectively, operated at demo (UASB) or full scale (acti-vated sludge) and fed with raw sewage.
2.3. Analytical methods
Color removal and degradation of Remazol Golden Yellow RNL were monitored in the wavelength of higher dye absorption (kmax= 410 nm) in a HP 8453 UV–visible spectrophotometer, by means of an external calibration curve made with the model azo dye. COD measurements were performed according to the closed reflux colorimetric method, as described in the Standard Methods for the Examination of Water and Wastewater (APHA, 2010). All samples were previously centrifuged at 3.600 rpm for 20 min (Fanem Excelsa II 206 BL) in order to remove suspended solids. Thus, all data presented here were obtained with the supernatant of the centrifuged samples.
The analysis of seven (formic, acetic, propionic, butyric, isobu-tyric, valeric, isovaleric) volatile fatty acids (VFA) was accom-plished by using a high performance liquid chromatography
(HPLC) system equipped with a diode array detector and setting the wavelength (k) at 210 nm. The chromatographic separation was performed in an Aminex HPX-874 (Bio-RadÒ
) ion exchange column at 55°C, using a 0.01 M sulfuric acid solution as mobile
phase under isocratic flow of 0.6 mL/min and the volume injected in the HPLC was 10
l
L. Samples were previously filtered in cellu-lose acetate membranes (0.45l
m) and the method was properly validated by Mesquita[21]. VFA concentrations were used to esti-mate their contribution to the dissolved COD according to Eq.(1):CODðVFAÞ¼0:35 ½formate þ1:07 ½acetate þ1:51
½propionate þ1:82 ½butyrateþisoutyrate
þ2:04 ½valerateþisovalerate ð1Þ
The identification and quantification of aromatic amines formed during anaerobic azo dye degradation in samples from inside the An1 and An2 reactors, as well as in anaerobic and aerobic effluents, were done according to the same methodology applied to VFA identification. According to Pinheiro et al.[22]the degradation of azo dyes containing sulfonic acid groups, such as the model dye used in this study, generates as byproducts aromatic amines with sulfonic groups, such as the sulfanilic acid – which exhibits high absorption at 197 nm. Thereby, the concentration of sulfanilic acid was estimated by external calibration using sulfanilic acid stan-dards (0.5 up to 30 mg/L), which yielded a calibration curve with good linear adjustment (R2= 0.997).
The assessment of soluble microbial products (CODSMP) accu-mulation inside the anaerobic (An1 and An2) and aerobic (Ar1 and Ar2) reactors was achieved by estimating the amount of COD due to volatile fatty acids, residual RGYRNL and its degradation byproducts (expressed as sulfanilic acid), according to Eq.(2):
CODSMP¼CODsolubleCODVFACODresidual azo dyeCODaromatic amines
ð2Þ
The CODresidual azo dyewas estimated only in phases 2 and 3, in which the reactors An1 and An2 were fed with the model azo dye. For this the median color removal efficiency observed in each reactor was calculated and the residual RGYRNL concentration was estimated by means of an external calibration curve. The reaction stoichiometry for complete oxidation of the azo dye (1.64 gCOD/ gRGYRNL) was then used to estimate the theoretical CODresidual azo dyein each phase.
In order to estimate the amount of CODaromatic aminesit was con-sidered that the amines generated by the reduction of the model azo dye were sulfanilic acid (SA) derivatives. Such consideration is supported by the observation that there were few peaks with retention times distinct from that of sulfanilic acid in the HPLC chromatograms. Therefore, in order to calculate the amount of CODaromatic aminesthe concentration of sulfanilic acid was initially determined and then the median concentration of such intermedi-ate was used to estimintermedi-ate its contribution to the soluble COD. This
Table 2
Composition of the feeding solution in different operational phases.
Phase Azo dyea(mg/L) Yeast extractb(mg/L) Glucosec(mg/L) COD influentd(mg/L) Comments
1 No No Yes (500) 509 Acclimation period
2 Yes (50) No Yes (500) 522 Azo dye degradation in the absence of redox mediator and with an extra source of carbon
3 Yes (50) Yes (500) No 544 Azo dye degradation in the presence of yeast extract, a cheap source of carbon and redox mediator
aThe model azo dye used was Remazol Golden Yellow RNL (RGYRNL). b Used as source of riboflavin, a soluble redox mediator.
c Used as source of carbon and energy. d Median value.
Table 3
Operational conditions observed in the aerobic reactors calculated according to mean values observed in each operational phase.
Reactors Parameters Phase 1 Phase 2 Phase 3 Ar1 Ra 0.82 0.96 0.89
MLVSSb(mg/L) 6300 7815 8875
RLVSSc(mg/L) 7640 8630 9527
Sludge aged(d) 3.84 4.53 5.03
Ar2 Ra 0.85 0.91 0.93 MLVSSb(mg/L) 6728 8215 9825
RLVSSc(mg/L) 7987 9376 10287
Sludge age (d) 4.23 4.75 5.18
aRecycle ratio.
b Mixed liquor volatile suspended solids. c Recirculation liquor volatile suspended solids. d Estimated as SA
¼ ðMLVSSVrÞ
was done by using the stoichiometric coefficient for sulfanilic acid complete oxidation (2.26 gCOD/g SA).
2.4. Statistical analysis
In order to verify whether the differences observed between the An1/Ar1 and An2/Ar2 were significant, statistical tests were employed by means of the software StatisticaÒ. The Shapiro–Wilk
test was used to confirm that the results did not follow a normal distribution, and then non-parametric tests (Kruskal–Wallis ANOVA, Student–Newman and Mann–Whitney) were applied. A p-value lower than 0.05 was adopted for rejecting the null hypoth-esis (Ho).
3. Results and discussion
3.1. COD removal in the combined treatment systems
Data of COD removal from the combined systems An1/Ar1 and An2/Ar2 are shown inFig. 2. It is possible to verify the efficiency values for organic matter removal in the anaerobic reactor An2 (operated with PAC within its interior) was higher in all opera-tional phases (53.3% in phase 1, 76.2% in phase 2 and 83.0% in phase 3), when compared to the values obtained in the control reactor An1 (52.3% in phase 1, 49.0% in phase 2 and 68.2 in phase 3), except in phase 1 when no statistical significant differences (p-value > 0.05) were observed. Such results evidence the contribu-tion of PAC in the removal of organic matter in anaerobic systems, as previously demonstrated[12].
Baêta et al.[12]employed membrane bioreactors to treat textile effluents and observed that the presence of PAC inside the anaero-bic reactor favored the adaptation of anaeroanaero-bic microorganisms, minimized stress factors and led to higher removal efficiencies. This is due to PAC’s capacity of adsorbing toxic components, such as aromatic amines or VFA, which thermodynamically limits the bacterial conversion of propionate, (iso)butyrate and (iso)valerate into acetate. According to Aquino and Chernicharo[23]the absence of stressing factors in anaerobic reactors results in lower accumu-lation of VFA and, consequently, in higher COD removal, due to the higher conversion of acetic acid into methane.
Fig. 2also shows that the aerobic reactors Ar1 and Ar2 removed the major part of the organic matter recalcitrant to anaerobic sys-tems, mainly – as it will be discussed later – the byproducts gener-ated from anaerobic degradation of model azo dye (aromatic
amines) and intermediate VFAs. The lower values of organic matter removal observed in phase 1 for both reactors, when compared to other phases, might be associated with biomass adaptation. How-ever, even with the observed lower values, it is possible to infer that the presence of PAC inside reactor An2, which precedes reac-tor Ar2, positively influenced aerobic biomass adaptation time, resulting in better performance of reactor Ar2.
Throughout phase 1 (without dye) it was observed a significant difference (p-value < 0.05) in the removal of COD between reactors Ar1 (38.3%) and Ar2 (71.2%), indicating that the microorganisms found in reactor Ar2 underwent better adaptation during acclima-tion phase. Such results also indicate that the use of PAC within the anaerobic reactor withheld toxic or recalcitrant compounds to aer-obic microorganisms.
During phase 2 there was an increase in the COD removal effi-ciency of 54.2% for Ar1 and 21.5% for Ar2. The lower increase observed for reactor Ar2 might be related to the reduced concen-tration of soluble COD flowing into the system, once the major part of soluble organic matter that should reach reactor Ar2 is removed in the An2 system, due to the effective action of PAC in promoting better microbial adaptation.
In phase 3 it was observed a decrease of approximately 32% in the efficiency of COD removal for reactor Ar1 and 15% for reactor Ar2 (in relation to phase 2), and such behavior can be explained by the presence of yeast extract. The greater complexity of the organic compounds found in the extract (e.g. proteins, lipoproteins, lipids), along with the stronger organic load applied to the system seemed to have led to higher residual COD residual from the anaer-obic reactors.
Nevertheless,Fig. 2shows that the aerobic reactors Ar1 and Ar2 significantly increased the total efficiency of COD removal in the system An1/Ar1 and An2/Ar2 in all operational phases. Such results were expected, once a higher amount of carbon is required by aer-obic microorganisms due their higher microbial growth rates.
Fig. 3shows the accumulation of VFA (expressed as COD) inside anaerobic reactors An1 and An2. The values of CODVFAin the aero-bic reactors were not shown because the VFA concentration was lower than the method’s limit of detection (LOD). Such results indi-cate that all residual soluble COD effluent from the aerobic phase is due to SMPs produced in anaerobe and aerobic reactors.
Fig. 3shows that the concentrations of CODVFA inside reactor An2 (with PAC) in all operational phases were statistically lower (p-value < 0.05) than the values found for reactor An1, indicating that inside An2 there was a significantly higher removal rate,
S
o
lub
le
C
OD
(m
g
/L
)
Phases
Effluent Ar1 Effluent An1
Influent
3 2 1 3 2 1 3 2 1
600
500
400
300
200
100
0
Phases
Effluent Ar2 Effluent An2
Influent
3 2 1 3 2 1 3 2 1
600
500
400
300
200
100
0
544 522 509
173 266 243
68
20 150
566 522
505
96 124 236
21 9 68
An1/Ar1 An2/Ar2
Fig. 2.Dissolved organic matter (soluble COD) in influent and effluent from An1/Ar1 (control) and An2/Ar2 (with PAC) combined treatment systems.
probably motivated by better adaptation and biomass growth conditions.
The best adaptation observed in the system comprising PAC, derives from its capacity to adsorb toxic substances (e.g. aromatic amines) and VFA. The adsorption of such compounds minimizes
the thermodynamic inhibition of some conversion routes (e.g. ace-tate to propionate), besides keeping a proper balance amongst aci-dogenesis and methanogenesis. Baêta et al.[24]showed that PAC had a great capacity to adsorb some intermediate VFA such as ace-tic (Qmax= 5.80 mg/g), butyric (Qmax= 5.19 mg/g) and propionic (Qmax= 0.096 mg/g) acids, which led to lower VFA accumulation and better submerged anaerobic membrane bioreactor performance.
Based on the values ofQmaxand Eq.(1)it was possible to esti-mate that the PAC added inside the reactor at the beginning of An2 operation would be able to retain approximately 67 mg/L of CODVFA. This corroborates the hypothesis that PAC might have played an important role in the reactor thermodynamics by mini-mizing VFA concentration in the supernatant and favoring the activity of acetogenic microorganisms.
Fig. 4shows that there was no trend in COD removal reduction throughout the operational time. For An2 (with PAC) the COD removal efficiency remained pretty stable along the operation, indicating that PAC’s adsorption sites were not saturated and, or that adsorption could not solely account for the COD removal.
Fig. 4data suggests that some adsorbed organics (e.g. dyes, aro-matic amines and VFA) were metabolized by anaerobic microor-ganisms, which would continually free PAC’s adsorption sites. It is not known whether microorganisms can uptake adsorbed mole-cules directly from the PAC surface or whether such molemole-cules are desorbed by equilibrium shift as their concentrations are reduced in the bulk phase.
3.2. Evaluation of CODSMPaccumulation in reactors An1 and An2
Figs. 5 and 6respectively show the mean concentration of SMP (as COD) and its normalized accumulation (CODSMP/gVSS) in both anaerobic reactors An1 (control) and An2 (with PAC) throughout different operational phases. It is possible to see that during phase 1, in which the reactors were fed with glucose as the only source of carbon and energy, the concentration of CODSMPinside reactor An1 and the ratio CODSMP/gVSS was lower when compared to reactor An2. Such results are similar to those found by other authors such as Aquino et al.[25]who have also observed a higher concentra-tion of CODSMPin an anaerobic reactor with submerged membrane (SAMBR) operated with PAC when compared with a SAMBR oper-ated without PAC.
CO DV F A (m g /L ) Phases An-2 An-1 3 2 1 3 2 1 300 250 200 150 100 50 0 109.00 212.9 218.6 59.8 73.5 85.5
Fig. 3.Changes in soluble CODVFAinside the anaerobic reactors.
0 20 40 60 80 100 120
40 50 60 70 80 90 CO D e ffic ie n c y r e m oval (% )
operational time (day)
An2 An1
Fig. 4.COD removal efficiency for An2 (with PAC) during the operational time.
C OD n o t vf a (m g /L ) COD 3 2 1 AA AD SM P AA AD SM P AA AD SM P 150 120 90 60 30 0 COD 3 2 1 AA AD SM P AA AD SM P AA AD SM P 150 120 90 60 30 0 0 0 24,4 1,2 19,7 32,3 6,9 11,5 45,6 0 0 150 2,4 15,7 32,4 6,4 8,2 21,6
A
B
According to such study, both reactors were fed with an easily degradable substrate and a possible explanation for the higher SMP accumulation inside the reactor with PAC is related to the
adsorbent’s capability of acting as a means of support to microbial growth. The hypothesis here is that attached microbial growth would imply in the release of extracellular polymeric substances (EPS) which leads to the generation of SMP via its hydrolysis, thus contributing to the increase of soluble COD[26].
Another explanation for the higher CODSMPaccumulation in the reactor with PAC (An2) during phase 1 is the greater amount of biomass inside it. According toFig. 7, the VSS mass inside the reac-tor An2 (with PAC) was approximately 33% larger than that observed inside the reactor An1 (without PAC). Additionally, Akram and Stuckey [27] observed a higher concentration of CODSMP in a SAMBR reactor operated with higher amounts of PAC (3.4 g/L) and VSS (16.116 mg/L) and verified there was a straight relationship between the amount of SMP and the concen-tration of PAC and VSS.
The behavior of SMP accumulation (Fig. 5) in the anaerobic reactors during phase 2 shows that in the presence of PAC (An2) the CODSMPconsiderably decreased from phase 1 to phase 2, reach-ing a median concentration of 32.4 mg/L. On the other hand in the reactor without PAC (An1) the concentration of CODSMPincreased from phase 1 to phase 2, reaching the median value of 32.3 mg/L, which is not statistically different (p-value >0.05) from that observed in reactor An2. This indicates that the presence of dye and its byproducts in phase 2 induced SMP production in the reac-tor An1 (without PAC), and this was probably due to the higher toxicity experienced by the microorganisms, as already shown by other authors[28].
In phase 3, an increase on color removal was observed in both reactors (Fig. 8) due to the presence of yeast extract, a source of the redox mediator riboflavin. The presence of yeast extract in the feed solution caused an increase (from 32.3 up to 45.6 mg/L) in CODSMPin relation to phase 2 for reactor An1, which is possibly due to the higher toxicity caused by aromatic amines. Aquino and Stukey[28]also showed there was a higher SMP accumulation in the presence of toxic compounds due to enhanced cell lysis and EPS production and hydrolysis, and this reinforces the hypothesis that the increased SMP production in both reactors in phase 3 is related to the higher presence of aromatic amines accumulated fol-lowing the anaerobic degradation of RGYRNL.
Indeed, it was observed, in this phase a higher median concen-tration of sulfanilic acid in the reactor An1 (Fig. 9), and some authors [29]attribute the higher toxicity of sulfonated azo dyes in anaerobic systems to the generation of this byproduct. As a
gC
O
DS
M
P
/g
VS
S
Phases
An-2 An-1
3 2 1 3
2 1 1.8
1.6
1.4
1.2
1.0
0.8
0.6
0.4
0.2
0.0
0.31 0.29 0.36
0.13 0.31 1.7
Fig. 6.Production of CODSMPinside the reactors An1 (A) and An2 (B) throughout the
operational phases.
VS
S
(g
)
Phases
An-2 An-1
3 2 1 3
2 1
30
25
20
15
10
21.0
16.1
9.6
23.2
15.0
12.8
Fig. 7.VSS mass inside anaerobic reactors An1 and An2 throughout all the operational phases.
A
z
od
y
e
(m
g
/L
)
P hases
Effluent Ar-1 Effluent An-1
Influent
3 2 3 2 3 2 60
50
40
30
20
10
0
P hases
Effluent Ar-2 Effluent An-2
Influent
3 2 3 2 3 2 60
50
40
30
20
10
0
52.0 55.0
7.2 12.0
4.7 9.1
52.4 50.0
5.0 9.7
3.0 6.3
An1/Ar1 An2/Ar2
Fig. 8.Estimative of the azo dye RGYRNL concentration in the affluent and effluents from the An1/Ar1 and An2/Ar2 systems during phases 2 and 3.
result, the exposure of micro-organisms to high amounts of sulfa-nilic acid might have caused stressful conditions in the anaerobic reactors, mainly in An1 (without PAC), thereby enhancing cell lysis and EPS production[28,30].
Such evidence is confirmed byFig. 6which shows there was an increase in the CODSMP/gVSS ratio in reactor An1 from 0.29 (phase 2) to 0.31 (phase 3). In the reactor operated with PAC (An2), the same behavior was observed, however, as operation went on, there was a decrease in the CODSMP/gVSS ratio from phase 1 (1.7 g CODSMP/gSSV) to phase 2 (0.31 g CODSMP/gSSV) as well as from phase 2 to phase 3 (0.13 g CODSMP/gSSV). Such decrease might have occurred due to PAC’s capability of minimizing the toxic effects and facilitating the biomass acclimation, which enhanced the bio-degradation of intermediate compounds produced throughout all operational phases. It is likely that PAC adsorbed sulfanilic acid and other toxic byproducts, thereby contributing to reduce toxicity and cell lysis. It is also possible that PAC had also adsorbed part of the produced SMPs, and this would probably favor
s
ul
fa
ni
li
c
ac
id
(m
g
/L
)
Phases
An-2 An-1
3 2
3 2
5
4
3
2
1
0
3.07
0.52
2.84
1.05
Fig. 9.Estimative of sulfanilic acid concentration inside reactors An1 and An2 during the phases in which the azo dye was fed to the reactors.
its bio-degradation due to its increased permanence inside the reactor.
As far as the aerobic post-treatment is concerned, it can be assumed that the residual soluble COD is predominantly com-prised of SMPs, since it was not observed, in any of the three oper-ational phases, detectable amounts of VFA (CODVFA), sulfanilic acid (aromatic amines) and residual dye.
3.3. Evaluation of aerobic post-treatment in the removal of residual azo dye and intermediate compounds
According to some authors[31], the treatment of textile efflu-ents must aim to simultaneously remove azo dye and mineralize the generated metabolites.Fig. 10shows the color removal effi-ciencies in An1/Ar1 and An2/Ar2 systems. It can be seen that throughout operational phases 2 and 3 the efficiency of RGYRNL removal was significantly higher (p-value < 0.05) in the reactor An2 (80.6% phase 2 and 90.4% phase 3) when compared to reactor An1 (78.2% phase 2 and 86.1% phase 3). Such outcome was expected, since other studies performed by our research group also showed higher color removal in anaerobic reactors operated with PAC (4 g/L) when they were fed with synthetic and industrial efflu-ents[12,24].
Yet, it was possible to observe that the aerobic post-treatment was able to remove about 24% of color in reactor Ar1 during phase 2 and 34% in phase 3. Such values were lower than those obtained in reactor Ar2, 35% in phase 2 and 40% in phase 3. The lower color removal efficiency observed in the aerobic systems when com-pared to anaerobic reactors is due to the fact that azo bond (AN@NA) cleavage is difficult in oxidative environments. In
addi-tion, the dissolved oxygen outcompetes the azo dye as the pre-ferred electron acceptor, thereby impairing the azo bond reduction. In other words, the decolorization of azo dyes is easier in reductive environments, in the absence of electron acceptors which have reduction potentials lower than the azo dye.
In regards to the degradation of byproducts (aromatic amines) generated by the azo dye’s reductive degradation, Ar1 and Ar2 aer-obic systems demonstrated an excellent performance in removing sulfanilic acids. As it can be seen in the chromatograms presented inFig. 10, the peak of such compound, found in higher amount in samples from inside the anaerobic reactors in phases 2 and 3, was not detected in the effluent from both aerobic reactors (Ar1 and At2). This indicates the aerobic system was responsible for the total mineralization of this anaerobic byproduct. Other authors such as Chen et al.[32]have also demonstrated the capacity of activated sludge systems to completely remove sulfanilic acid. Therefore, the data presented here support the hypothesis that the aerobic phase is effective in polishing the effluent from anaer-obic reactors treating azo dyes since they reduce the concentration of intermediate compounds and byproducts allegedly toxic to the environment.
As far as the removal of SMP in the aerobic step is concerned, the data gathered along the three operational phases shows that the Ar-1 reactor was not efficient in removing CODSMP. The CODSMP values in the final effluent in most phases were greater than the values observed in the effluent from An-1. On the other hand the CODSMPeffluent from aerobic reactor Ar-2 was lower when com-pared to that observed in the anaerobic effluent (An-2) in all oper-ational phases. A hypothesis to explain this behavior is the largest amount of toxic compounds that seemed to reach the reactor Ar-1 due to the lack of PAC.
The anaerobic–aerobic combined system turned out to be effi-cient for removing organic matter (VFA and aromatic amines) and color during the treatment of azo dye solutions. Other works involving the combined use of chemical and biological processes for the treatment of synthetic textile wastewater have been
reported in the literature, with results less promising than the ones obtained in this study. For instance, Yasar et al.[33]investigated the use of anaerobic reactor combined with ozone oxidation. The results showed that higher doses of ozone (1.25 mgO3/mgCOD) to achieve color removal efficiencies higher than 50% and COD removal efficiencies greater than 90%.
The results presented in this paper show that it is possible to achieve COD and color removal efficiency greater than 90% using the combined aerobic and anaerobic reactors. In addition, the use of this system in full scale would be facilitated since most textile industries employ the aerobic activated sludge system to treat their effluents.
4. Conclusion
The anaerobic–aerobic combined system turned out to be effi-cient for removing organic matter and color during the treat-ment of model azo dye solutions. The An2/Ar2 system, in which the anaerobic reactor had PAC in its interior, exhibited organic matter and color removal efficiencies higher than those observed in the control system (An1/Ar1) in all operational phases.
The presence of PAC inside the anaerobic reactor showed to be directly related to SMPs’ dynamic production. Throughout the biomass acclimation phase (phase 1), it was observed a higher accumulation of CODSMP in the reactor operated with PAC (An2), when compared with the reactor without PAC (An1). In phases 2 and 3, in which the model azo dye was added, it was observed an increase in the CODSMPfor reactor An1 (without PAC) in relation to phase 1; and a decrease in CODSMPfor reactor An2. This indicates that PAC minimized the toxicity effects caused by the presence of some byproducts (ex: aromatic amines and VFA) and consequently decreased SMP production in these phases.
The aerobic reactors were able to completely remove the sulfa-nilic acid (sulfonated aromatic amine) produced during the anaerobic degradation of the model azo dye, corroborating that systems combining anaerobic and aerobic reactors are a good technological alternative for the treatment of effluents contain-ing azo dyes.
Acknowledgments
The authors would like to thank the financial support obtained from the following Brazilian institutions: CAPES, CNPq, FAPEMIG and UFOP.
References
[1]E. Acuner, F.B. Dilek, Treatment of tectilon yellow 2G byChlorella vulgaris,
Process Biochem. 39 (2004) 623–631.
[2]U. Aftab, M.R. Khan, M. Mahfooz, M. Ali, S.H. Aslam, A. Rehman,
Decolourization and degradation of textile azo dyes byCorynebacteriumsp.
Isolated from industrial effluent, Pak. J. Zool. 43 (2011) 1–8.
[3]S. Sadri Moghaddam, M.R. Alavi Moghaddam, M. Arami, A comparison study on
acid red 119 dye removal using two different types of waterworks sludge,
Water Sci. Technol. 61 (2010) 1673–1681.
[4]S. Netpradit, P. Thiravetyan, S. Towprayoon, Application of ‘waste’ metal
hydroxide sludge for adsorption of azo reactive dyes, Water Res. 37 (2003)
763–772.
[5]A. Kunz, V. Reginatto, N. Durán, Combined treatment of textile effluent using
the sequencePhanerochaetechrysosporium–ozone, Chemosphere 44 (2001)
281–287.
[6]Y. Dong, J. Chen, C. Li, H. Zhu, Decoloration of three azo dyes in water by
photocatalysis of Fe (III) oxalate complexes/H2O2in the presence of inorganic
salts, Dyes Pigm. 73 (2007) 261–268.
[7]A. Pandey, P. Singh, L. Iyengar, Bacterial decolorization and degradation of azo
dyes, Int. Biodeterior. Biodegrad. 59 (2007) 73–84.
[8]S. Asad, M.A. Amoozegar, A.A. Pourbabaee, M.N. Sarbolouki, S.M.M. Dastgheib, Decolorization of textile azo dyes by newly isolated halophilic and
halotolerant bacteria, Bioresour. Technol. 98 (2007) 2082–2088.
[9]J.A. Field, F.J. Cervantes, F.P. Van der Zee, G. Lettinga, Role of quinones in the
biodegradation of priority pollutants: a review, Water Sci. Technol. 42 (2000)
215–222.
[10]F.P. Van der Zee, F.J. Cervantes, Impact and application of electron shuttles on
the redox (bio)transformation of contaminants: a review, Biotechnol. Adv. 27
(2009) 256–277.
[11]F.J. Cervantes, A.B. Dos Santos, Reduction of azo dyes by anaerobic bacteria:
microbiological and biochemical aspects, Rev. Environ. Sci. Biotechnol. 10
(2011) 125–137.
[12]B.E.L. Baêta, R.L. Ramos, D.R.S. Lima, S.F. Aquino, Use of submerged anaerobic
membrane bioreactor (SAMBR) containing powdered activated carbon (PAC) for the treatment of textile effluents, Water Sci. Technol. 65 (2012) 1540–
1547.
[13]A. Stolz, Basic and applied aspects in the microbial degradation of azo dyes,
Appl. Microbiol. Biotechnol. 56 (2001) 69–80.
[14]M.E.R. Silva, P.I.M. Firmino, A.B. Dos Santos, Impact of the redox mediator
sodium anthraquinone-2,6-disulphonate (AQDS) on the reductive
decolourisation of the azo dye reactive red 2 (RR2) in one- and two-stage
anaerobic systems, Bioresour. Technol. 121 (2012) 1–7.
[15]F.P. Van Der Zee, S. Villaverde, Combined anaerobic-aerobic treatment of azo
dyes – a short review of bioreactor studies, Water Res. 39 (2005) 1425–1440.
[16]E.H. Koupaie, M.R. Moghaddam, S.H. Hashemi, Post-treatment of anaerobically
degraded azo dye acid red 18 using aerobic moving bed biofilm process:
enhanced removal of aromatic amines, J. Hazard. Mater. 195 (2011) 147–154.
[17]C. O’Neill, A. Lopez, S. Esteves, F.R. Hawkes, D.L. Hawkes, S. Wilcox, Azo-dye
degradation in an anaerobic–aerobic treatment system operating on simulated
textile effluent, Appl. Microbiol. Biotechnol. 53 (2000) 249–254.
[18]M.E.R. Silva, P.I.M. Firmino, M.R. Sousa, A.B. Dos Santos, Sequential anaerobic/
aerobic treatment of dye-containing wastewaters: colour and cod removals,
and ecotoxicity tests, Appl. Biochem. Biotechnol. 166 (2012) 1057–1069.
[19]C.A.L. Chernicharo, Anaerobic Reactors: Biological Wastewater Treatment
Series, first ed., IWA Publishing, London, 2007.
[20]M. Von Sperling, Activated Sludge and Aerobic Biofilm Reactors, first ed., IWA
Publishing, London, 2007.
[21]P.L. Mesquita, G.S. Leite, R.J.C.F. Afonso, S.F. Aquino, Validation of a liquid
chromatography methodology for the simultaneous determination of seven
volatile fatty acids (VFA) intermediates of anaerobic digestion, Eng. Sanit.
Amb. 18 (2013) 295–302.
[22]H.M. Pinheiro, E. Touraud, O. Thomas, Aromatic amines from azo dye
reduction: status review with emphasis on direct UV spectrophotometric
detection in textile industry wastewaters, Dyes Pigm. 61 (2004) 121–139.
[23]S.F. Aquino, C.A.L. Chernicharo, Acúmulo de ácidos graxos voláteis (AGVS) em
reatores anaeróbios sob estresse: causa e estratégias de controle, Eng. Sanit
Amb. 10 (2005) 152–161.
[24]B.E.L. Baêta, H.J. Luna, A.L. Sanson, S.Q. Silva, S.F. Aquino, Degradation of a
model azo dye in submerged anaerobic membrane bioreactor (SAMBR) operated with powdered activated carbon (PAC), J. Environ. Manage. 128
(2013) 462–470.
[25]S.F. Aquino, A.Y. Hu, A. Akram, D.C. Stuckey, Characterization of dissolved
compounds in submerged anaerobic membrane bioreactors (SAMBRs), J.
Chem. Technol. Biotechnol. 81 (2006) 1894–1904.
[26]S.F. Aquino, D.C. Stuckey, The effect of organic and hydraulic shock loads on
the production of soluble microbial products (SMP) in anaerobic digesters,
Water Environ. Res. 76 (2004) 2628–2636.
[27]A. Akram, D.C. Stuckey, Flux and performance improvement in a submerged
anaerobic membrane bioreactor (SAMBR) using powdered activated carbon
(PAC), Process Biochem. 43 (2008) 93–102.
[28]S.F. Aquino, D.C. Stuckey, Soluble microbial products (SMP) formation in
anaerobic chemostats in the presence of toxic compounds, Water Res. 38
(2003) 255–266.
[29]N. Yemashova, S. Kalyuzhny, Microbial conversion of selected azo dyes and
their breakdown products, Water Sci. Technol. 53 (2006) (2006) 163–171.
[30]C.S. Laspidou, B.E. Rittmann, Modeling the development of biofilm density
including active bacteria inert biomass and extracellular polymeric
substances, Water Res. 38 (2004) 3349–3361.
[31]M. Hakimelahi, M.R.A. Moghaddam, S.H. Hashemi, Biological treatment of
wastewater containing an azo dye using mixed culture on alternating anaerobic/aerobic sequencing batch reactors, Biotechnol Bioproc. E 17
(2012) 875–880.
[32]C. Gang, K.Y. Cheng, M.P. Ginige, A.H. Kaksonen, Aerobic degradation of
sulfanilic acid using activated sludge, Water Res. 46 (2012) 145–151.
[33]A. Yasar, N. Ahmad, M.N. Chaudhry, M.S.U. Rehman, A.A.A. Khan, Ozone for
color and COD removal of raw and anaerobically biotreated combined