Acta Scientiarum
http://periodicos.uem.br/ojs/acta ISSN on-line: 1807-8621
Doi: 10.4025/actasciagron.v40i1.36399 CROP PRODUCTION
Sugarcane cultivation with source potassium low water-soluble
Gaspar Henrique Korndorfer, Hamilton Seron Pereira*, Ivaniele Nahas Duarte, Laerte Rocha
Neves Pinto and Luciano Ferreira da Fonseca
Universidade Federal de Uberlândia, Av. Amazonas, s/n., Bloco 2E, S. 122, Cx. Postal 593, 38400-902, Uberlândia, Minas Gerais, Brazil. *Author for correspondence. E-mail:[email protected]
ABSTRACT. Thermopotash is a fertilizer with low solubility but has a release level compatible with plant demands. This study aimed to compare the effect of Thermopotash to that of KCl in sugarcane. Field work was conducted during two crop seasons, in a randomised block design. Treatments were applied to the bases of the furrows before planting the sugarcane, arranged in a 2 x 5 factorial design to evaluate two K sources (TK47 - Thermopotash, KCl - potassium chloride) at five levels of K (0, 50, 100, 150, and 200 kg ha-1 K
2O). The variables analysed included leaf and soil K, Ca, Mg and Si, soil pH and productivity. The
effects of the TK47 fertilizer on sugarcane stalk production were not initially superior to that of the soluble source, but over time, differences between the soluble and insoluble sources increased. The maximum expected sugarcane productivity for both sources was 133 Mg ha-1, which was achieved at an application
level of 121 kg ha-1 K
2O. TK47 fertilizer provided K, Si, Ca and Mg to the sugarcane in both the first and
second harvests. Thus, TK47 may be a viable source of K for sugarcane.
Keywords: thermopotash; potassium chloride; soil; Saccharum spp.
Cultivo da cana-de-açúcar com fonte de potássio pouco solúvel em água
RESUMO. Termopotássio é um fertilizante com baixa solubilidade em água mas possui uma taxa de liberação compatível com a demanda da planta. Esse estudo objetivou avaliar os efeitos do termopotássio em relação ao cloreto de potássio no cultivo da cana. O trabalho foi realizado no campo durante duas safras agrícolas, em delineamento de blocos casualizados. Os tratamentos foram aplicados no sulco antes do plantio da cana, organizados em esquema fatorial 2x5, sendo duas fontes K (TK47-Termopotássio e KCl-cloreto de potássio) e cinco doses de K (0, 50, 100, 150 e 200 kg ha-1 de K
2O). As variáveis analisadas foram:
teores de K, Ca, Mg e Si nas folhas e solo, pH do solo e produtividade. Os efeitos do adubo TK47 sobre a produção foram similares aos da fonte solúvel na cana planta, e ao longo do tempo, as diferenças entre fontes solúveis e insolúveis aumentaram. A produtividade máxima esperada da cana planta para ambas as fontes foi de 133 Mg ha-1, com a aplicação de 121 kg ha-1 de K
2O. O adubo TK47 forneceu K, Si, Ca e Mg
para a cana planta e para a cana soca. Assim, o TK47 pode ser uma fonte viável de K para a cana-de-açúcar.
Palavras-chave: termopotássio; cloreto de potássio; solo; Saccharum spp.
Introduction
Potassium (K) deposits containing soluble K minerals occur predominantly in the northern hemisphere, mainly in Canada and Russia. Production tonnage and prices do not take into account the needs of farmers; therefore, as needs continually evolve, alternatives to soluble salts have been explored to produce K fertilizers (Ciceri, Manning, & Allanore, 2015). The investigation of K silicate minerals and their host rocks as alternative sources of K is especially relevant in systems with highly weathered soils that lack significant cation exchange capacity (Manning, 2010).
Verdete is a sedimentary rock that stands out among potential potassium sources and is found in Serra da Saudade (Alto Paranaíba Region of Minas
Gerais State, Brazil), which lies atop the San Francisco craton. This rock has low water-soluble K content, indicating a certain limitation in its use as a K fertilizer in its natural state, especially for short cycle crops. Nevertheless, the total K content of Verdete indicates the potential of this rock as a raw material for the production of K fertilizer (Santos et al., 2015). One means to increase the K availability of this rock is through chemical and thermal
processing and mixing with CaCO3 at 1,100°C. This
process results in a fertilizer called Thermopotash that has lower solubility then soluble K minerals,
such as sylvite (KCl) and arcanite (K2SO4), but has a
losses from leaching are minimised compared to soluble fertilizers (Nunes, Kautzmann, & Oliveira, 2014).
Assessing the dynamics of nutrient release from sources with low water solubility requires long-term field studies. Fertilization in sugarcane increases plant height and plant dry matter (Thengavelu, 2009). Sugarcane is a good candidate for this type of study given its long crop cycle, extremely high K requirements, and economic significance in Brazil.
Therefore, this study aimed to compare the effect of Thermopotash (TK47 fertilizer) to that of KCl on sugarcane productivity, nutrient uptake and soil nutrient availability.
Material and method
The experiment was conducted with sugarcane cultivar SP 832847 grown in an Ustoxic soil and was set up in June, 2011 in Chaveslandia, Minas Gerais State, Brazil (19°04’07.49”S and 50°22’19.70”W). The 0-20 cm layer of the soil had the following characteristics: pH in water = 4.4, P (Mehlich 1) =
2.0 mg dm-3, K (Mehlich 1) = 0.04 cmol
c dm-3, Ca2+
(KCl) = 0.6 cmolc dm-3, Mg2+ (KCl) = 0.3 cmolc
dm-3, Si (CaCl
2 0.01 mol L-1) = 3.0 mg dm-3, H+Al
= 2.44 cmolc dm-3, CEC = 3,34 cmolc dm-3, sand =
860 g kg-1, silt = 10 g kg-1,and clay = 130 g kg-1.
Accumulated rainfall totalled 1,323 mm before the first sugarcane harvest and 1,223 mm before the second harvest. Soil preparation consisted of an
application of dolomitic limestone (1 Mg ha-1) over
the entire experimental area followed by harrowing and levelling. Before planting the sugarcane, 250 kg
ha-1 monoammonium phosphate (MAP) was applied
to the base of the furrow using a plough. Next, the K sources (KCl and TK47 fertilizer) at the various application levels were distributed manually in the sugarcane furrow. After the first harvest, gypsum (1
t ha-1) and dolomitic limestone (1 t ha-1) were
superficially applied throughout the entire experimental area.
The experiment was carried out at a sugarcane plant and set up in a randomised block design with five replication blocks for a total of 50 plots. Each
experimental plot covered 150 m2 and consisted of
five 20-m-long rows of sugarcane spaced 1.5 m apart. Treatments were arranged in a 2 x 5 factorial design, evaluating two K sources (TK47 fertilizer - Thermopotash and KCl) at five levels of K (0, 50,
100, 150, and 200 kg ha-1 K
2O).
TK47 is a mineral fertilizer developed by Verde Fertilizantes and is obtained by mixing limestone, Verdete and special reagents at a ratio of
approximately 1 (CaCO3): 5 (Verdete). After
mixing, the particle size is greatly reduced, and the mixture is then heat treated in a thermal reactor at approximately 1,000°C.
The K sources were characterised physically and chemically (MAPA, 2017). TK47 is a grained fertilizer (granulometry is between 2.83 and 4.80
mm) and is characterised chemically by total K2O =
7%, soluble K2O in 2% citric acid = 6%, total Si =
28%, total Ca = 22%, and total Mg = 1%. It has a salt index of 0.5, and the neutralising power was
determined as 55% EqCaCO3. KCl has K2O = 60%,
Cl = 47%, and a salt index of 116. Thus, these sources are capable of providing other nutrients in
addition to K. Therefore, to provide 200 kg of K2O,
2,857 kg ha-1 TK47 and 333 kg ha-1 KCl were applied
(Table 1).
After application of the treatments, sugarcane sets of cultivar SP 832847 were manually planted in the furrows at a density of 17 buds per metre. Earthing-up and an application of ammonium
nitrate (80 kg ha-1) were carried out 90 days after
planting.
To evaluate the residual effect of the K applications on the ratoon cane, all plots received
applications of nitrogen (150 kg ha-1) as ammonium
nitrate (33% N) and 70 kg ha-1 P
2O5 as triple
superphosphate (46% P2O5). There were no
reapplications of the K sources.
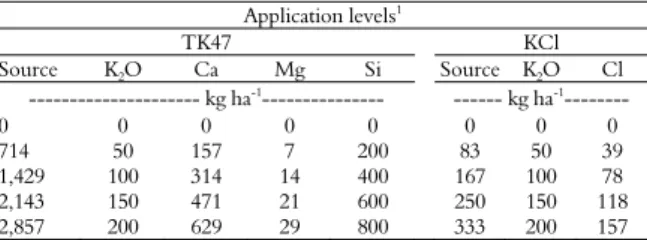
Table 1. Quantities of Ca, Mg, Si and K supplied by KCl or TK47 K fertilizers.
Application levels1
TK47 KCl
Source K2O Ca Mg Si Source K2O Cl
--- kg ha-1--- --- kg ha-1---
0 0 0 0 0 0 0 0
714 50 157 7 200 83 50 39
1,429 100 314 14 400 167 100 78
2,143 150 471 21 600 250 150 118
2,857 200 629 29 800 333 200 157
1Application levels based on the total nutrient levels found in the sources TK47 =
Thermopotash (K2O total = 7%; Si total = 28%, Ca total = 22%, Mg total = 1%) and
KCl = Potassium chloride (K2O total = 60%; Cl total = 47%).
Potassium in sugarcane Page 3 of 9
The results were submitted for analysis of variance using the SISVAR program (Ferreira, 2011). Averages were compared at the 5% significance level. Quantitative treatments were evaluated using regression analysis, and the qualitative results were evaluated using the Tukey test.
Result and discussion
In the first harvest, the TK47 fertilizer produced
the same stalk yield (128.6 Mg ha-1) as that of KCl
(123.7 t ha-1), considering the average of the K levels
applied (Table 2). In this harvest, according to a
quadratic model (y = 0.0012X + 0.2905X +
115.03), sugarcane productivity was 115.03 t ha-1
for the control treatment (without K application)
but reached 132.61 t ha-1 with application of 121.04
kg ha-1 K
2O, regardless of source. Sugarcane stalk
productivity decreased at higher application levels (Figure 1A, harvest 1).
Averaging the different K levels, sugarcane productivity in the second harvest was 5.44% higher using TK47 fertilizer application versus the use of KCl (Table 2). Figure 1A shows a linear response of production to dose increase.
Table 2. Effects of K levels and sources on stalk productivity for sugarcane variety SP832847, 2011/12 and 2012/13 crops (Usina Vale do São Simão, Chaveslandia, Minas Gerais State, Brazil).
K2O levels 1
st harvest 2nd harvest
TK47 KCl Mean TK47 KCl Mean
kg ha-1 ---Stalk Productivity, Mg ha-1 ---
0 113.0 113.6 113.3 108.2 107.8 108.0
50 135.7 122.8 129.3 119.5 111.9 115.7
100 136.1 132.5 134.3 124.3 115.6 119.9
150 123.4 128.8 126.1 125.2 117.2 121.2
200 134.8 120.8 127.8 126.9 118.7 122.8
Mean 128.6 A 123.7 A 120.8 A 114.3 B
CV= 10.57%; LSDsource= 7.65 CV= 7.79%; LSDsource= 5.25
Means followed by distinct letters within a row differ according to the Tukey test at the 0.05 significance level. TK47 = Thermopotash; KCl = Potassium chloride.
The accumulated result (sum of the 1st and 2nd
harvests) clearly shows that, regardless of K level, sugarcane stalk productivity was higher using the TK47 fertilizer versus using KCl (Figure 2). Furthermore, a quadratic fit shows that without K
applications, productivity was 224.3 Mg ha-1, but
with K applications, regardless of source, productivity increased up to a maximum of 253.3
Mg ha-1 with an application of 135 kg ha-1 K
2O
(Figure 1B). These data demonstrate that for sugarcane production, the residual effect of TK47 is more effective than that of KCl. Duarte, Sousa, Korndorfer, and Pereira (2015) studied different K sources and reported that millet absorbed K from Alfa 02, a K source produced by mixing limestone and Verdete with subsequent heat treatment, in both the first and second crops, thereby demonstrating a residual effect from this source.
The TK47 fertilizer increased Si availability in the soil (Tables 4 and 5) (Figures 4 and 5) and Si leaf concentrations (Table 3 and Figure 3). The supply of Si may also have contributed to increases in sugarcane productivity. Datnoff et al. (2001) observed that silicate applications were associated with increases of up to 17% in cane plant productivity and up to 20% in ratoon productivity.
An evaluation of cane plant nutrition showed that, in the first harvest, the only significant interaction between source and application level was related to leaf K and Ca. KCl was associated with higher leaf K levels compared to the TK47 fertilizer at application levels of
100, 150, and 200 kg ha-1 K
2O in the cane plant and at
all application levels in the ratoon cane (Table 3). However, average leaf K in crops for both K sources
ranged between 10 and 20 g kg-1, which is adequate
for sugarcane (Fageria, Baligar, & Jones, 2011).
Figure 1. Effects of K levels and sources on sugarcane productivity for sugarcane variety SP832847, 2011/12 and 2012/13 crops (Usina Vale do São Simão, Chaveslandia, Minas Gerais State, Brazil). TK47 = Thermopotash; KCl = Potassium chloride; 5% significance level.
y = -0.0012x2+ 0.2905x + 115.03
R² = 78%
y = 0.0703x + 110.5 R² = 87%
100 110 120 130 140 150 160
0 50 100 150 200
P
ro
d
uc
ti
vi
ty
(t h
a-1)
K2O (kg ha-1)
Harvest 1 TK47 and KCl
Harvest 2 TK47 and KCl
y = -0.0016x2+ 0.4464x + 223.4
R² = 89%
200 210 220 230 240 250 260 270 280
0 50 100 150 200
P
rod
uc
ti
vi
ty (
t ha
-1)
K2O (kg ha-1)
Harvest 1+2 TK47 and KCl B A
^ ^
Figure 2. Total productivity (1st
+ 2nd
harvests) of the sugarcane (Usina Vale do São Simão, Chaveslandia, Minas Gerais State, Brazil). Means followed by distinct lower case letters differ according to the Tukey test at 5% significance regarding K sources (LSD = 10.95). TK47 = Thermopotash; KCl = Potassium chloride.
Although sugarcane absorbs more K when it is fertilised using KCl than when it is fertilised using TK47, this difference does not translate into increased productivity (Table 2), indicating that these plants had K levels that are more than sufficient. According to Setiyono, Walters, Cassman, Witt, and Dobermann (2010), plants have the ability to absorb more K than is required for full development, a situation that is commonly referred to as luxury consumption.
Leaf Ca concentration was higher when using TK47 fertilizer than when using KCl at levels of 150
and 200 kg ha-1 K
2O in the plant cane and for all
levels in the ratoon cane (Table 3) and appeared to be within the optimum range (Raij, 2011) in both harvests. This occurred because the limestone used to correct the soil acidity also supplies Ca, whereas the TK47 fertilizer contains CaO from limestone. The K sources did not affect leaf Mg and Si in the plant cane crop; however, in the second harvest, the levels of leaf Mg were higher for the TK47 treatment, regardless of application level (Table 3). However, leaf Si was higher when using the TK47 fertilizer than
when using KCl at 150 and 200 kg ha-1 K
2O (Table 3),
but these concentrations were still not high enough to
be considered ideal for sugarcane cultivation (6 g kg-1)
(McCray et al., 2010).
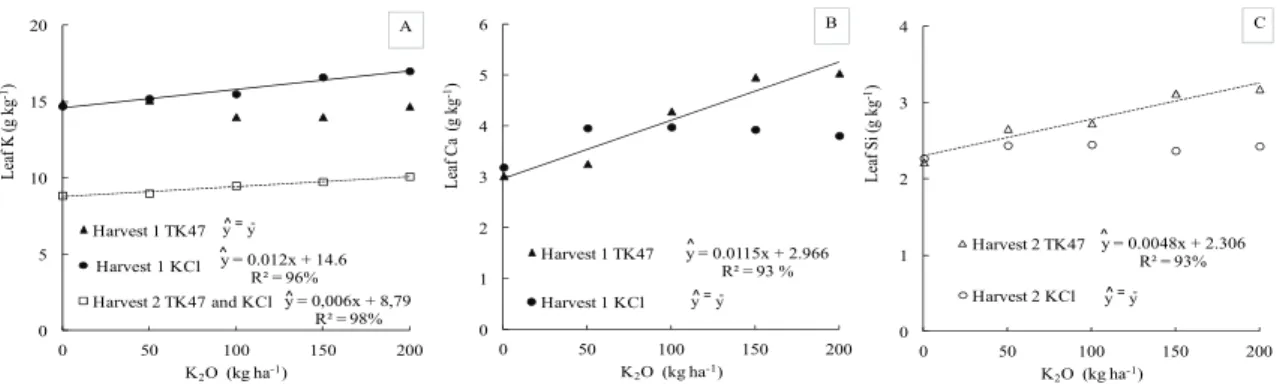
A linear fit or direct relationship was found between higher K application levels and increases in leaf nutrient levels. This relationship was observed for KCl in the first sugarcane harvest and for KCl and the TK47 fertilizer in the second harvest (Figure 3A). This direct relationship existed for leaf Ca the TK47 fertilizer treatment in the first harvest (Figure 3B) and for leaf Si in the TK47 fertilizer treatment after the second harvest (Figure 3C).
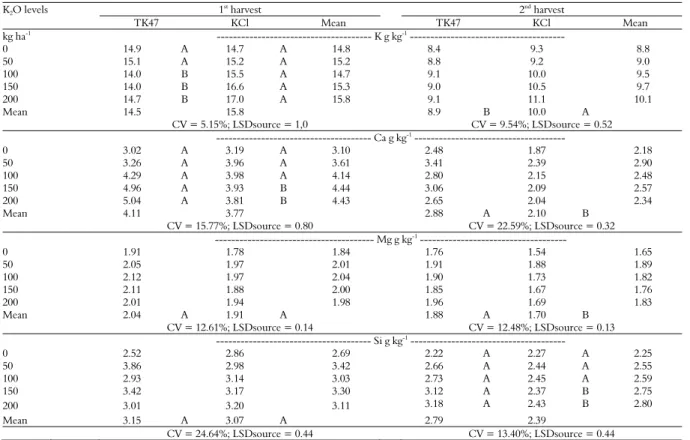
Table 3. Effects of K levels and sources on leaf concentrations of K, Ca, Mg, and Si for sugarcane variety SP832847, 2011/12 and 2012/13 crops (Usina Vale do São Simão, Chaveslandia, Minas Gerais State, Brazil).
K2O levels 1
st harvest 2nd harvest
TK47 KCl Mean TK47 KCl Mean
kg ha-1 --- K g kg-1 ---
0 14.9 A 14.7 A 14.8 8.4 9.3 8.8
50 15.1 A 15.2 A 15.2 8.8 9.2 9.0
100 14.0 B 15.5 A 14.7 9.1 10.0 9.5
150 14.0 B 16.6 A 15.3 9.0 10.5 9.7
200 14.7 B 17.0 A 15.8 9.1 11.1 10.1
Mean 14.5 15.8 8.9 B 10.0 A
CV = 5.15%; LSDsource = 1,0 CV = 9.54%; LSDsource = 0.52
--- Ca g kg-1 ---
0 3.02 A 3.19 A 3.10 2.48 1.87 2.18
50 3.26 A 3.96 A 3.61 3.41 2.39 2.90
100 4.29 A 3.98 A 4.14 2.80 2.15 2.48
150 4.96 A 3.93 B 4.44 3.06 2.09 2.57
200 5.04 A 3.81 B 4.43 2.65 2.04 2.34
Mean 4.11 3.77 2.88 A 2.10 B
CV = 15.77%; LSDsource = 0.80 CV = 22.59%; LSDsource = 0.32
--- Mg g kg-1 ---
0 1.91 1.78 1.84 1.76 1.54 1.65
50 2.05 1.97 2.01 1.91 1.88 1.89
100 2.12 1.97 2.04 1.90 1.73 1.82
150 2.11 1.88 2.00 1.85 1.67 1.76
200 2.01 1.94 1.98 1.96 1.69 1.83
Mean 2.04 A 1.91 A 1.88 A 1.70 B
CV = 12.61%; LSDsource = 0.14 CV = 12.48%; LSDsource = 0.13
--- Si g kg-1 ---
0 2.52 2.86 2.69 2.22 A 2.27 A 2.25
50 3.86 2.98 3.42 2.66 A 2.44 A 2.55
100 2.93 3.14 3.03 2.73 A 2.45 A 2.59
150 3.42 3.17 3.30 3.12 A 2.37 B 2.75
200 3.01 3.20 3.11 3.18 A 2.43 B 2.80
Mean 3.15 A 3.07 A 2.79 2.39
CV = 24.64%; LSDsource = 0.44 CV = 13.40%; LSDsource = 0.44
Means followed by distinct, uppercase letters within a row differ according to the Tukey test at the 0.05 significance level. TK47 = Thermopotash; KCl = Potassium chloride.
100 120 140 160 180 200 220 240 260 280
TK47 KCl TK47 KCl TK47 KCl TK47 KCl TK47 KCl TK47 KCl
0 50 100 150 200 Mean
Pr
od
uct
iv
it
y
(
t
ha
-1)
K2O (kg ha-1)
Second harvest First harvest
Potassium in sugarcane Page 5 of 9
Figure 3. Effects of K levels and sources on leaf concentrations of K, Ca, and Si for sugarcane variety SP832847, 2011/12 and 2012/13 crops (Usina Vale do São Simão, Chaveslandia, Minas Gerais State, Brazil). TK47 = Thermopotash; KCl = Potassium chloride; 5% significance level (*).
Table 4. Effects of K levels and sources on soil availability of K, Ca, Mg, and Si in the 0-20 cm soil layer after the sugarcane harvest for variety SP832847, 2011/12 and 2012/13 crops (Usina Vale do São Simão, Chaveslandia, Minas Gerais State, Brazil).
K2O Levels 1
st harvest 2nd harvest
Cane Plant TK47 KCl Mean TK47 KCl Mean
Depth 0-20 cm
kg ha-1
--- K Mehlich (cmolc dm
-3
) ---
0 0.05 A 0.05 A 0.05 0.06 0.05 0.05
50 0.07 A 0.08 A 0.08 0.07 0.05 0.06
100 0.18 A 0.07 B 0.13 0.12 0.06 0.09
150 0.25 A 0.06 B 0.16 0.14 0.06 0.10
200 0.28 A 0.07 B 0.18 0.13 0.07 0.10
Mean 0.17 0.07 0.11 A 0.06 B
CV = 15.77%; LSDsource = 0.80 CV = 44.96%; LSDsource = 0.02
--- Ca (cmolc dm
-3) ---
0 0.94 A 0.74 A 0.84 1.10 A 1.06 A 1.08
50 0.98 A 0.69 B 0.84 1.35 A 0.96 B 1.15
100 1.26 A 0.73 B 0.99 1.73 A 1.24 B 1.49
150 1.38 A 0.65 B 1.03 1.37 A 1.00 B 1.19
200 1.40 A 0.68 B 1.04 1.54 A 1.10 B 1.32
Mean 1.19 0.70 1.42 1.07
CV = 21.47%; LSDsource = 0.26 CV = 21.78%; LSDsource = 0.34
--- Mg (cmolc dm
-3
) ---
0 0.26 0.26 0.26 0.45 A 0.42 A 0.43
50 0.27 0.26 0.27 0.45 A 0.51 A 0.48
100 0.31 0.24 0.28 0.52 B 0.87 A 0.69
150 0.32 0.24 0.28 0.41 B 0.79 A 0.60
200 0.30 0.26 0.28 0.49 A 0.40 A 0.44
Mean 0.30 A 0.25 A 0.47 0.60
CV = 31.41%; LSDsource = 0.05 CV = 17.93%; LSDsource = 0.12
--- Si (mg dm-3) ---
0 1.40 A 1.44 A 1.42 1.63 A 1.58 A 1.61
50 1.65 A 1.32 A 1.48 2.06 A 1.43 A 1.74
100 1.96 A 1.20 B 1.58 3.07 A 1.97 B 2.52
150 2.02 A 1.11 B 1.56 2.83 A 1.80 B 2.31
200 2.14 A 1.10 B 1.62 2.89 A 2.20 B 2.50
Mean 1.84 1.23 2.49 1.79
CV = 19.50%; LSDsource = 0.38 CV = 23.67%; LSDsource = 0.66
Means followed by distinct uppercase letters within the same row differ by the Tukey test at the 0.05 significance level. TK47 = Thermopotash; KCl = Potassium chloride.
Leaf K levels in the first harvest were higher than those in the second harvest. These differences indicate lower K availability in the soil due to the absence of subsequent K applications. The TK47 fertilizer produced higher soil K availability compared to KCl in the 0-20 cm layer at application
levels of 100, 150, and 200 kg ha-1 K
2O after the first
harvest and at all levels of K2O after the second harvest
(Table 4). In the 20-40 cm layer, the TK47 fertilizer produced higher soil K availability compared to KCl
at application levels of 150 and 200 kg ha-1 K
2O (after
the first and second harvests) (Table 5).
Soil Si was higher using the TK47 fertilizer than when using KCl (Tables 4 and 5). This occurred in the 0-20 cm layer after the first and second harvests
at levels of 100, 150, and 200 kg ha-1 K
2O (Table 4).
The same was found in the 20-40 cm layer at levels
of 150 and 200 kg ha-1 K
2O after the first harvest and
at 50, 100, 150, and 200 kg ha-1 K
2O after the second
harvest (Table 5). Si availability in the soil was higher under the TK47 treatment compared to KCl given that Thermopotash contains Si (Table 1) and that this Si is available to the soil (Figures 4D and 5D) and plant (Figure 3C).
y = 0.0048x + 2.306 R² = 93%
0 1 2 3 4
0 50 100 150 200
Le
af
Si
(
g kg
-1)
K2O (kg ha-1)
Harvest 2 TK47
Harvest 2 KCl
C
y = 0.0115x + 2.966 R² = 93 %
0 1 2 3 4 5 6
0 50 100 150 200
L
eaf
C
a
(g
kg
-1)
K2O (kg ha-1)
Harvest 1 TK47
Harvest 1 KCl y = 0.012x + 14.6
R² = 96% y = 0,006x + 8,79
R² = 98% 0
5 10 15 20
0 50 100 150 200
Le
af
K
(g
kg
-1)
K2O (kg ha-1)
Harvest 1 TK47
Harvest 1 KCl
Harvest 2 TK47 and KCl
A B
^ ^
^
^ ^ = -y -y
^ =
Figure 4. Effects of K levels and sources on soil availability of K, Ca, Mg, and Si in the 0-20 cm soil layer after the sugarcane harvest for variety SP832847, 2011/12 and 2012/13 crops (Usina Vale do São Simão, Chaveslandia, Minas Gerais State, Brazil).
Table 5. Effects of K levels and sources on soil availability of K, Ca, Mg, and Si in the 20-40 cm soil layer after the sugarcane harvest for variety SP832847, 2011/12 and 2012/13 crops (Usina Vale do São Simão, Chaveslandia, Minas Gerais State, Brazil).
K2O
Levels 1
st harvest 2nd harvest
Cane Plant TK47 KCl Mean TK47 KCl Mean
Depth 20-40 cm
kg ha-1 --- K Mehlich (cmol
c dm
-3) ---
0 0.03 A 0.05 A 0.03 0.05 A 0.03 A 0.04
50 0.05 A 0.04 A 0.05 0.10 A 0.04 A 0.07
100 0.03 A 0.04 A 0.04 0.11 A 0.05 A 0.08
150 0.22 A 0.04 B 0.13 0.17 A 0.06 B 0.12
200 0.30 A 0.05 B 0.18 0.30 A 0.06 B 0.18
Mean 0.13 0.04 0.15 0.05
CV = 47.70%; LSDsource = 0.07 CV = 51.97%; LSDsource = 0.09
--- Ca (cmolc dm-3) ---
0 0.31 A 0.34 A 0.32 0.68 A 0.70 A 0.69
50 0.33 A 0.37 A 0.35 1.34 A 0.69 B 1.01
100 0.44 A 0.28 A 0.36 1.50 A 0.98 B 1.24
150 0.80 A 0.16 B 0.48 1.58 A 0.68 B 1.40
200 0.78 A 0.17 B 0.48 1.87 A 0.89 B 1.38
Mean 0.53 0.26 1.39 0.79
CV = 47.49%; LSDsource = 0.24 CV = 32.17%; LSDsource = 0.45
--- Mg (cmolc dm
-3) ---
0 0.19 A 0.20 A 0.19 0.15 0.15 0.15
50 0.16 A 0.22 A 0.19 0.19 0.15 0.17
100 0.19 A 0.18 A 0.19 0.22 0.23 0.22
150 0.23 A 0.14 B 0.18 0.17 0.17 0.17
200 0.24 A 0.14 B 0.18 0.24 0.22 0.23
Mean 0.20 0.18 0.19 A 0.18 A
CV = 28.43%; LSDsource = 0.06 CV = 35.35 %; LSDsource =0.03
--- Si (mg dm-3)---
0 1.11 A 1.20 A 1.15 1.23 A 1.12 A 1.17
50 1.26 A 1.24 A 1.25 1.94 A 1.09 B 1.52
100 1.28 A 1.26 A 1.26 2.45 A 1.12 B 1.78
150 1.51 A 1.23 B 1.37 2.94 A 1.17 B 2.06
200 2.02 A 1.28 B 1.65 2.96 A 1.46 B 2.21
Mean 1.43 1.24 2.30 1.19
CV = 14.52%; LSDsource = 0.25 CV = 27.37%; LSDsource = 0.61
Means followed by distinct uppercase letters within a row differ by the Tukey test at the 0.05 significance level. TK47 = Thermopotash; KCl = Potassium chloride.
y = -0.00004x2+ 0.0082x + 0.3677
R² = 77% 0.00
0.10 0.20 0.30 0.40 0.50 0.60 0.70 0.80 0.90 1.00
0 50 100 150 200
So
il M
g
(c
mo
lc
dm
-3)
K2O (kg ha-1)
Harvest 1 TK47
Harvest 1 KCl
y = 0.0026x + 0.928 R² = 91 %
0.00 0.50 1.00 1.50 2.00 2.50 3.00
So
il C
a (
cmo
lc
dm
-3)
Harvest 1 TK47
Harvest 1 KCl y = 0.0013x + 0.038
R² = 95%
y = 0.0003x + 0.052 R² = 89%
0.00 0.05 0.10 0.15 0.20 0.25 0.30 0.35
So
il K
M
eh
lic
h
(c
mo
lc
dm
-3)
Harvest 1 TK47
Harvest1 KCl
Harvest 2 TK47 and KCl
B A
C y = 0.0037x + 1.464R² = 93%
y = -0.0018x + 1.412 R² = 94% y = 0.0066x + 1.838
R² = 70%
0 1 2 3 4 5 6
0 50 100 150 200
Soi
l S
i (
m
g
dm
-3)
K2O (kg ha-1)
Harvest 1 TK47
Harvest 1 KCl
Harvest 2 TK47
Harvest 2 KCl
D
^ = -y -y
^ = -y -y
^ = -y -y
^ = -y -y ^
^ ^
^ ^
^
Potassium in sugarcane Page 7 of 9
Sugarcane has a high demand for potassium. The response of sugarcane to potassium fertilization is dependent on the available K of the soil (Kumawat, Rajawat, & Rathod, 2016). Available K at both depths and after the first and second sugarcane harvests is considered low and very low (as classified by Raij, 2011) for the KCl treatment, respectively, while they are considered adequate for TK47, thereby demonstrating the residual effect of the Thermopotash. According to Chiba, Natale, Cruz, Teixeira, and Centurion (2008), the amount of K absorbed by the plants was often greater than the variation of exchangeable K content, suggesting that non ex changeable forms are being taken up.
The TK47 fertilizer yielded higher soil Ca after both harvests in the 0-20 cm layer (Table 4) and in the 20-40 cm layer (Table 5), except at 0 kg
ha-1 K
2O for both layers and in the 20-40 cm layer
at 50 and 100 kg ha-1 K
2O (after the first and
second harvests). This soil Ca availability is
greater than 0.7 cmolc dm-3
and is therefore considered high (Raij et al., 2001). The higher levels of available soil Ca in the TK47 fertilizer treatments are a result (Table 1) of the limestone used in the production of this fertilizer. The application of KCl and the TK47 fertilizers did not affect soil Mg availability in the 0-20 cm (Table 4) and 20-40 cm (Table 5) layers after the first and second harvests. According to Raij (2011), soil Mg availability is considered high
when it is greater than 0.8 cmolc dm-3, a level that
was not achieved in the present study.
Polynomial regressions showed that there was a linear fit only for Mehlich K (Figure 4), Ca (Figure 4B), and Si (Figure 4D) in the 0-20 cm soil layer after the first harvest. The K and Si availability increased, whereas the soil Ca decreased with higher TK47 fertilizer application levels. Conversely, soil Si decreased with higher KCl application levels. After the second harvest, soil K availability (Figure 4A) increased with higher K application levels for both sources. However, Si availability only increased with higher TK47 fertilizer levels (Figure 4D). A quadratic fit was found between soil Mg (0-20 cm layer) and KCl availability (Figure 4C). Soil Mg
increased until a maximum of 0.71 cmolc dm-3
with an application of 85 kg ha-1 K
2O (KCl), and
at higher application levels, soil Mg tended to
decrease. In the 20-40 cm layer, after the first and second harvests, higher TK47 fertilizer applications increased soil K (Figure 5A), Ca (Figure 5B) and Si (Figure 5D). Mg (Figure 5C) and soil pH (Figure 5E) also increased with greater TK47 fertilizer applications, but only after the first harvest.
The aim of this experiment was not to evaluate the corrective capacity of this fertilizer; therefore, lime was applied at recommended levels throughout. Nevertheless, the TK47 fertilizer did neutralise soil acidity because of the Ca and Mg oxides in this product.
Sandy soils with low levels of organic matter have low cation-exchange capacity (CEC) and therefore retain small amounts of cations and are more susceptible to nutrient leaching (Raij, 2011). Thus, the higher soil pH caused by the TK47 fertilizer probably contributed to a higher soil CEC that in turn led to the greater availability of K, Ca, and Mg in the soil and consequently the sugarcane. This occurs because the soil used in the present study has a low CEC (Raij, 2011) and contains clay minerals with predominantly pH-dependent charges. Additionally, it was found that in the 20-40 cm layer, after the first harvest, KCl reduced Ca (Figure 5B) and Mg (Figure 5C) availability as soil K availability increased. This was probably due to the chlorine released from the KCl.
According to Raij et al. (2001), most soils have a predominance of negative charges, and anions
such as NO3-, Cl- and SO4- are not adsorbed and
can thus be leached. These anions in the soil solution obey the electroneutrality principle and thus carry equivalent quantities of cations such as
Ca2+, Mg2+, and K+.
Therefore, many of the Cl- anions stay in soil
solution and can take up cations. This may have occurred with Ca and Mg, which decreased with higher levels of K from KCl.
In the current experiment, the highest sugarcane productivity was achieved with the
application of 121 kg ha-1 K
2O. The application
level to be used for the TK47 fertilizer is a viable
1.72 t ha-1. Even though the K level in TK47 (7%
K2O) is low, its effect is residual, avoiding the
Figure 5. Effects of K levels and sources on soil availability of K, Ca, Mg, and Si and pH in the 20-40 cm soil layer after the sugarcane harvest for variety SP832847, 2011/12 and 2012/13 crops (Usina Vale do São Simão, Chaveslandia, Minas Gerais State, Brazil). TK47 = Thermopotash; KCl = Potassium chloride; 5% significance level (*).
Conclusion
The TK47 fertilizer has a residual effect and can be used as a K source for sugarcane. This source of poorly water-soluble K was not initially advantageous compared to soluble sources, but over time, this source was found to be superior to soluble sources.
The maximum expected productivity of sugarcane
variety SP832847 using TK47 fertilizer is 132.61 t ha-1
at an application level of 121 kg ha-1 K
2O.
The TK47 fertilizer applied to the sugarcane plant provided K, Si, Ca, and Mg and raised the soil pH in both the cane crop and the first ratoon crop.
Acknowledgements
We are grateful to the Brazilian organisations Capes, Fapemig and CNPq. We are also grateful to Verde Fertilizante for supplying Thermopotash and to the owners and employees of the Usina Vale do São Simão.
References
Chiba, M. K., Natale,W., Cruz, M. C. P., Teixeira, L. A. J., & Centurion, J. F. (2008). Potássio nas frações texturais de um Latossolo. Acta Scientiarum. Agronomy, 30(4), 581-587. doi: 10.4025/actasciagron.v30i4.5321.
y = 0.0014x - 0.016 R² = 79%
y = 0.0009x + 0.046 R² = 96%
0.00 0.05 0.10 0.15 0.20 0.25 0.30 0.35 S oil K M eh lic h (c mo lc dm -3)
Harvest 1 TK47
Harvest 1 KCl
Harvest 2 TK47
Harvest 2 KCl
y = 0.0028x + 0.25 R² = 85%
y = -0.0011x + 0.37 R² = 82% y = 0.0052x + 0.87
R² = 87%
0.0 0.5 1.0 1.5 2.0 2.5 3.0 3.5 4.0 So il C a ( cm olc dm -3)
Harvest 1 TK47
Harvest 1 KCl
Harvest 2 TK47
Harvest 2 KCl
y = 0.0003x + 0.168 R² = 67 %
y = -0.0002x + 0.22 R² = 78%
0.00 0.05 0.10 0.15 0.20 0.25 0.30
0 50 100 150 200
So il M g ( cm olc dm -3)
K2O (kg ha-1)
Harvest 1 TK47
Harvest 1 KCl
y = 0.0041x + 1.022 R² = 84%
y = 0.0089x + 1.412 R² = 93%
0.0 0.5 1.0 1.5 2.0 2.5 3.0 3.5 4.0 4.5 5.0
0 50 100 150 200
So il S i ( m g d m -3)
K2O (kg ha-1)
Harvest 1 TK47
Harvest 1 KCl
Harvest 2 TK47
Harvest 2 KCl
y = 0.0014x + 6.776 R² = 95%
6.00 6.20 6.40 6.60 6.80 7.00 7.20 7.40 7.60 7.80 8.00
0 50 100 150 200
S oil p H (C aC l2 )
K2O (kg ha-1)
Harvest 1 TK47
Harvest 1 KCl
E D B C A ^ = -y -y ^ ^ ^ ^ ^ ^ ^ = -y -y ^ = -y -y
^ = -y -y ^ =
-y -y ^ = -y -y
^ ^ ^
Potassium in sugarcane Page 9 of 9
Ciceri, D., Manning, D. A. C., & Allanore, A. (2015). Historical and technical developments of potassium resources. Science of The Total Environment, 502(2), 590-601. doi: 10.1016/j.scitotenv.2014.09.013.
Datnoff, L. E., Snyder, G. H., & Korndörfer, G. H. (2001). Silicon in agriculture. Amsterdam, NE: Elsevier.
Duarte, I. N., Sousa, R. T. X., Korndorfer, G. H., & Pereira, H. S. (2015). Alternative potash fertilizer source for millet crop. Journal of Plant Nutrition, 38(12), 1961–1972. doi: 10.1080/01904167.2015.1009097.
Fageria, N. K., Baligar, V. C., & Jones, C. A. (2011). Growth and mineral nutrition of field crops (3rd ed.). London, UK: CRC Press.
Ferreira, D. F. (2011). SISVAR: Um sistema computacional de análise estatística. Ciência e Agrotecnologia, 35(6), 1039-1042. doi: 10.1590/S1413-70542011000600001.
Kumawat, P. D., Rajawat, B. S., & Rathod, A. D. (2016). Role of potassium nutrition in improving growth, yield and quality of sugarcane. Asian Journal of Science and Technology, 7(9), 3609-3613.
Manning, D. A. C. (2010). Mineral sources of potassium for plant nutrition. Agronomy for Sustainable Development, 30(2), 281-294. doi: 10.1051/agro/2009023.
McCray, J. M., Ji, S., Powell, G., Montes, G., Perdomo, R., & Luo, Y. (2010). Boundary lines used to determine sugarcane production limits at leaf nutrient concentrations less than optimum. Communications in Soil
Science and Plant Analysis, 41(5), 606-622. doi:
10.1080/00103620903531185.
Ministério da agricultura, Pecuária e Abastecimento. [MAPA] (2017).Manual de métodos analíticos oficiais para fertilizantes e corretivos. Brasília, DF: MAPA.
Nunes, J. M .G., Kautzmann, R. M., & Oliveira, C. (2014). Evaluation of the natural fertilizing potential of basalt dust waste from the mining district of Nova Prata (Brazil). Journal of Cleaner Production, 84(1), 649-656. doi: 10.1016/j.jclepro.2014.04.032.
Raij, B. van, Andrade, J. C., Cantarella, H., & Quaggio, J. A. (2001). Análise química para avaliação da fertilidade de solos tropicais. Campinas, SP: Editora do Instituto Agronômico. Raij, B. van (2011). Fertilidade do solo e manejo dos nutrientes.
Piracicaba, SP: Editora International Plant Nutrition Institute.
Setiyono, T. D., Walters, D. T., Cassman, K. G., Witt, C., & Dobermann, A. (2010). Estimating maize nutriente uptake requirements. Field Crops Research, 118(2), 158– 168. doi: 10.1016/j.fcr.2010.05.006.
Santos, W. O., Mattielo, E. M., Costa, L. M., Abrahão, W. A. P., Novais, R. F., & Cantarutti, R. B. (2015). Thermal and chemical solubilization of verdete for use as potassium fertilizer. International Journal of Mineral
Processing, 140(10), 72-78. doi:
10.1016/j.minpro.2015.05.003
Thangavelu, S. (2009). Mineral nutrition in sugarcane crop production and improvement. Texas, US: Stadium Press LLC.
Received on March 23, 2017. Accepted on October 17, 2017.
License information: This is an open-access article distributed under the terms of the Creative Commons Attribution License, which permits unrestricted use, distribution, and reproduction in any medium, provided the original work is properly cited.